
Abstract
Accurate assessment of college students’ mental health is difficult, as traditional questionnaire-based methods are often subjective and limited in predictive capacity. This study proposes a multi-level convolutional neural network (CNN) that integrates multimodal data sources, including self-assessment scales, behavioral indicators, and academic performance records. Data preprocessing involved normalization, categorical encoding, and fusion into structured matrices suitable for CNN input. To enhance interpretability, visualization tools such as heatmaps and accuracy curves were employed. The proposed model achieved an accuracy of 95.6%, outperforming conventional classifiers including SVM, RF, and GBDT. Beyond overall accuracy, the CNN demonstrated superior recall and F1 scores, attributable to its ability to capture cross-domain correlations such as the combined effects of stress levels, sleep patterns, and social interaction on psychological outcomes. These results highlight both methodological advantages and practical relevance. The framework not only improves prediction accuracy and transparency but also provides a foundation for early intervention and future multi-institutional, privacy-preserving mental health monitoring.
Plain Language Summary
This study is about using a complex computer system called a multi-level convolutional neural network (CNN) to better understand and predict the mental health of college students. Mental health issues like anxiety, depression, and stress are common among college students and can affect their studies and lives. Traditional ways of assessing mental health, such as questionnaires and interviews, have limitations. They rely on people’s subjective judgments and cannot track the mental health of many students in real-time. The researchers used a multi-level CNN, a type of artificial intelligence, to analyze data from questionnaires, social behavior, and academic performance of college students. The CNN can automatically extract important features and understand complex relationships in the data. The study found that this advanced computer model can accurately predict mental health conditions with a high level of accuracy (95.6%), which is better than traditional machine learning models like support vector machines (SVM), random forests (RF), and gradient boosting machines (GBDT). Moreover, the researchers used data visualization tools like heatmaps and accuracy curves to make the model’s predictions more understandable. This means that educators and mental health professionals can use these visual tools to identify key factors and early warning signs of mental health problems in students. The study shows that multi-level CNNs can be a reliable tool for early intervention strategies in educational settings, helping to improve the efficiency and accuracy of mental health assessments. In summary, this research demonstrates that advanced computer technology, specifically multi-level CNNs, can significantly enhance the assessment and prediction of mental health issues among college students. This approach offers a promising way to support students’ well-being by providing timely and personalized interventions.
Keywords
Introduction
Mental health problems among college students have become increasingly prominent, with depression, anxiety, and stress significantly influencing their academic outcomes, social relations, and overall well-being (C. Li et al., 2022; Miao, 2022). Traditional assessment methods—such as questionnaires, behavioral observation, and interviews—offer partial insights but are constrained by subjectivity, limited scalability, and difficulty in handling complex, multidimensional data (Anderson et al., 2019; Ying, 2025).
Recent advances in deep learning, particularly convolutional neural networks (CNNs), provide new opportunities for mental health evaluation. CNNs excel at extracting features and recognizing patterns from high-dimensional data, enabling effective analysis of diverse inputs such as questionnaires, behaviors, social interactions, and emotional fluctuations (Polhemus et al., 2022; Shinde et al., 2024; Zim & Kaur, 2023). Their hierarchical convolutional layers capture nonlinear correlations, facilitating accurate identification of risks like emotional instability, academic stress, and social difficulties (Arif et al., 2024; Bressane et al., 2024). CNNs also demonstrate robustness to noise and missing values, while integrated visualization tools—such as heatmaps and radar charts—enhance interpretability and guide targeted interventions (Kumari et al., 2026; Oyebode et al., 2023; Taskynbayeva & Gutoreva, 2025). Moreover, by incorporating heterogeneous data sources, including academic and lifestyle indicators, CNNs improve predictive accuracy. Transfer learning further reduces reliance on large datasets and strengthens generalizability, supporting practical application (Chato & Regentova, 2023).
This study is theoretically grounded in the Cognitive-Behavioral Theory (CBT), which emphasizes the interdependence of cognition, emotions, and behaviors, and the Stress-Vulnerability Model, which posits that environmental and personal factors jointly contribute to mental health risks. In the context of college students, academic performance, social interactions, and lifestyle behaviors represent critical external and internal factors influencing mental well-being.
Building on these theoretical perspectives, the current research develops the following hypotheses:
These hypotheses provide a testable linkage between psychological theories and computational modeling, ensuring that the empirical analysis is not only technically robust but also theoretically meaningful.
The accuracy and interpretability of mental health assessments for college students. The contributions of this study are as follows:
(1) Theoretical Contribution: By grounding the model in established psychological theories and formulating explicit hypotheses, the study connects computational modeling with mental health theory, offering an evidence-based extension of the Cognitive-Behavioral and Stress-Vulnerability frameworks.
(2) Methodological Contribution: We propose a novel multi-level CNN architecture with skip connections (direct links between non-adjacent layers that preserve information and ease model training) and visualization techniques, which enhances both prediction accuracy and interpretability for complex, multi-dimensional mental health data.
(3) Practical Contribution: The study demonstrates the feasibility of deploying AI-driven tools for real-time mental health monitoring in educational institutions. This has important implications for early detection, prevention, and targeted intervention strategies among students.
The remainder of this paper is structured as follows. Section 2 provides a comprehensive review of related studies on college students’ mental health assessment, highlighting the evolution from traditional approaches to machine learning methods. Section 3 introduces the proposed multi-level CNN framework, including the model architecture, data preprocessing strategies, and feature extraction techniques. Section 4 describes the experimental design, parameter settings, comparative models, and evaluation metrics, followed by a detailed presentation and analysis of the results. Section 5 summarizes the findings and outlines practical implications, while Section 6 discusses limitations and proposes future research directions.
Related Work
In recent years, the mental health issues of college students have gradually attracted widespread attention from the academic community both domestically and internationally, becoming an increasingly prominent social problem (Casalino et al., 2023). Numerous studies have shown that college students face mental health issues such as academic pressure, and emotional distress, which not only affect their academic performance and quality of life, but may also lead to long-term physical and mental health problems (Squires et al., 2023). Traditionally, the assessment of college students’ mental health has mainly relied on quantitative research tools such as self-assessment scales and questionnaire surveys. These methods can help identify students’ psychological distress to a certain extent but often overlook deeper and more complex relationships behind the data. These tools can help identify students’ psychological distress to a certain extent, but often overlook the deeper complex relationships and potential psychological states behind the data. In addition, due to its reliance on individual self-report, this method is susceptible to factors such as emotional fluctuations and cognitive biases, which can limit the accuracy and reliability of the data (Srinivas et al., 2025; Zhou et al., 2022). These traditional methods often lack refined analysis of the multidimensional and complex correlations between mental health states, making it difficult to capture the dynamic characteristics of students’ psychological changes.
In recent years, the rapid progress of data science and artificial intelligence—particularly deep learning—has enabled psychological health studies on college students to become more refined and evidence-driven (Chen et al., 2024; Quan, 2024). Convolutional Neural Networks (CNN), with strong feature extraction ability, can effectively analyze multidimensional data such as emotions, behaviors, and social interactions, enabling accurate modeling and dynamic monitoring. This progress improves both the accuracy of assessment and the feasibility of targeted interventions.
Nevertheless, challenges remain in applying deep learning to mental health data. Handling heterogeneous sources such as text, audio, and video, and extracting meaningful features from high-dimensional inputs, is still difficult (Gu, 2025; Sharma et al., 2025). Although CNNs can enhance prediction, further work is needed to transform computational results into actionable psychological strategies (Madububambachu et al., 2024). Current studies remain exploratory, lacking mature models and intervention systems. Thus, developing reliable, scalable, and practical assessment frameworks is an urgent need. Large-scale screening and prevention also pose practical challenges for universities (Chung & Teo, 2022; Shin et al., 2022).
With improvements in big data and computing power, CNN-based systems are evolving toward personalized and real-time monitoring (Omiyefa, 2025). Combining diverse data sources—including academic outcomes, daily habits, and social behaviors—allows for a more holistic understanding of students’ mental states and supports more targeted intervention strategies. CNNs can also uncover deeper risk factors, including sleep quality and social networks, that influence students’ psychological states (Zhang et al., 2024). To further improve performance, researchers have explored transfer and reinforcement learning, using pre-training to reduce data requirements and adapt to individual needs. Meanwhile, smartphones and wearables provide real-time data collection, enhancing timeliness and continuity of monitoring (Mehnaz et al., 2025).
Despite these advances, unresolved issues remain, such as ensuring privacy, reducing bias in multimodal fusion, and establishing effective feedback mechanisms for interventions (Snoek et al., 2025). Future research should emphasize combining technology with ethics and theory, improving accuracy while safeguarding students’ privacy and psychological well-being.
In summary, accurate modeling and assessment of mental health issues among college students is an important direction in current psychological research. With the continuous development and application of deep learning technology, future mental health analysis systems based on convolutional neural networks will be able to provide more personalized and scientific mental health assessment and intervention plans for college students, effectively promoting the comprehensive development of students’ physical and mental health.
These developments highlight the limitations of traditional approaches and point to an increasing need for data-driven methods capable of capturing complex psychological patterns. As a result, machine learning—especially deep learning—has become an essential direction for advancing mental health analysis.
In recent years, machine learning has advanced mental health research. Traditional methods such as regression and clustering provide some insights but often fail to capture complex nonlinear relationships due to data requirements and simple model structures. Compared to traditional machine learning methods, deep learning models have achieved success in fields such as image understanding and language processing (Priyadharshini et al., 2024). Psychological health datasets typically involve complex attributes, including emotional variability, behavioral tendencies, and patterns of social interaction, which conventional techniques struggle to characterize effectively (Olawade et al., 2024). Owing to their layered architecture, CNNs can autonomously capture multi-level representations, enabling more detailed and nuanced modeling of college students’ mental health states (P. Li & Liang, 2022).
Effective modeling requires rigorous preprocessing of multimodal inputs from questionnaires, social media, academic records, and lifestyle habits. Feature fusion allows CNNs to identify both low- and high-level patterns, such as emotional instability, social withdrawal, or irregular sleep, thereby improving adaptability and accuracy (Guo et al., 2022). Unlike expert-crafted features, CNNs learn end-to-end representations, optimized through backpropagation to enhance prediction robustness (Torlapati et al., 2023). Hybrid approaches combining CNNs with RNNs or LSTMs further capture temporal dynamics for more accurate state prediction (Demiss & Elsaigh, 2024; Ullah et al., 2024).
Although promising, CNN-based models face challenges. Ensuring privacy and data security is essential due to the sensitivity of mental health information. Another concern is generalization across populations and contexts, which researchers address with techniques such as data augmentation and transfer learning (Gholizade et al., 2025; Malik et al., 2024). Despite these issues, multi-level CNNs provide precise assessments, enhance prediction reliability, and support effective psychological interventions, ultimately contributing to students’ well-being.
Model and Algorithm Design
Architecture of the Multi-Level CNN for Mental Health Modeling
To achieve precise modeling and visualization analysis of college students’ mental health information, this study employs a multi-layer convolutional neural network (CNN). The structure of a multi-layer CNN is shown in Figure 1.

The multi-layer CNN model.
Unlike general CNN applications in vision or text, the architectural choice is guided by the unique characteristics of college students’ mental health data. Such data are inherently multimodal (questionnaire responses, behavioral logs, social interactions, academic records), temporal (emotional fluctuations across time), and latent (psychological constructs like resilience are not directly observable). We hypothesize that the hierarchical feature extraction of multi-level CNN naturally corresponds to these properties. At the first layers, convolutional filters capture low-level variations (e.g., changes in mood scores, sleep hours). Mid-level layers integrate these signals into behavioral and social interaction patterns (e.g., academic pressure coupled with social withdrawal). Higher-level layers abstract these patterns into latent psychological constructs, aligning with psychological theories that mental health states are emergent from interacting emotional, behavioral, and cognitive dimensions. Skip connections prevent vanishing gradients problem (the difficulty of training very deep networks because early layers stop receiving effective updates) and further ensure that fine-grained signals (e.g., sudden emotional fluctuations) are preserved when learning higher-level constructs, avoiding over-abstraction. Thus, the proposed architecture is not only a technical design but also a theory-informed mapping of hierarchical psychological structures into computational representations.
The proposed CNN architecture is composed of several convolutional and pooling layers, followed by fully connected layers that perform the final classification. Convolution filters iteratively refine feature representations, while pooling operations compress the feature maps and retain key information. The outputs are then aggregated through fully connected layers to generate predictions for mental health categories such as anxiety, depression, and stress. To prevent overfitting, techniques such as regularization and dropout were incorporated. The network concludes with a softmax layer that produces probability distributions across the psychological health classes.
Although other deep learning models such as recurrent neural networks (RNNs) and fully connected networks (FNNs) can also be applied, CNNs are more suitable for this study. RNNs are effective for sequential data and temporal patterns, but CNNs outperform in capturing spatial structures and extracting features from multimodal, high-dimensional inputs. Their efficiency in integrating diverse data types, including text and numerical values, makes CNNs the preferred choice in this context.
Data Processing and Model Design
During preprocessing, all raw features were standardized by subtracting the mean and dividing by the standard deviation to maintain a consistent scale and prevent any single variable from disproportionately influencing model training (Huang & Jiang, 2025). The transformation is defined as:

Among them, X denotes the original feature value, μ its mean, σ the corresponding standard deviation, and
And, missing values were handled using mean imputation, in which each absent entry was replaced with the average of its corresponding feature to reduce information loss. the imputed value is calculated as:

Among them,
To improve data quality, low-pass filters (e.g., mean or Gaussian) were applied to suppress high-frequency noise, smoothing fluctuations and retaining essential feature signals.
It should also be noted that low-pass filtering was applied only to behavioral and time-series related features, such as daily sleep hours, weekly social interaction frequency, and academic activity logs. The purpose was to smooth out abrupt fluctuations caused by reporting errors or logging artifacts. Questionnaire-based data were not subjected to filtering, but only standardized and imputed where necessary.
After preprocessing, feature extraction was conducted using Principal Component Analysis (PCA). PCA can extract features from data to obtain more data information. The equation is as follows:

Among them, X represents the original data,
The features obtained from PCA are subsequently fed into the CNN, which captures underlying patterns by learning spatial and higher-order representations across multiple layers. A typical convolution operation is defined as:

Among them, W is the convolution kernel, b denotes the bias term and

After the convolution and pooling stages, the resulting feature vector is fed into a fully connected layer with nonlinear activation to perform the classification of students’ mental health states. This multi-level CNN effectively extracts key patterns, offering reliable support for psychological assessment and intervention.
To ensure that multimodal data could be effectively processed by the CNN, a structured data fusion pipeline was designed.
First, each feature type was preprocessed individually:
Numerical features (e.g., anxiety score, GPA, study hours) were normalized to [0,1]; Categorical features (e.g., nutrition quality, family support) were converted into one-hot encoded vectors; Binary features (e.g., substance use, peer pressure) were represented as {0,1}.
After preprocessing, all feature vectors were concatenated into a feature matrix for each student, where:
Rows represent different feature groups (psychological scales, academic indicators, behavioral data); Columns represent feature dimensions within each group (e.g., sleep hours, social media usage).
In this way, each student is represented by a 2D matrix input, analogous to an image, where convolutional kernels can slide across feature groups and detect cross-domain patterns (e.g., correlation between “high stress” and “low academic engagement”).
To better preserve heterogeneity, we applied a group-wise normalization strategy before concatenation, ensuring that features from questionnaires, academic records, and behavior logs contributed proportionally. Finally, the fused matrices were stacked into a 3D tensor (samples × features × channels), which served as the CNN input.
By leveraging hierarchical feature extraction of CNNs, the approach captures the multi-dimensional nature of students’ psychological profiles—including emotional states, behavioral habits, and cognitive attributes. The network integrates multiple convolutional, pooling, and fully connected layers to progressively learn high-level abstractions and latent patterns. Convolutional operations apply sliding windows to extract localized features, with kernels in each layer learning increasingly complex representations suited to the intricate structure of mental health data. Formally, the convolution operation can be expressed as:

Among them, W denotes the convolution kernel,

During training, model parameters are updated using gradient descent and its variants (e.g., Adam), and cross-validation is employed to select appropriate hyperparameters and enhance generalization. This CNN-based framework effectively captures key multidimensional patterns, resulting in more accurate predictions of students’ psychological states.
Visualization and Model Interpretation
This study proposes a deep learning–driven visualization framework to improve both the clarity and practical value of CNN outputs in college students’ mental health assessment. Given the multidimensional nature of mental health data (emotions, behaviors, cognition), CNNs can capture deep features but are often difficult for experts to interpret. Visualization tools—such as charts, heatmaps, and cluster analysis—address this gap by showing how input features activate network layers and by identifying which factors most affect predictions. These insights highlight critical indicators, including emotional or behavioral changes, thereby making the model more transparent and credible.
Integrating visualization techniques helps connect model outputs with expert interpretation while revealing potential biases or anomalies, thereby improving the reliability of predictions. The entire pseudocode is described as follows:

In addition to improving transparency, the visualization outputs provided actionable psychological insights that extend beyond algorithmic interpretation. For instance, heatmaps revealed that the co-occurrence of irregular sleep, high academic stress, and limited family support was a strong predictor of anxiety, which aligns with the stress–vulnerability model. Clustering analysis identified meaningful subgroups, such as students with high depressive tendencies but low peer interaction, suggesting the need for peer-support–focused interventions. Moreover, feature-importance plots highlighted that lifestyle indicators (e.g., physical activity, sleep consistency) carried predictive weight comparable to standardized self-assessment scales, underscoring their value for early non-clinical screening. These findings illustrate how interpretability tools can bridge computational outputs with psychological constructs, enabling educators and counselors to validate model reasoning, prioritize intervention targets, and design data-driven preventive strategies. The detailed process as shown in Figure 2.

Process diagram of psychological health assessment based on multi-level CNN architecture.
Experimental Validation and Analysis
Data Details and Parameter Configuration
The dataset was collected from universities, and the simulated community is shown in Figure 3. The dataset comprises self-assessment data, questionnaire results, and psychological characteristics of college students from multiple colleges, covering dimensions like emotional states, behaviors, and cognitive patterns. Data collection took place from January 3, 2024, to June 30, 2024, ensuring a 6-month temporal span.

Data collection framework in the university virtual community.
In total, the dataset contains 5,000 student samples across diverse academic backgrounds and social contexts, providing rich variability for model training. Each student record covers 25 mental health dimensions, including anxiety, depression, stress, sleep quality, academic performance, social interaction, self-esteem, physical activity, family and peer support, and lifestyle factors. Standardized scales such as GAD-7, PHQ-9, and PSS were employed for anxiety, depression, and stress assessment.
To improve reliability, all self-reported data were supplemented by professional review: trained counselors and psychologists examined the responses to provide additional judgment and context. This process mitigated reporting bias and ensured clinical interpretability. The dataset’s multimodal structure—spanning psychological scales, academic indicators, and behavioral logs—offers broad coverage of students’ mental health scenarios and strengthens the generalizability of experimental results.
All participants provided written informed consent, with parental/guardian consent for those under age of 16. Strict data confidentiality and privacy protocols were followed to ensure anonymization and research-only use.
To ensure reproducibility and methodological transparency, we explicitly define the experimental setup as follows. During data preprocessing, numerical features (e.g., sleep hours, academic stress scores) were normalized to the range [0,1] using min–max scaling. Missing numerical values were imputed with the mean of the corresponding feature, while categorical variables (e.g., nutrition quality, peer support) were imputed using the mode and encoded via one-hot or binary encoding. For model training, the dataset was divided into 80% training data and 20% validation data, and k-fold cross-validation (k = 5) was employed to minimize overfitting and improve generalizability.
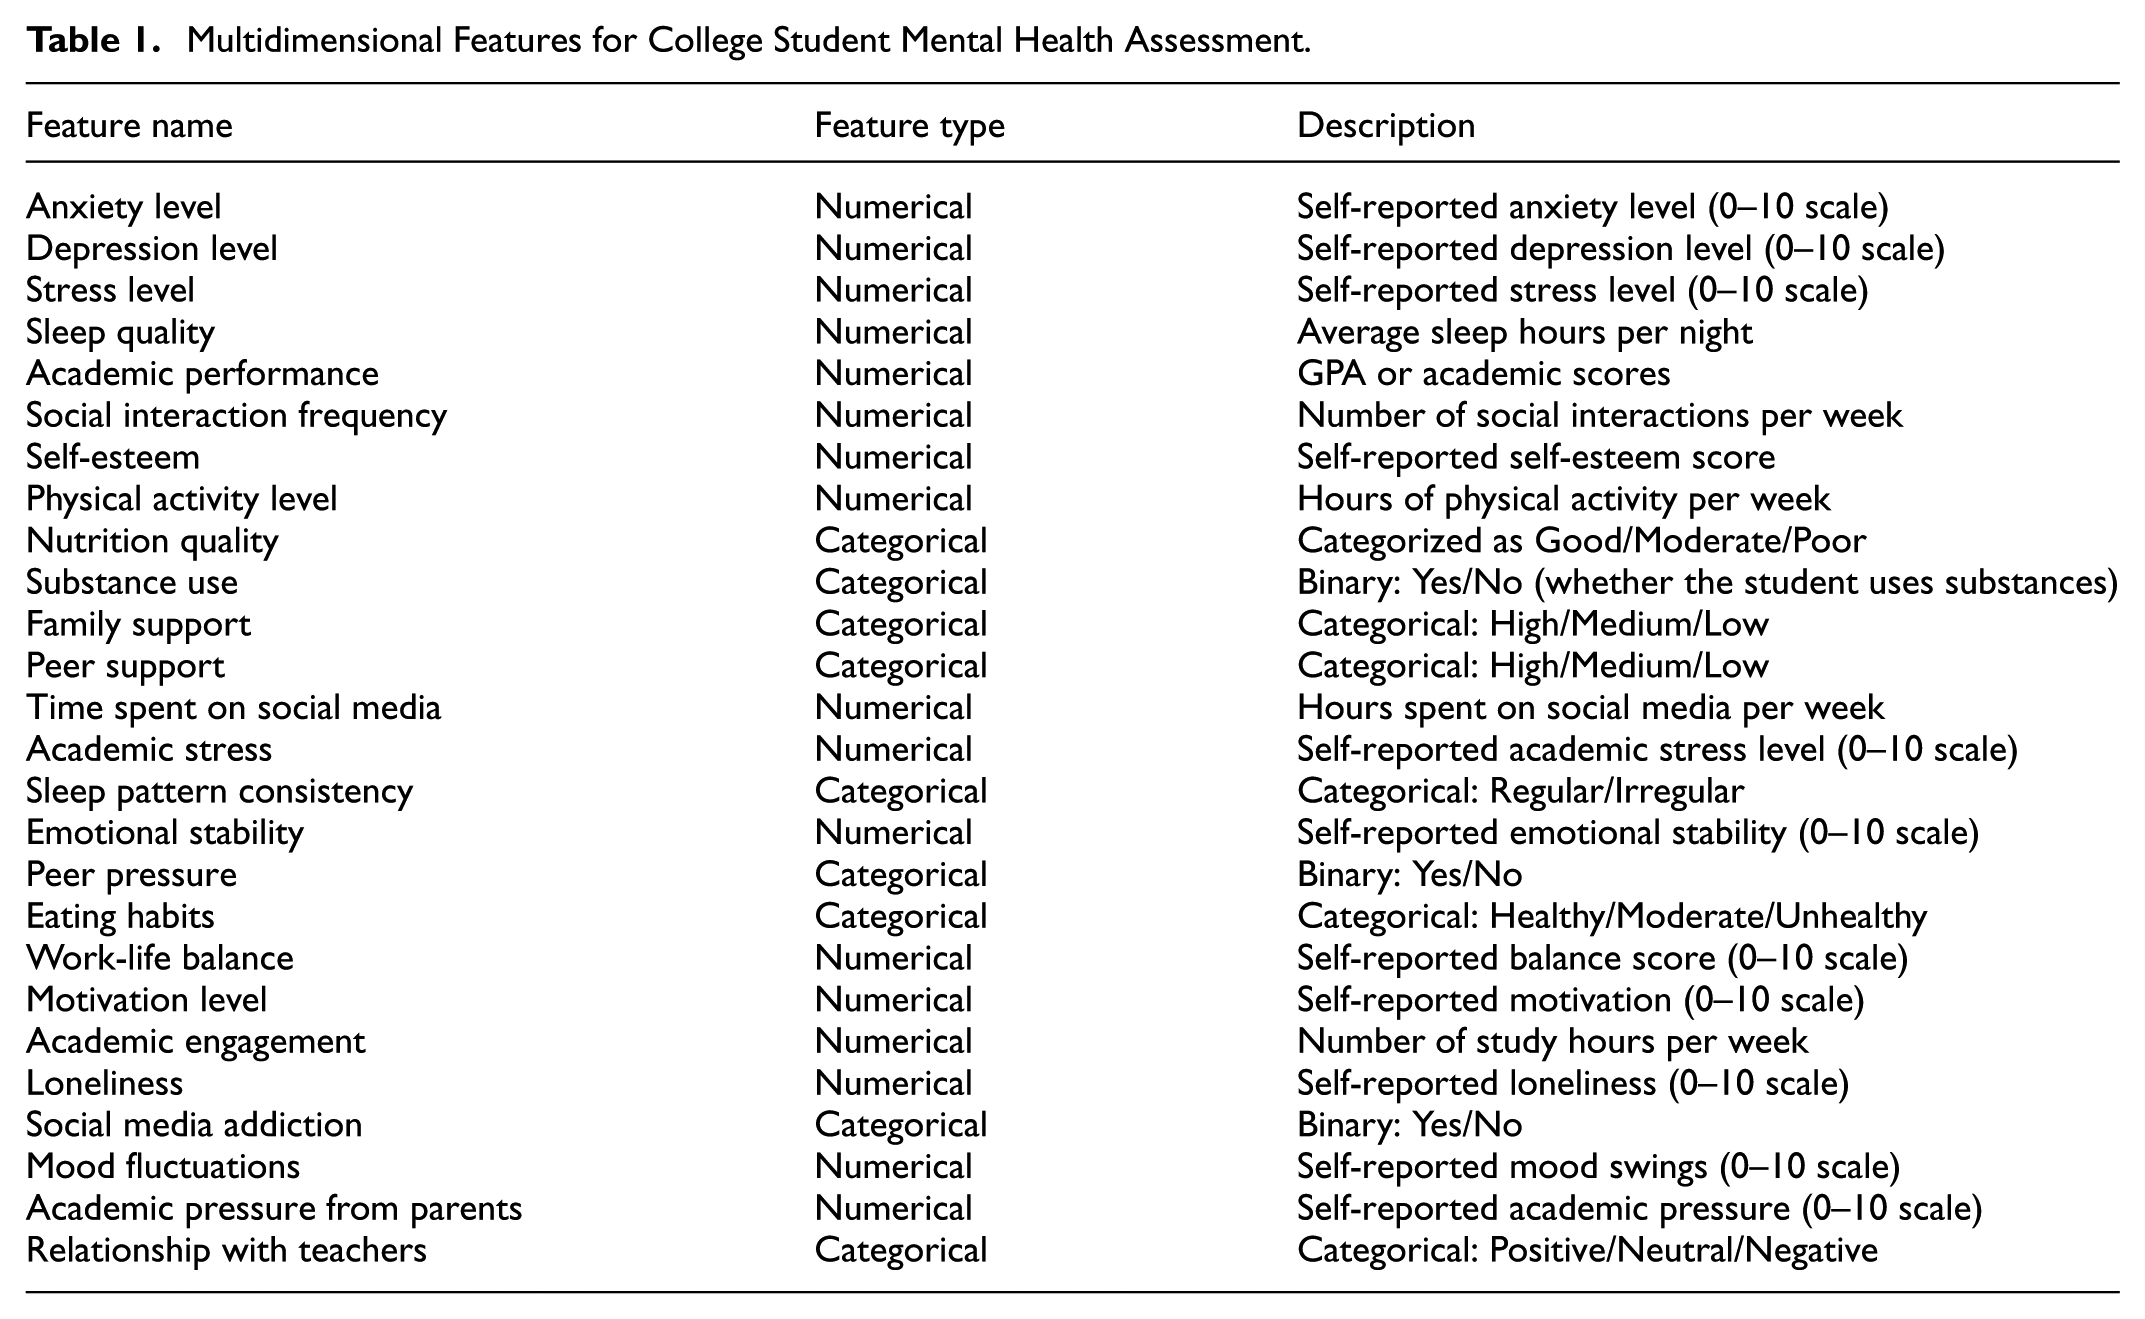
To evaluate model performance, we employed multiple complementary metrics: accuracy to assess overall correctness, precision and recall are used to measure the model’s recognition performance, and the F1-score as a balanced indicator under class imbalance. Together, these metrics offer a comprehensive and transparent foundation for evaluating and reproducing our experimental results. The psychological health assessment characteristics are shown in Table 1.
Multidimensional Features for College Student Mental Health Assessment.
To ensure reproducibility and methodological transparency, we explicitly define the experimental setup as follows. During data preprocessing, numerical features (e.g., sleep hours, academic stress scores) were normalized to the range [0,1] using min–max scaling. Missing numerical values were imputed with the mean of the corresponding feature, while categorical variables (e.g., nutrition quality, peer support) were imputed using the mode and encoded via one-hot or binary encoding. For model training, the dataset was divided into 80% training data and 20% validation data, and k-fold cross-validation (k = 5) was employed to minimize overfitting and improve generalizability.
To evaluate model performance, we employed several complementary metrics: accuracy for overall correctness, precision and recall for identifying mental health risks, and the F1-score to balance performance under class imbalance. These indicators together provide a clear and reproducible basis for assessing the model. The corresponding experimental parameter settings are summarized in Table 2.
Experimental Configuration and Model Parameters.

Model Training, Baseline Comparisons, and Evaluation Metrics
During model training, the proposed multi-level CNN was optimized on the training set using gradient descent, while an independent validation set was used to assess generalization performance.
To further verify the effectiveness of the CNN in modeling college students’ mental health, we compared it with three representative baseline methods: Support Vector Machine (SVM), Random Forest (RF), and Gradient Boosting Decision Tree (GBDT). SVM performs well on high-dimensional, small-sample datasets by constructing optimal separating hyperplanes, but its performance declines when feature patterns grow complex or kernel parameters become difficult to tune. RF, as an ensemble of decision trees, offers strong generalization in high-dimensional spaces, though it lacks interpretability and may require longer training time. GBDT improves prediction accuracy through iterative loss optimization and effective modeling of feature interactions, but it is computationally intensive and sensitive to hyperparameter settings, especially for large-scale data.
The comparison was conducted in terms of accuracy, stability, and interpretability, using metrics such as accuracy, precision, recall, and F1 score to comprehensively evaluate the models’ ability to handle complex mental health data.
Accuracy is an intuitive metric that measures the proportion of correctly classified samples, defined as:

Among them,
Precision evaluates the proportion of predicted positive samples that are truly positive, reflecting the model’s reliability in identifying specific mental health risks:

Recall measures the proportion of actual positive samples correctly detected, indicating the model’s sensitivity in identifying genuine psychological issues:

The F1-score, the harmonic mean of precision and recall, provides a balanced measure of performance, particularly useful under class imbalance:

These metrics provide comprehensive feedback on CNN performance. CNN typically employ cross-entropy loss to guide parameter updates and reduce prediction errors:

Among them,
To enhance generalization and reduce overfitting, L2 regularization is also applied:

Regularization constrains weight magnitudes and helps the model maintain stable performance on unseen data. Through the combined use of these loss functions, optimization strategies, and evaluation indicators, the proposed multi-level CNN achieves more precise mental health prediction and supports deeper expert interpretation through visualization, thereby informing more effective intervention strategies.
Comprehensive Evaluation and Interpretation of Experimental Results
Building on the evaluation metrics and baseline configurations presented in Section 4.2, this section delivers an integrated assessment of the proposed multi-level CNN across multiple experimental dimensions. The analysis moves beyond single-metric reporting by examining convergence behavior, feature-learning efficiency, robustness under hyperparameter perturbations, and comparative performance against both traditional machine learning models and advanced deep architectures. Through coordinated evaluations of accuracy, F1 score, loss dynamics, and cross-dataset generalization, the results collectively substantiate the model’s capacity to capture complex, nonlinear psychological patterns. The following experiments therefore provide a systematic and evidence-based interpretation of the CNN’s predictive advantages and its applicability to real-world mental health assessment tasks.
Experiment 1: Baseline Training Behavior and Sensitivity to Hyperparameters
To examine how architectural and optimization-related parameters influence the learning behavior of the proposed multi-level CNN, the study conducted a controlled hyperparameter sensitivity analysis. Two representative hyperparameters—reflecting adjustments in network capacity and training intensity—were systematically varied to observe their effect on performance. Table 3 presents the resulting performance landscape, offering a quantitative basis for understanding how different hyperparameter combinations shape the model’s ability to learn complex psychological feature patterns.
Training Performance Landscape Across Hyperparameter Combinations.

As shown in Table 3, the study finds a consistent upward trend in training performance as both hyperparameters increase. Incremental enhancements in either parameter yield measurable accuracy gains, indicating that larger network capacity and stronger optimization contribute to more effective representation learning. The highest performance value, 0.85, is achieved when both hyperparameters reach level 3, reflecting a synergistic effect in capturing deeper and more complex feature interactions.
The smooth performance progression across all parameter settings suggests that the model exhibits stable convergence behavior and avoids issues such as gradient instability or premature overfitting during training. These results indicate that the multi-level CNN benefits from higher-capacity configurations and provide empirical guidance for selecting optimized hyperparameter combinations in subsequent experimental stages.
To intuitively examine how different hyperparameter settings influence the learning behavior of the proposed multi-level CNN, the training performance obtained from the nine hyperparameter combinations is visualized using a heatmap. As shown in Figure 4, this representation provides a clear overview of the performance landscape, allowing us to observe how variations in Hyperparameter 1 and Hyperparameter 2 jointly affect the model’s optimization efficiency.
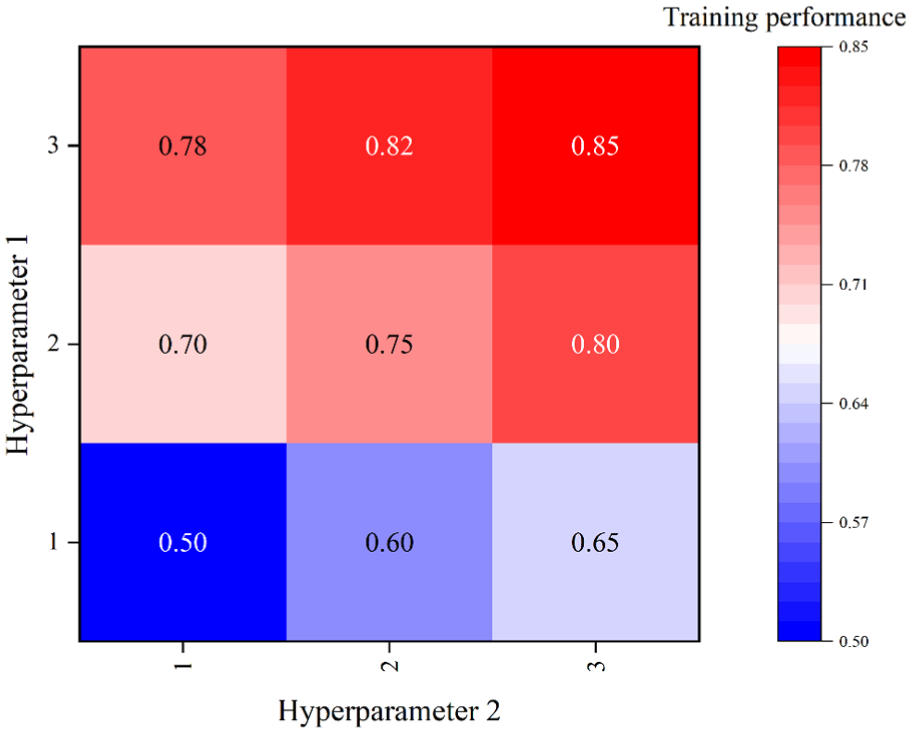
Heatmap of CNN training performance under different hyperparameter combinations.
As shown in Figure 4, the training performance demonstrates a clear upward trend as the two hyperparameters increase. When both parameters are set to their lowest values, the model reaches the minimum performance of 0.50. Increasing either parameter yields noticeable gains, indicating that larger network capacity and stronger optimization settings independently enhance feature learning. The highest performance (0.85) is achieved at the combination (3, 3), suggesting a synergistic improvement when both hyperparameters are simultaneously elevated. This monotonic pattern verifies that the proposed multi-level CNN benefits from higher-capacity configurations and provides practical guidance for selecting optimal hyperparameter settings.
Experiment 2: Performance Contrast Between CNN and SVM Classifiers
To further quantify the performance differences between the multi-level CNN and the SVM baseline, the study compared their accuracy trajectories across 100 training epochs under consistent experimental conditions. Table 4 summarizes the training and validation accuracy achieved by both models, providing a detailed view of their learning behavior over time. In addition to the tabulated results, Figure 5 visualizes the accuracy curves of the two models, offering an intuitive comparison of their convergence patterns and performance evolution throughout the training process.
Accuracy Comparison Between CNN and SVM Models Across Training Epochs.


Accuracy curves of the CNN and SVM models.
As shown in Table 4 and Figure 5, the multi-level CNN consistently outperforms the SVM throughout the entire training process. At early epochs, the accuracy gap between the two models is already evident, with the CNN achieving 82.4% validation accuracy compared to the SVM’s 78.2%. As training progresses, this gap widens steadily, reflecting the CNN’s superior ability to extract hierarchical and nonlinear patterns from the multimodal mental health data.
By epoch 100, the CNN reaches 93.8% validation accuracy, surpassing the SVM’s 85.2% by a substantial margin. The smoother and steeper accuracy progression observed for the CNN suggests more effective convergence behavior and a higher capacity to utilize additional training epochs. In contrast, the SVM exhibits early plateauing, indicating limited flexibility in modeling complex feature interactions despite marginal improvements with additional training.
Overall, the accuracy trajectories demonstrate that the multi-level CNN provides a more scalable and expressive predictive framework than the SVM. Its ability to maintain continuous accuracy gains across epochs underscores its suitability for capturing the rich, cross-domain characteristics inherent in mental health assessment data.
Experiment 3: Comparative Evaluation of the CNN and Random Forest Models
To further assess the comparative behavior of traditional ensemble learning and deep hierarchical models in handling mental health data, the study conducted a performance evaluation between the Random Forest classifier and the multi-level CNN. Table 5 summarizes key statistical indicators—including the mean, standard deviation, and value range—across repeated experimental runs, providing a quantitative baseline for understanding model stability and accuracy. In addition, Figure 6 presents the density distribution of prediction results for both models, offering a visual perspective on their variability and concentration patterns.
Statistical Comparison Between the Random Forest and CNN Models.


Statistical comparison results: (a) Random Forest and (b) CNN.
As indicated in Table 5, the CNN model demonstrates clear advantages over the Random Forest classifier across multiple statistical dimensions. The CNN achieves a higher mean performance value (0.96 vs. 0.86) and exhibits lower variance (standard deviation of 0.10 vs. 0.15), suggesting stronger predictive consistency and reduced sensitivity to data fluctuations. Both models reach similar maximum values, but the CNN maintains a higher minimum performance level, indicating more reliable behavior in less favorable cases.
These numerical trends are visually reinforced by the density plots in Figure 6. The Random Forest distribution appears wider and more dispersed, reflecting higher variability and occasional low-performing outliers. In contrast, the CNN distribution is more sharply concentrated around higher values, indicating a more stable and tighter clustering of prediction outcomes. This concentrated density pattern aligns with the CNN’s deeper feature extraction capabilities, enabling it to capture complex and nonlinear relationships that the Random Forest model is less capable of modeling.
Overall, the combined evidence from Table 5 and Figure 6 confirms that the multi-level CNN offers superior accuracy, stability, and robustness relative to the Random Forest classifier, underscoring its suitability for analyzing multimodal mental health data.
Experiment 4: Comparative Performance Analysis of the CNN and GBDT Models
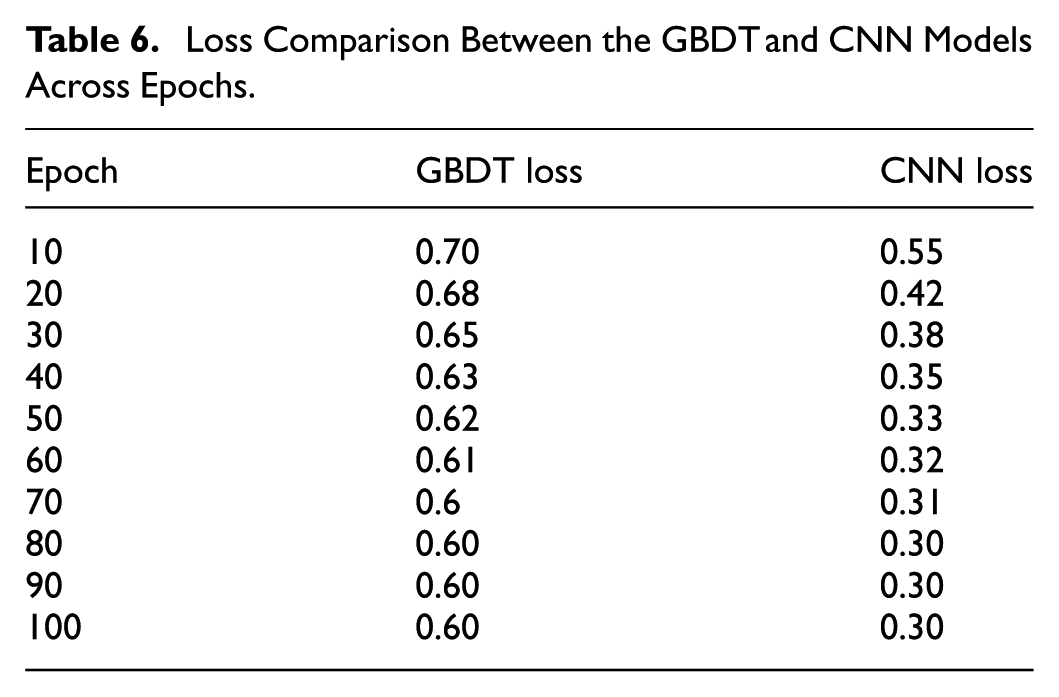
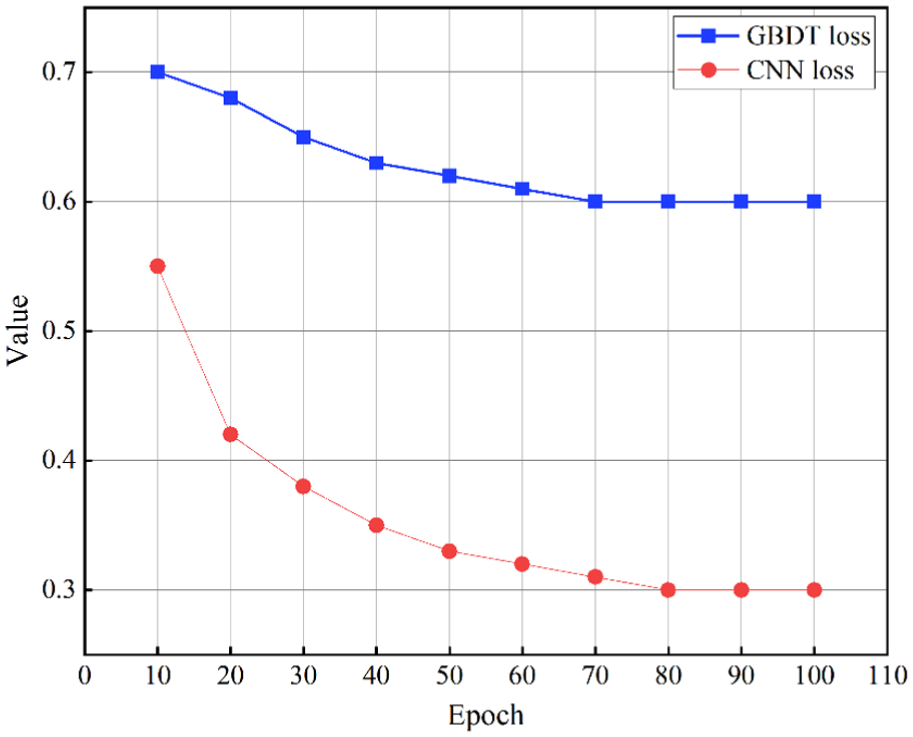
To evaluate the learning efficiency and convergence behavior of traditional boosting methods relative to deep convolutional architectures, the study further compared the loss trajectories of the GBDT model and the multi-level CNN. Table 6 reports the loss values across multiple training epochs, providing a numerical perspective on how rapidly and effectively each model minimizes prediction error. Complementing these tabulated results, Figure 7 visualizes the loss curves of both models, enabling a clearer interpretation of their optimization dynamics throughout the training process.
Loss Comparison Between the GBDT and CNN Models Across Epochs.
Loss curves of the CNN and GBDT models.
As shown in Table 6, the multi-level CNN demonstrates a markedly faster and more consistent reduction in loss compared with the GBDT model. While the GBDT exhibits only modest improvements—declining from 0.70 to 0.60 and stabilizing thereafter—the CNN achieves a substantial decrease from 0.55 to 0.30 over the same training period. This progressive reduction indicates that the CNN more effectively captures nonlinear patterns and adjusts its parameters through gradient-based optimization.
The trends observed in the loss curves of Figure 7 reinforce these findings. The CNN curve displays a smooth, steep downward trajectory, reflecting efficient convergence and strong representational learning. In contrast, the GBDT curve flattens early, suggesting limited optimization flexibility and a tendency to reach a saturation point despite additional training epochs. This behavior highlights fundamental differences between the two approaches: while GBDT relies on sequential tree boosting with constrained learning capacity, the CNN benefits from hierarchical feature extraction and end-to-end learning, enabling it to reduce error more effectively.
Taken together, the loss statistics and visual patterns confirm that the multi-level CNN not only converges faster but also achieves a significantly lower final loss, demonstrating superior learning efficiency compared with the GBDT model.
Experiment 5: Accuracy Comparison Across Multiple Models
To provide a broader benchmarking perspective, the study extended the comparative analysis to include four representative models: the multi-level CNN, SVM, GBDT, and Random Forest. Table 7 reports the accuracy trajectories of all models over 100 training epochs, allowing a direct comparison of their learning dynamics and classification performance. This multi-model evaluation offers a comprehensive view of how traditional approaches and the proposed CNN differ in their ability to extract and utilize complex patterns in mental health data.
Accuracy Comparison Across Multiple Models.
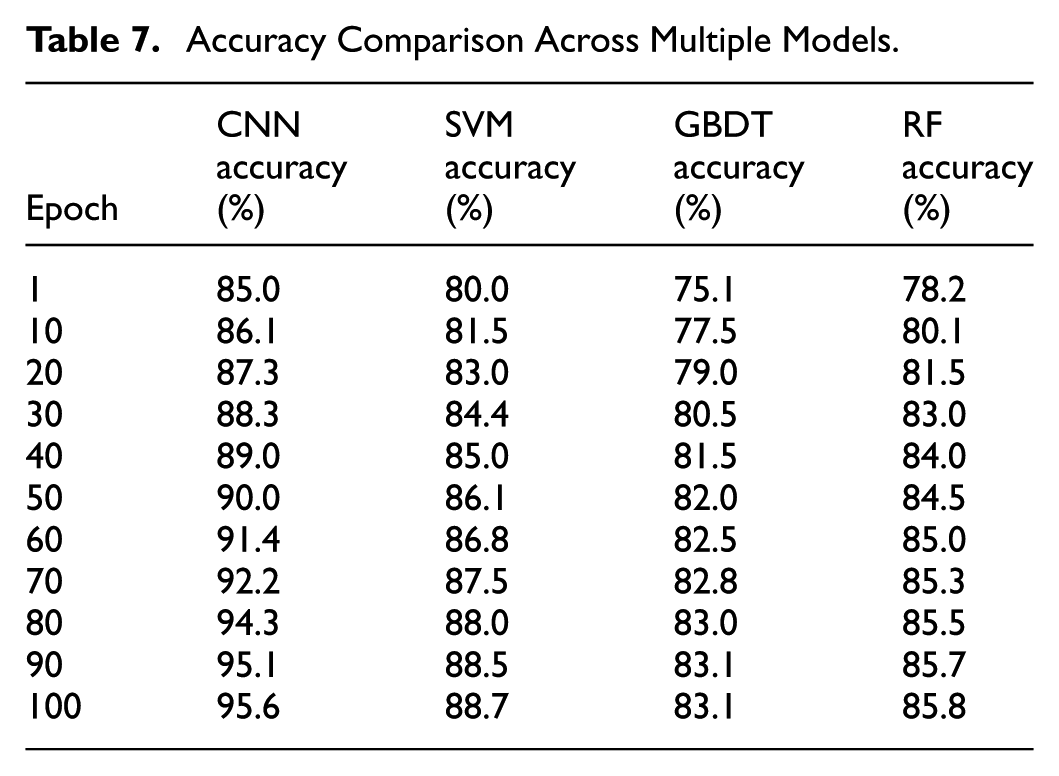
As shown in Table 7, the CNN exhibits the highest and most consistent performance among all evaluated models. Its accuracy increases steadily from 85.0% to 95.6%, demonstrating strong scalability and effective feature learning with additional training epochs. The SVM shows moderate improvement, ultimately stabilizing at 88.7%, while the Random Forest and GBDT models plateau earlier at 85.8% and 83.1%, respectively. The widening performance gap across epochs highlights key differences in representational capacity. The CNN’s hierarchical convolutions allow it to capture nonlinear interactions and multimodal dependencies that traditional machine learning models struggle to learn. In contrast, the SVM, RF, and GBDT curves show early saturation, suggesting limited ability to leverage prolonged training for improved accuracy.
Overall, the results confirm that the multi-level CNN achieves superior accuracy, stronger convergence behavior, and better adaptive learning compared with traditional classifiers, reinforcing its suitability for modeling the complex structure of mental health data.
Experiment 6: Performance Evaluation at Different Network Depths
To research how network depth influences learning efficiency, the study compared the training loss patterns of CNN models configured with two, three, and four convolutional layers. Table 8 summarizes the loss values across 10 epochs for each configuration, offering a numerical perspective on how deeper architectures affect convergence behavior. To provide a more intuitive depiction of these trends, Figure 8 visualizes the loss dynamics using a heat map, enabling clearer observation of performance variations across different depth levels.
Training Loss Statistics for CNN Models With Different Network Depths.


Heatmap of training loss across CNN models with different depths.
As reflected in Table 8 and Figure 8, deeper CNN architectures consistently achieve lower loss values across training epochs. The two-layer model shows a gradual decline from 0.90 to 0.45, while the three-layer network further improves this trend, reducing loss from 0.85 to 0.40. The four-layer configuration demonstrates the most efficient learning behavior, achieving the lowest final loss of 0.35. These patterns indicate that increased network depth enhances the model’s ability to extract hierarchical features and capture more complex relationships within the mental health dataset. Collectively, the numerical and visual evidence demonstrates that network depth is a key factor in improving CNN learning performance. Deeper architectures exhibit enhanced optimization behavior, lower final loss, and greater stability, supporting their use in modeling the complex, multimodal nature of mental health assessment data.
Experiment 7: Effect of Data Augmentation on CNN Feature Stability
To further evaluate how data augmentation influences the internal representation learned by the CNN, this experiment analyzes two structural metrics derived from the penultimate feature layer:
(1) Intra-class variance, which measures the compactness of feature clusters, and
(2) Inter-class centroid distance, which reflects the separability between different categories.
These metrics offer a quantitative perspective on how augmentation reshapes the feature manifold without relying on additional visualization.
Table 9 summarizes the comparative results before and after augmentation. The intra-class variance consistently decreases after augmentation across all network depths, indicating that the synthetic samples help tighten the distribution of features within the same category. Meanwhile, the distances between class centroids increase, demonstrating enhanced inter-class distinction and improved discriminative structure.
Quantitative Comparison of Feature Stability Before and After Data Augmentation.

These improvements align with the performance gains observed in the accuracy and loss experiments, confirming that data augmentation not only increases sample diversity but also contributes to more stable and robust feature learning within the CNN architecture.
As shown in Table 8, data augmentation consistently reduces intra-class variance and enlarges the separation between class centroids across all model depths. This indicates that augmented samples encourage the CNN to form more compact and better-organized clusters in the feature space.
The increased centroid distances demonstrate enhanced discriminability, meaning that the model learns clearer decision boundaries. These structural improvements corroborate the quantitative accuracy gains reported earlier, confirming the effectiveness of augmentation in improving the robustness and generalization of the CNN model.
Experiment 8: Overall Performance Comparison Among Various Models
To provide a holistic benchmarking perspective, the study conducted a comprehensive comparison involving both classical machine learning models and recent deep-learning architectures. Table 10 summarizes key performance indicators—including accuracy, precision, recall, F1-score, AUC, and computational cost—for 10 representative models. This integrated evaluation enables a clearer understanding of how the proposed CNN-based framework performs relative to traditional statistical models, tree-based ensemble methods, and modern neural architectures such as BERT and Vision Transformer.
Performance Comparison of Various Models.

As shown in Table 10, the proposed model achieves the most balanced and superior overall performance across most evaluation metrics. It records the highest accuracy (0.88), F1-score (0.87), and AUC (0.92), outperforming both traditional machine learning models and more complex neural architectures. Classical approaches such as Logistic Regression, SVM, and Decision Tree deliver moderate results, while ensemble-based Random Forest improves performance but still falls short of the proposed model. Among deep-learning baselines, ANN, BERT, and ViT exhibit competitive accuracy and F1 scores; however, they either require significantly longer training time or show less stable recall performance.
The computational metrics further highlight these differences. Tree-based models and K-NN demonstrate shorter inference times but suffer from limited predictive effectiveness. BERT and ViT achieve strong representation capabilities yet incur considerably higher training costs. In contrast, the proposed model maintains an effective balance, offering high predictive performance with acceptable training and inference durations.
Overall, the comparative evaluation indicates that the proposed model provides the most advantageous trade-off between accuracy, robustness, and computational efficiency. Its superior performance across multiple metrics underscores its suitability for modeling the complex, multimodal structure inherent in mental health assessment tasks.
Experiment 9: Impact of Loss Function Selection on CNN Performance
To examine how the choice of loss function affects the optimization process and final predictive performance of the CNN, the study conducted a comparative evaluation using three commonly adopted loss functions: Mean Squared Error (MSE), Cross-Entropy, and Hinge loss. Figure 9 illustrates the resulting accuracy trends for each configuration, enabling direct assessment of how different loss formulations influence the model’s ability to learn discriminative features from mental health data.
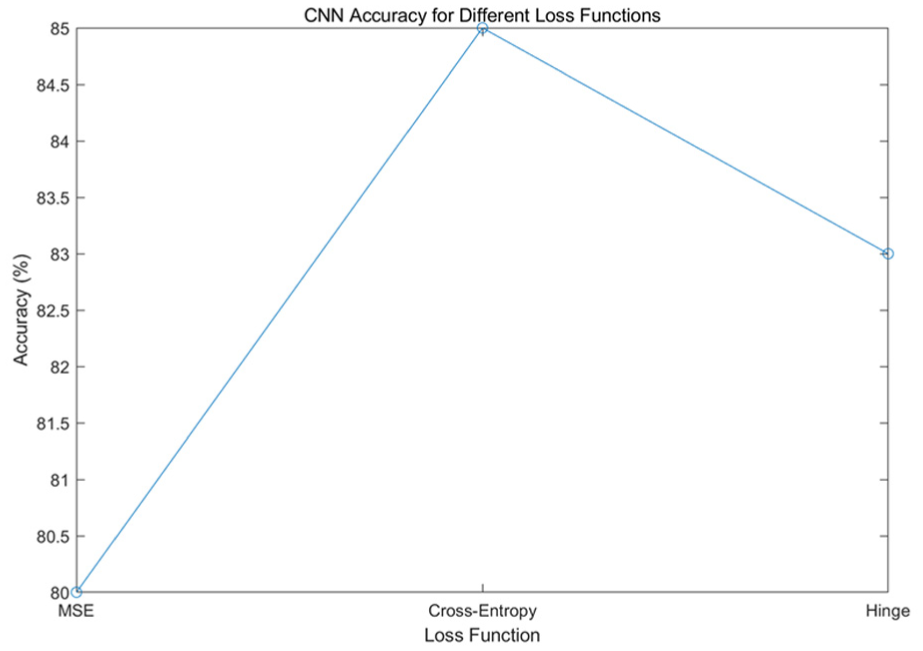
Accuracy trends of CNN models using different loss functions.
As shown in Figure 9, the CNN exhibits substantially different performance outcomes depending on the selected loss function. Cross-Entropy achieves the highest accuracy, reaching approximately 85%, indicating that its probabilistic formulation better aligns with multi-class classification objectives and facilitates more effective gradient optimization. The Hinge loss performs moderately, yielding accuracy around 83%, reflecting its margin-based nature that provides partial but less comprehensive optimization signals for deep networks.
In contrast, the MSE loss results in the lowest accuracy, approximately 80%, suggesting that treating classification as a regression problem leads to weaker gradient dynamics and reduced capacity to separate feature boundaries. These observations demonstrate that appropriate loss function selection is critical to maximizing CNN performance, with Cross-Entropy providing the most stable and discriminative learning behavior for the mental health classification task examined in this study.
To complement the loss function comparison in Experiment 9, the influence of L2 regularization strength on the CNN’s optimization behavior is further examined. A range of L2 coefficients was tested (λ = 0.0001, 0.001, 0.01), and their effects on training loss, validation loss, and validation accuracy were compared under the same training configuration used in Experiment 9. The results are shown in Table 11.
Influence of L2 Regularization Strength on CNN Performance.

As shown in Table 11, a moderate L2 coefficient (λ = 0.001) achieves the best balance between convergence and generalization.
Smaller regularization strength (λ = 0.0001) provides weaker parameter constraints and leads to slightly higher validation loss, while an excessively large value (λ = 0.01) limits model capacity and causes performance degradation.
Experiment 10: Cross-Dataset Evaluation on Multiple Colleges
To further evaluate the generalization ability of the proposed CNN model across heterogeneous data sources, a cross-dataset analysis was conducted using four independently collected college datasets. These datasets differ in student demographics, activity patterns, and recording environments, providing a representative testbed for examining domain shift effects.
Figure 10 presents the accuracy distribution of the CNN model on each dataset, where the mean accuracy and its corresponding standard deviation reflect the model’s predictive stability and sensitivity to dataset variability.

Accuracy distribution of the CNN model across college datasets.
As illustrated in Figure 10, the CNN model achieves consistently high accuracy across all four datasets, demonstrating strong cross-domain robustness. College C exhibits the highest mean accuracy (88%) with the smallest standard deviation, indicating more homogeneous data characteristics and stable feature extraction performance. College A and College D both show comparable accuracy levels (86% and 85%, respectively), though College D presents a noticeably larger variance, suggesting greater intra-dataset diversity or the presence of irregular behavior patterns. College B yields the lowest mean accuracy (82%) and relatively high variability, implying that this dataset may contain more complex or noisier samples, challenging the model’s generalization capability.
Overall, the dot-plot distribution reveals that although performance varies slightly due to dataset-specific factors, the CNN maintains reliable accuracy across all domains. This consistency highlights the model’s ability to adapt to heterogeneous environments and reinforces its applicability to real-world educational behavior analysis scenarios.
Discussion
However, we recognize that reporting a high accuracy figure alone is insufficient without a deeper reflection on potential biases and dataset characteristics. First, the dataset—though extensive in size—was collected from a single institution and largely based on self-reported scales, which may contain recall or reporting bias. The output categories (anxiety, depression, stress, and normal) were defined according to validated cutoff scores from GAD-7, PHQ-9, and PSS to ensure clinical validity. Nonetheless, the dataset was moderately imbalanced, with the “normal” category being the majority. To avoid inflated performance, we employed class-weighted loss functions and balanced sampling, ensuring that minority classes such as depression were not overshadowed in the training process.
The CNN’s superior performance is attributable not merely to preprocessing but to its ability to extract cross-domain hierarchical features. Unlike traditional classifiers that treat features independently, CNN kernels captured meaningful correlations—for example, the combined effect of poor sleep quality, high academic stress, and low social support in predicting anxiety risk. This explains the significant improvement in both recall and F1 score, not just overall accuracy.
Visualization techniques further bridged the gap between the model’s “black-box” nature and practical usability. Heatmaps revealed which feature combinations most influenced predictions, allowing clinicians to validate whether the model’s reasoning aligned with professional judgment. Clustering analysis also revealed latent subgroups (e.g., high-anxiety/low-support students) that could inform more targeted interventions. These insights extend beyond what raw questionnaire scores alone can provide, underscoring the added value of deep learning approaches.
In comparison with existing literature, our findings confirm and extend prior research. For instance, P. Li and Liang (2022) demonstrated the applicability of conventional CNNs for psychological health assessment, but their approach lacked hierarchical feature extraction and interpretability, whereas our multi-level CNN introduces skip connections and visualization-based explanations that yield more clinically actionable insights. Similarly, Velu and Muthuswamy (2024) combined hierarchical CNN-LSTM models with meta-heuristic optimization for depression prediction, highlighting the potential of advanced neural architectures; our study advances this perspective by emphasizing multimodal integration of behavioral, academic, and psychological data. In another line of work, Sarno and Ghozali (2024) applied multi-class multi-level classification on social media text, showing the value of unstructured textual data, while our results suggest that structured cross-domain fusion mitigates the robustness issues of single-source approaches. Recent reviews, such as Liu and Wang (2024), further emphasize the importance of multi-source information fusion in intelligent healthcare, while X. Zhao et al. (2023) demonstrated that evidence theory–based multimodal fusion can significantly improve mental health prediction accuracy. Finally, J. Zhao et al. (2025) designed a PDNN-based framework for predicting students’ mental health and psychological intervention, which complements our focus on interpretability and visualization for decision support. Collectively, these comparisons demonstrate that our approach not only validates but also extends the state of the art in mental health prediction research.
Despite these contributions, limitations remain. The dataset was collected from a single university, which restricts generalizability across different populations. The reliance on self-reported data introduces the risk of reporting bias, and the absence of longitudinal tracking limits the model’s ability to capture temporal dynamics of mental health.
Finally, to move beyond the limitations of this preliminary study, we propose a forward-looking roadmap:
(1) Multi-institutional data expansion with privacy protection: Future research should adopt a federated learning framework, enabling cross-university training without centralized data sharing, thereby ensuring both privacy and generalizability.
(2) Integration of longitudinal data: Collecting semester-based records, daily mood logs, and wearable sensor data would allow CNN-based and hybrid CNN–RNN/Transformer models to capture dynamic changes in mental health.
(3) Advancing interpretability: Beyond generic attention mechanisms, explainable AI (XAI) tools such as SHAP and Layer-wise Relevance Propagation will help quantify the contribution of multimodal features to predictions, making the results more transparent and clinically actionable.
(4) Toward deployment: Practical implementation could take the form of real-time monitoring dashboards integrated with campus counseling systems, providing professionals with actionable, individualized insights to support early intervention.
In summary, this work not only demonstrates the feasibility of CNN-based multimodal mental health assessment but also lays out a concrete strategy to address current limitations and extend toward real-world impact. By expanding data sources, incorporating temporal dynamics, enhancing interpretability, and focusing on ethical, privacy-preserving deployment, future research can establish CNN-based systems as foundational tools in mental health monitoring and intervention.
Conclusion
This study presents a multi-level CNN model for analyzing and predicting college students’ mental health statuses, including anxiety, depression, and stress. By integrating multimodal data—ranging from standardized self-assessment scales (GAD-7, PHQ-9, PSS) to behavioral and academic indicators—the model achieved a high overall accuracy of 95.6%. Compared with traditional machine learning methods, the CNN demonstrated clear advantages in handling complex, nonlinear, and cross-domain interactions. In addition, the use of visualization tools such as heatmaps and accuracy curves enhanced interpretability, making the model more transparent and clinically meaningful.
The results demonstrate that multi-level CNNs provide a reliable and effective method for assessing mental health in educational settings, offering potential for early warning and personalized intervention strategies. However, the dataset’s reliance on a single university, its dependence on self-reported measures, and the absence of longitudinal data highlight the need for more comprehensive future research.
Footnotes
Ethical Considerations
This study was reviewed and approved by the Academic Health Science Ethics Committee of Anhui Sanlian University (Approval No.: AHSLU-EC-2024-051975).
Consent to Participate
Written consent was obtained from parents or legal guardians for participants under 16 years of age. Participants were fully informed of their rights and a sample consent form was available upon request.
Author Contributions
Xianwei Huang: Conceptualization, Methodology, Writing—Original Draft, Visualization. Wei Jiang: Conceptualization, Writing—Review & Editing, Validation, Supervision, Funding Acquisition.
Funding
The authors disclosed receipt of the following financial support for the research, authorship, and/or publication of this article: This work was supported by Anhui Provincial Higher Education Scientific Research Project (Philosophy and Social Sciences): Research on the application of artificial intelligence technology in the mental health survey of college students (Project No.2022AH051975).
Declaration of Conflicting Interests
The authors declared no potential conflicts of interest with respect to the research, authorship, and/or publication of this article.
Data Availability Statement
AI Assistance Declaration
This work was not conducted with the assistance of any AI-assisted applications. All analyses, writing, and results are solely the outcome of the authors’ contributions.