
Abstract
The intensive cultivation of agricultural land impacts crop production efficiency. In this study, the technical efficiency of rice production (TERP) in Jiangsu Province was measured by constructing an output-oriented DEA–BCC model on the basis of multiobjective moderate-scale farmland operation using the China Land Economic Survey (CLES) data from Nanjing Agricultural University spanning 2020 to 2022. We then use a panel Tobit model and fixed effect panel model to analyze the impact of the scale of contiguous plots (SCP) on the TERP, rice land productivity (RLP), labor productivity (LP) and cost–profit ratio (CPR). The results show that the primary term in the SCP had a positive and statistically significant effect on the TERP, RLP, and LP at significance levels of 5%, 1%, and 10%, respectively. Moreover, the quadratic term in the logarithm of the SCP had a negative effect on these three metrics, with statistically significant effects observed at the 10%, 1%, and 5% levels, respectively. Although a similar inverted U-shaped relationship is noted between the SCP and the CPR, it lacks statistical significance. This finding indicates that the relationship between the SCP and agricultural production efficiency for rice farmers has evolved or is evolving into an inverted U-shaped pattern. Contiguous plots that are either too large or too small are detrimental to enhancing production efficiency. Finally, by employing threshold modeling techniques, the results indicate that the SCP threshold of approximately 0.49 hectares is optimal for improving the TERP, RLP, and LP. Moving forwards, adopting a strategy of moderate-scale agricultural operations is essential for China to achieve agricultural modernization and ensure national food security.
Keywords
Introduction
To transform China into an “agricultural powerhouse,” it is imperative to increase agricultural productivity and strengthen the capacity for sustainable agricultural development (Lu et al., 2020). According to World Bank’s 2023 statistics, the added value of agricultural products in China reached $1,311.31 billion in 2022, surpassing Italy, Japan, France, and Australia by factors of 32.97, 33.78, 26.60, and 29.01 times, respectively (World Bank, 2023). This positions China as the leading country globally in terms of agricultural output (Fareed et al., 2024). However, China’s agricultural productivity accounts for only 6.4% of that of the United States (Yang et al., 2024), and the per capita grain output in China was projected to be only 486 kg in 2022, representing merely 27.80% and 27.38% of that in developed countries such as the United States and Argentina, respectively (Hao et al., 2024). The findings of related studies indicate that the fragmentation of cultivated land has a detrimental effect on the efficiency of food production (Cai et al., 2021; Z. Ding et al., 2024; Gedefaw et al., 2019). According to the Ministry of Agriculture and Rural Affairs, as of the end of 2020, the average contracted farmland area per household in China was approximately 0.45 hectares, while the number of plots per household reached a high value of 5.5. Currently, there are still over 200 million rural households with arable land measuring less than 0.67 hectares, whereas only 11.53 million rural households possess contracted arable land exceeding 2.00 hectares. The issue of scattered agricultural land resources poses an urgent challenge in the pursuit of China’s socialist modernization power.
The release of the No. 1 Central Document in 2023 promoted the nationwide implementation of the “small plots merging into a large plot” policy, establishing it as a key focus for rectifying agricultural rural land. It is worth noting that the formulation of this policy is grounded in the practical experience of continuous agricultural land operation in certain regions. In 2016, villagers in Huaiyuan County, Anhui Province, voluntarily negotiated to consolidate and integrate their land holdings, establishing a farming model of “one household, one field,” which also initiated China’s pilot program for the “small plots merged into a large plot” policy. In 2019, Tinghu District, Yancheng City, Jiangsu Province, launched a pilot reform to transform small fragmented fields into larger contiguous plots. By consolidating and transferring land management rights, scattered cultivated land was replaced, resulting in either one field per household or consolidated fields for multiple households. By 2023, the cultivated land in Tinghu District, totaling 24,167 hectares, had been consolidated from 197,500 individual plots to 40,800 plots. This consolidation resulted in the addition of over 2,800 hectares of high-yield land and a significant improvement in land use efficiency (T. S. Liu et al., 2023). Moreover, through consolidation and contiguous planting, Jinhu County of Jiangsu Province has transformed a total area of 94.33 hectares of cultivated land in the village into more than 100 large plots ranging from 0.53 to 1.33 hectares, integrating over 600 small plots. This approach has resulted in remarkable achievements, including a water savings rate of 55%, a fertilizer savings rate of 30%, a labor savings rate of 80%, and complete mechanization. The implementation of the “small plots merged into a large plot” reform has been proven to be viable on the basis of empirical evidence from various locations and has achieved concentrated, contiguous, and high-quality land utilization. However, does a larger scale of contiguous plots (SCP) lead to higher crop production efficiency? How does the SCP affect the efficiency of crop production? These are urgent questions to be studied regarding whether there is a moderate scale of operation of agricultural land.
The relationship between the land management scale and efficiency has consistently been a focal point of academic discourse and an inescapable practical challenge for economic development in various countries. To date, three primary perspectives have emerged. The first perspective posits an inverse relationship between the scale of farmland operation and production efficiency (Luo, 2022; Otsuka et al., 2016; Rada & Fuglie, 2019; Q. Xu et al., 2011). Sen’s (1962) empirical study on India revealed that while the expansion of the farm scale led to increased total factor productivity, unit land output decreased, a phenomenon later termed the inverse relationship (IR) in agricultural development. Carter (1984) subsequently analyzed Indian agricultural data and reported that doubling the land scale resulted in a 40% decrease in output per hectare. Adamopoulos and Restuccia (2020) used cross-country data modeling to argue that unequal land distribution in developing countries hinders overall productivity growth. W. Chen et al. (2023) reported that small-scale farmers in China achieved higher land productivity through labor-intensive farming practices, albeit with lower mechanization efficiency. The second perspective posits a positive correlation between agricultural production scale and efficiency (He, 2016; J. Y. Wang et al., 2015). Deininger et al. (2017) noted that large-scale farms in Brazil increased total factor productivity (TFP) through mechanization and supply chain integration. Lowder et al. (2021) reported that capital increases contribute to higher efficiency in large-scale U.S. farms. Finally, the third perspective is that the relationship between agricultural production scale and efficiency is not unidirectional but contingent on external factors such as environmental conditions, economic development levels, and policy frameworks (Deininger et al., 2017; Y. Liu et al., 2019). For example, Jayne et al. (2022) demonstrated that, compared with larger farms, farms with sizes of 0.5 to 2 hectares had 30% higher outputs per unit area. Additionally, Zhang and Wan (2022) highlighted that complete land contiguity was less effective in enhancing land productivity for large-scale farms than was moderate land contiguity.
In the context of the existing literature, this study makes the following contributions. First, it introduces the concept of the SCP, which refines the broad notion of “moderate-scale agricultural management” to include precise “land management at a moderate scale.” This enhances the accuracy and scientific rigor of our research findings. Second, in this study, we incorporate the quadratic term of the SCP to investigate the potential nonlinear relationships between the SCP and rice planting efficiency. Additionally, a multi-index measurement method is employed to comprehensively evaluate the impact of continuous plot size on production efficiency. Building on existing research (G. C. Li et al., 2010), we adopt a multiobjective approach by simultaneously considering the TERP, RLP, LP, and CPR as measurement indicators, aiming to identify an optimal continuous plot scale. Finally, in previous studies (X. W. Chen, 2014; Shi & Lang, 2013), researchers have primarily assessed agricultural production efficiency using aggregate indicators such as total output value or total grain yield, without specific investigations into particular crops in specific regions.
The objectives of this study were to investigate the relationship between the scale of land management and agricultural production efficiency and to determine whether a threshold effect exists between these two factors. Specifically, utilizing data from the China Land Economic Survey (CLES) conducted by Nanjing Agricultural University in Jiangsu Province from 2020 to 2022, we focused on contiguous rice cultivation as the research subject. A DEA–BCC model was employed to evaluate the technical efficiency of rice production (TERP). Additionally, a comprehensive evaluation index system was developed that integrates rice land productivity (RLP), labor productivity (LP) and the cost–profit ratio (CPR) to determine an optimal operational scale for contiguous land parcels. In this paper, we constructed a panel Tobit model to analyze the impact of the SCP on the TERP. Furthermore, a panel fixed effects model was utilized to examine the influence of the SCP on RLP, LP and the CPR. Finally, a threshold model was constructed to identify threshold effects on rice planting efficiency resulting from changes in the SCP. The remainder of this study is structured as follows: Section 2 outlines the theoretical framework and research hypotheses. Section 3 describes the study area and constructs the DEA-BCC and econometric models. Section 4 presents the analysis of rice planting efficiency and econometric regression results. Section 5 offers conclusions and policy recommendations.
Theoretical Framework and Hypotheses
Effect of the SCP on the TERP
The TERP is defined as the capacity to achieve maximum output from agricultural production given a specific level of resource inputs and technology or to minimize resource consumption for a predetermined output target. It quantifies the discrepancy between actual production levels and the optimal production frontier (Haag et al., 1992). The aim of rational decision-making by farmers is to maximize profits, and large-scale farmland management can achieve economies of scale, thereby reducing costs. Large-scale continuous planting facilitates the application of machinery such as transplanters, harvesters, and UAVs, which can replace manual labor and reduce labor expenses. Additionally, the cost of land leveling and water conservancy facilities can be distributed over a larger area, lowering fixed unit costs. Furthermore, lower prices can be secured for seeds, fertilizers, and pesticides through bulk purchases (Guo & Ding, 2016). However, if the scale of the land exceeds its technical and managerial capabilities, issues such as inefficient scheduling of machinery and excessive fertilization can lead to resource waste and increased costs. Therefore, to achieve economies of scale, contiguous land areas must be expanded, and infrastructure and an effective farmer training system must be established to enhance farmer operational and managerial skills. Without these conditions, simply increasing the size of contiguous plots may not lead to the realization of economies of scale. Consequently, as the SCP expands, agricultural technical efficiency may initially increase but may eventually decrease. Consequently, we propose the following hypothesis.
Effect of the SCP on the RLP
RLP refers to the quantity of products obtained per unit area. In the initial stage, when contiguous plots are relatively small, farmers often have surplus labor resources. The allocation of this excess labor to agricultural activities can result in the optimization of land resource utilization and enhance land productivity (Lambin, 2012). Under these conditions, expanding the scale of operations can yield economies of scale, in which increasing scale leads to reduced unit costs and improved production efficiency. However, beyond a certain threshold, further expansion may introduce several challenges. First, management complexity increases as farm households need to oversee larger tracts of land and more labor, potentially exceeding farmer managerial capacity and leading to diminished management efficiency. Second, resource underutilization becomes an issue; excessively large scales may prevent farmers from fully utilizing all available land, resulting in unused land or inefficient land use and a decline in overall land productivity. Finally, according to the law of diminishing marginal returns, once the input of a production factor (such as land) reaches a certain level, its marginal product—the additional output generated by each incremental unit of input—begins to decrease (Zheng et al., 2024). The inverted U-shaped relationship between contiguous land parcel size and land productivity clearly results from the combined effects of economies of scale and the law of diminishing marginal returns (Barrett et al., 2010). Consequently, we propose the following hypothesis.
Effect of the SCP on LP
LP is influenced by the proficiency of labor, the level of scientific and technological development, and the scale of means of production. When the SCP is relatively small, expanding the scale can generate economies of scale through the sharing of fixed costs (e.g., agricultural machinery and tools and irrigation facilities) and the optimization of factor inputs (e.g., division of labor and adoption of technology). Medium-scale farms are more likely to employ appropriate technologies (e.g., medium-scale agricultural machinery and precision agriculture technology) to ensure optimal technology–scale matches. Farms that are small may face technological issues, whereas those that are too large may encounter technological complexity, both of which lead to low efficiency (Adamopoulos & Restuccia, 2014). At a moderate scale, capital inputs can effectively replace labor and enhance efficiency. However, if the scale becomes excessively large, capital input may exceed actual demand, resulting in underutilized resources and misallocation. Additionally, large-scale hiring of labor results in higher supervision costs and may lead to inefficiencies such as reduced output per unit of labor due to “sloppiness.” Therefore, we propose the following hypothesis.
Effect of the SCP on the CPR
The CPR refers to the proportion of profit relative to cost. As the SCP expands, fixed costs are distributed over a larger volume of production, thereby reducing unit costs. Upon reaching an expanded scale, farmers can decrease labor costs per unit area by replacing manual labor with mechanization, such as by employing large-scale agricultural machinery. Additionally, a specialized division of labor, the centralized procurement of agricultural inputs and standardized planting practices can enhance the efficiency of resource utilization (Schultz, 1964). However, at the inflection point, diminishing marginal returns and diseconomies of scale start to become evident. When the operational scale surpasses the capacity of household labor or management, it becomes necessary to employ external labor or implement hierarchical management structures. This leads to increased supervision costs (e.g., to prevent shirking of duties), coordination costs (e.g., scheduling tasks across multiple plots), and agency costs (e.g., addressing information asymmetry). If the level of mechanization or technical capabilities is not adequately synchronized, machinery might be underutilized or excess labor might exist, leading to resource inefficiency. As the area of contiguously farmed land expands to a critical threshold, the marginal output from additional land may fall below the rental or purchase cost of the land. Moreover, ultralarge-scale operations necessitate substantial investments in maintenance, thereby compressing profit margins (Figure 1). Consequently, we propose the following hypothesis.

Theoretical framework for the interaction between the SCP and agricultural production efficiency.
Methodology and Data
Study Area
Situated at the heart of China’s coastal region, along the lower reaches of the Yangtze River and Huaihe River, Jiangsu Province stands at the convergence of the Silk Road Economic Belt and the 21st Century Maritime Silk Road. Jiangsu Province boasts one of the highest levels of economic development in China, consistently ranking second in GDP nationwide. Jiangsu Province, renowned for its significant agricultural production advantages, is a major agricultural province in China. Rice cultivation has a long and storied history in Jiangsu Province, with archeological evidence revealing that rice field remnants date back over 8,000 years, marking it as the earliest known site of rice cultivation globally (G. M. Ding et al., 2023). Figure 2 illustrates the status of rice planting in Jiangsu Province from 2010 to 2022. During this period, the unit area yield of rice in Jiangsu Province generally exhibited an increasing trend, albeit with minor declines in 2014, 2016, and 2020. Similarly, the total output of rice showed an overall upward trajectory. These trends indicate a steady improvement in the level of rice production in Jiangsu Province.
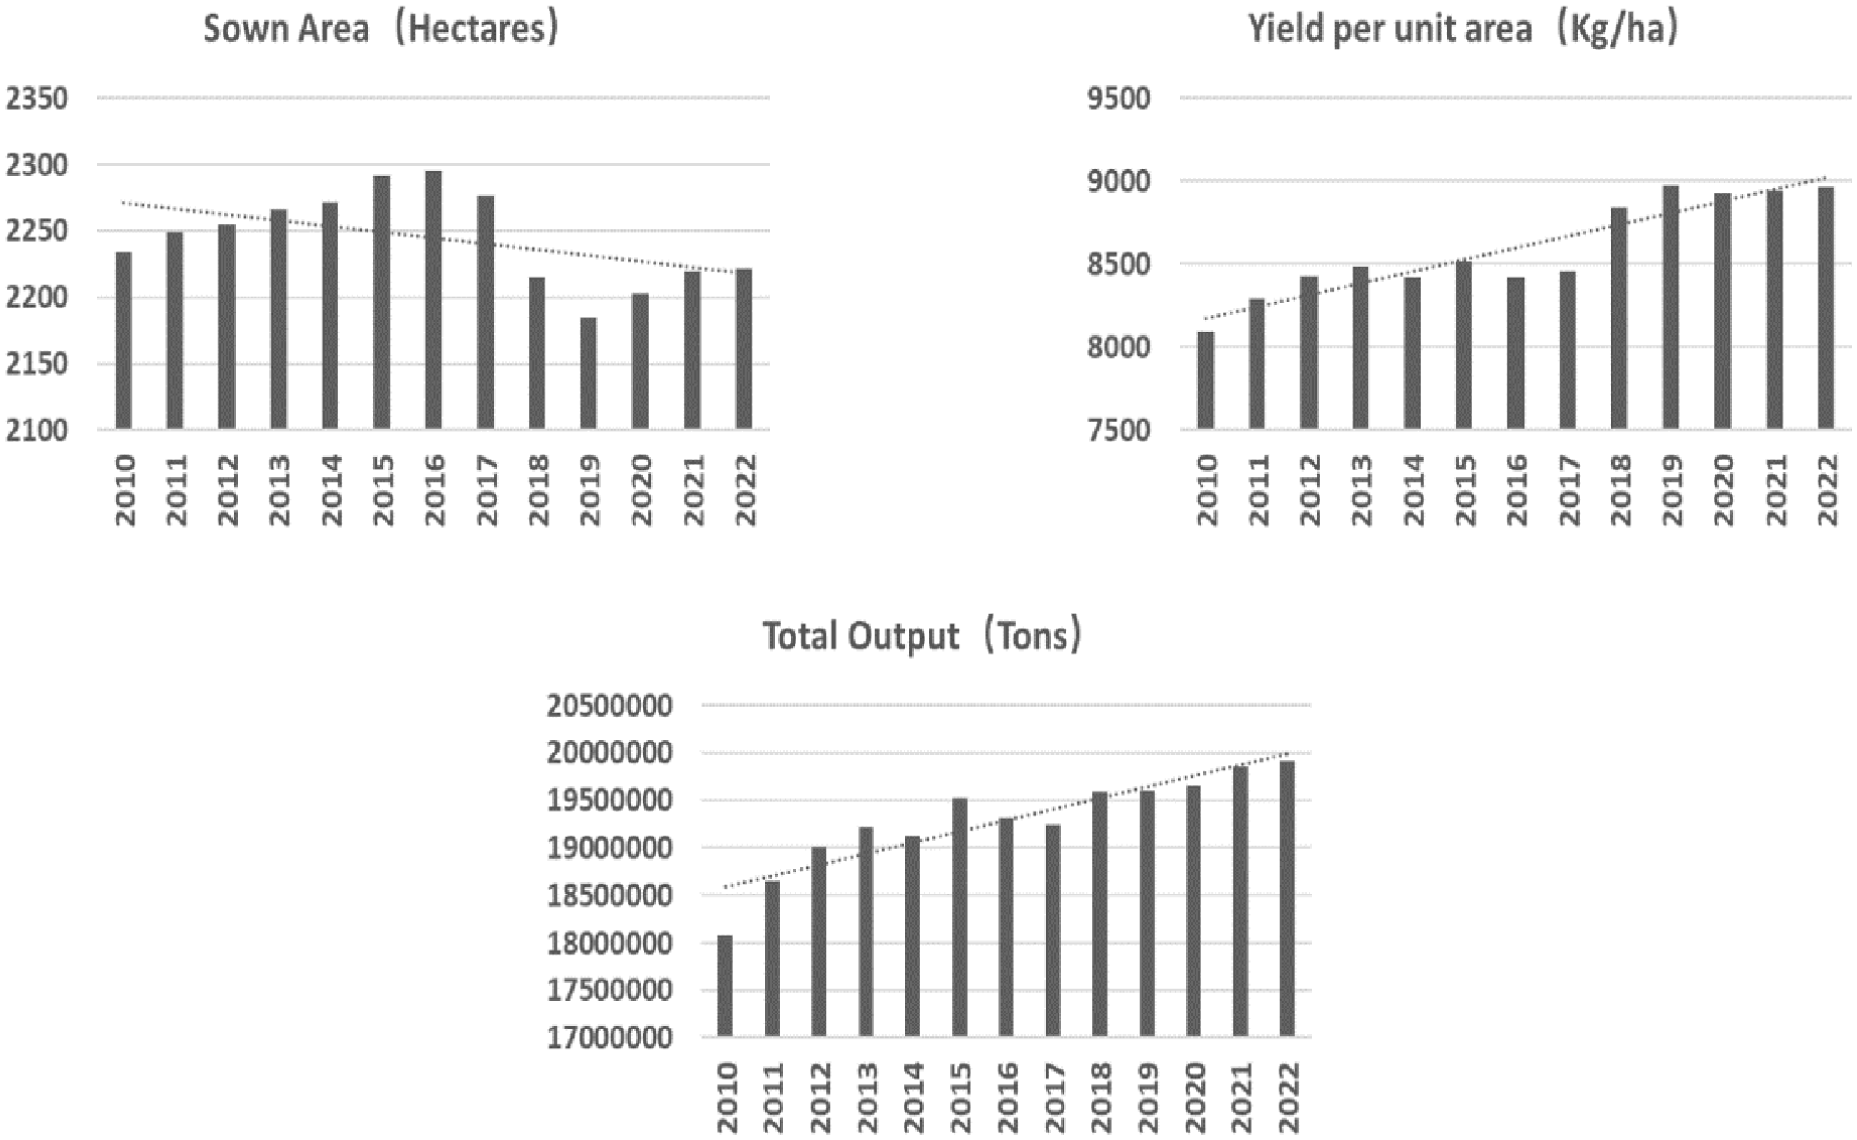
Changes in rice planting area and yield in Jiangsu Province from 2010 to 2022.
Compared with other regions, Jiangsu Province has clear advantages in terms of rice cultivation due to several key factors. First, Jiangsu Province has consistently ranked among the top three provinces in China in terms of rice yield for many consecutive years. In 2022, the average yield of rice in Jiangsu Province reached 9,375 kg·ha−1, which was significantly greater than the national average of 7,110 kg·ha−1. Compared with Heilongjiang, with a yield of approximately 7,800 kg·ha−1; Hunan, with a yield of approximately 6,300 kg·ha−1; and Jiangxi, with a yield of approximately 6,750 kg·ha−1, Jiangsu Province is notably superior in terms of rice yield. Second, this dual cropping system is used in more than 90% of the rice fields in Jiangsu, where rice is harvested in autumn and wheat is harvested in summer, resulting in a high land multiple cropping index. This rice–wheat rotation system not only ensures food security but also maximizes economic benefits, distinguishing Jiangsu from Hunan and Jiangxi, where mainly double-cropped rice is grown, and Heilongjiang, where mostly single-cropped japonica rice is grown each year. Third, Jiangsu boasts a high level of mechanization and advanced application of science and technology in rice cultivation. The comprehensive mechanization rate for rice planting and harvesting in this region reached 93% in 2022, including an 80% rate for mechanized rice transplanting, surpassing the Chinese average of 80% and the 65% average in southern China’s indica rice regions. The province leads in lateral deep fertilization coverage at 35%, UAV plant protection coverage exceeds 60%, and intelligent irrigation systems are implemented across more than 333,300 hectares. Notably, institutions such as Nanjing Agricultural University and the Jiangsu Academy of Agricultural Sciences contribute significantly, with rice varieties bred at these institutions accounting for more than 30% of the Chinese japonica rice varieties (X. Wang et al., 2024).
In Jiangsu Province, the aim was to establish a total of 33,333 hectares of high-standard farmland by 2025, which are characterized by drought and flood protection as well as consistently high yields. Since 2019, various regions, including Tinghu District in Yancheng, Taixing city, Xinglou town in Pizhou city, and Gaozhu town in Jianhu County, have successfully implemented the “small plot merging into a large plot” initiative. This has facilitated pilot projects across multiple areas within the province, providing a critical foundation for this study.
Data Description
The data utilized in this study are derived from data of the CLES, which was conducted by Nanjing Agricultural University. The scope of sampling encompasses the regions surveyed by Professor Buck, a renowned agricultural economist from Nanjing Agricultural University, ensuring that the data remained both representative and comprehensive (F. J. Du et al., 2023). Initiated in 2020 by the Humanities and Social Sciences Department of Nanjing Agricultural University, with support from the Jinshanbao Agricultural Modernization Development Research Institute. The baseline survey was completed in 2020 and encompasses 13 prefecture-level cities in Jiangsu Province, including two counties per city and two villages per county, totaling 52 administrative villages and 2,600 rural households. The survey focuses on various aspects, such as the land market, agricultural production, rural industries, the environment, poverty alleviation, and rural finance. This survey employed the probability proportional to size (PPS) sampling method. The procedure was as follows: First, two counties or districts were selected from each prefecture-level city using unequal probability sampling, based on the proportion of rural population in each county or district relative to the total rural population of the respective city. Second, within each selected county or district, two townships were chosen through unequal probability sampling according to the distribution of administrative villages. Third, one administrative village was randomly selected from each township, yielding a total of 52 administrative villages included in the study. Finally, 50 households were selected from each surveyed village using simple random sampling to form the final sample.
In 2021, the China Land Economic Survey Project conducted a follow-up survey. Given the impact of the COVID-19 epidemic, prior to initiating fieldwork, the project team communicated with local government departments and village committees to understand and adhere to local epidemic prevention and control policies. This ensured that the research activities were compliant with the relevant regulations. The project sought support from local authorities, including the provision of necessary epidemic prevention materials and the coordination of personnel, to facilitate the smooth progress of the research. During the survey, tools such as video conferencing, online discussions, and electronic questionnaires were utilized to minimize face-to-face contact when data were collected from farmers. Additionally, the survey content was refined to ensure that the questions were concise and easily comprehensible to the respondents. Ultimately, the project completed the tracking survey in 13 prefecture-level cities, achieving an average tracking rate of 63.8%. For cases where farmers could not be tracked, supplementary samples were drawn from other farmers within the same village to maintain a consistent sample size. In 2022, despite the challenges posed by the epidemic, our research team successfully conducted surveys in 24 villages across 12 counties within 6 prefecture-level cities. A total of 1,203 farmer questionnaires were collected, including 24 village-level surveys, with a follow-up rate of 56.4%. For farmers who could not be reached, we supplemented the sample with an equivalent number of other farmers from the same village to maintain a consistent overall sample size.
In this study, we employ a balanced panel dataset comprising continuously tracked farmer data from 2020 to 2022 for analysis. Specifically, the farmer questionnaire consists of 11 sections, covering essential information, income details, land usage, plot specifications, household production and operational status, rural industries, and other relevant aspects. It comprehensively encompasses all the indicators required for this study. In accordance with the research objective of examining the impact of the SCP on production technical efficiency, land productivity, LP, and the CPR among rice growers, the survey data selected for analysis include the following.
To obtain the specific values of the core explanatory variable, namely, plot size, and the explained variables, including agricultural production technical efficiency, land productivity, LP, and the cost–profit rate, data from the “plot information” section were selected. The largest plot area at the end of the previous year was chosen as a representative sample to demonstrate the contiguous scale of agricultural plots for that year. In this section, various input indicators, such as irrigation cost, agricultural film cost, seed dose and price, self-input labor days, employee labor days, mechanical operation service cost and self-owned machinery operation cost, are considered. Additionally, output indicators were utilized to calculate production efficiency values and determine profitability rates by considering crop unit prices from other households within their respective household production and operational situations. To further investigate the impact of the SCP on production efficiency in this study’s regression analysis model, several control variables are incorporated. These variables are selected from three key sections of survey results: “family member composition,”“land use,” and “farmer household production and operation.”
To ensure the precision and integrity of the data and facilitate the research reported in this paper, the following steps were taken. First, data screening and integration processes were conducted. On the basis of the research focus on rice crops, survey data were utilized to identify and integrate relevant indicators pertaining to rice growers’ contracted ground information from 2020 to 2022. Additionally, to acquire control variable data for agricultural mechanization, an analysis of outsourcing service utilization and usage of one’s own machinery during the production process was performed, indicating the level of mechanization among rice growers. Second, data cleaning was conducted on the basis of data integration. To ensure data accuracy and maintain consistency in sample size across the 3 years, blank values and abnormal values were processed, resulting in a total of 402 valid farmer data points obtained for each year.
Model and Indicator Description
DEA-BCC Model
At present, the primary methods for measuring agricultural production efficiency include stochastic frontier analysis (SFA), which relies on parametric estimation, and data envelopment analysis (DEA), which employs nonparametric estimation. Unlike SFA, DEA not only evaluates the relationship between all input and output factors to measure true technical efficiency but also does not require preestablished assumptions regarding the relationship between input and output indicators. This eliminates the need to specify the form of the production function or the distribution of error terms, thereby significantly reducing the impact of subjective factors on the results (Locaitienė & Čižiūnienė, 2025). Moreover, this method can elucidate inefficiencies within decision-making units (DMUs) and identify specific improvement targets for various input factors, making it extensively utilized in management science and economics (X. Du et al., 2022).
Rice production involves a variety of inputs and outputs. The inputs consist of seeds, fertilizers, pesticides, labor, machinery and equipment, and irrigation expenses, among others. The outputs extend beyond yield to encompass the quality and variety of rice. The DEA model estimates the efficiency value of multiple inputs in a nonpredefined production function and calculates the output-to-input ratio for each DMU. It is a model based on linear programing and distance functions, encompassing the CCR, BBC, SBM, and other models (Charnes et al., 1978; Cooper et al., 1999). The BCC model incorporates the assumption of variable returns to scale (VRS), indicating that production units can function at varying scales, with returns potentially increasing, remaining constant, or decreasing. In rice production, returns to scale are frequently variable; for instance, small-scale farmers and large agricultural enterprises may exhibit markedly different levels of resource use efficiency. Consequently, this VRS assumption in the BCC model aligns more closely with the realities of agricultural production. In this study, the output-oriented DEA-BCC model is employed to evaluate the TERP. The specific formula is presented as follows:

Where j represents the farmer, n represents the total number of farmers, xi (i =1…, m) denotes the input factors, and yr (r = 1…, q) signifies the output factors. The combination coefficient of the evaluated unit is denoted as, representing an optimal solution with a value ranging between 0 and 1. When the value approaches 1, it indicates maximum efficiency attainment; moreover, higher values imply greater relative efficiency.
The TERP was chosen as one of the dependent variables. Given that input factors such as land resources, water resources, labor, and capital in the production process constitute an interrelated and interactive organic whole, this study adopts unit area data as input–output indicators, drawing on the research of G. F. Li et al. (2019) and Huang et al. (2014). Specifically, the land input per unit area is treated as a fixed input in the model, whereas irrigation water use and other inputs are considered variable input factors. The output indicator is defined as the average yield per mu of rice, whereas the input indicators encompass the land per unit area, labor, irrigation water, seeds, pesticides, plastic film, chemical fertilizer, and agricultural machinery. Table 1 shows the descriptive statistics of the input–output indicators from 2020 to 2022.
Descriptive Statistical Analysis of the Input–output Indicators of Rice From 2020 to 2022.

Econometric Model
Panel Tobit Model and Panel Fixed Effects Model
The Tobit model is a statistical method used to address dependent variables that are truncated by limited plotters. Given that the first explanatory variable examined in this paper pertains to the TERP within the range of 0 to 1, employing classical OLS estimation would introduce parameter estimation bias. Consequently, we opt for the panel Tobit regression model on the basis of maximum likelihood estimation (MLE). For the regression model analyzing the impact of the SCP on RLP, LP, and the CPR, we employ the panel fixed effect model. The specific function is as follows:

Among them, RPE represents the dependent variables (TERP, RLP, LP and CPR), SCP denotes the scale of contiguous plots, and (lnSCP)2 signifies the expansion in plot size, while all other explanatory variables serve as control variables. DAM indicates the degree of agricultural mechanization, AGE represents the age of the household head, EDU reflects their educational level, NAL accounts for the number of households engaged in agricultural labor, TLA measures the total cultivated land area owned by a family, ST characterizes the soil type on a given plot, PF indicates plot fertility and PI indicates whether irrigation is possible, ε refers to the error term, and β represents an estimated parameter.
Threshold Model
This model investigates the nonlinear relationship between variables and can be conceptualized as a piecewise function, where the threshold value serves as the critical point for transitioning between different categories or stages. At distinct stages, the relationships between variables may exhibit varying slopes or forms. Hansen (1999) pioneered the econometric analysis of panel threshold models. This method identifies the threshold value by minimizing the sum of squared residuals and subsequently tests the significance of this threshold. The significance test for the threshold regression model aims to determine whether the estimated parameters differ significantly between the two sample groups delineated by the threshold. Consequently, the null hypothesis posits that there is no threshold effect, implying that the coefficients are identical across the two groups. To evaluate this hypothesis, Hansen introduced a “bootstrap” method to derive an empirical distribution, from which the corresponding probability p value, known as the bootstrap p value, is calculated to assess the significance of the threshold effect. The specific settings are as follows:
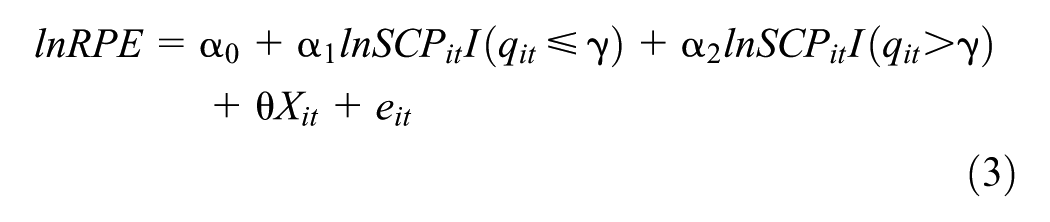
The above model assumes only one threshold. In the case of two or three thresholds, the single threshold model can be slightly expanded as follows:

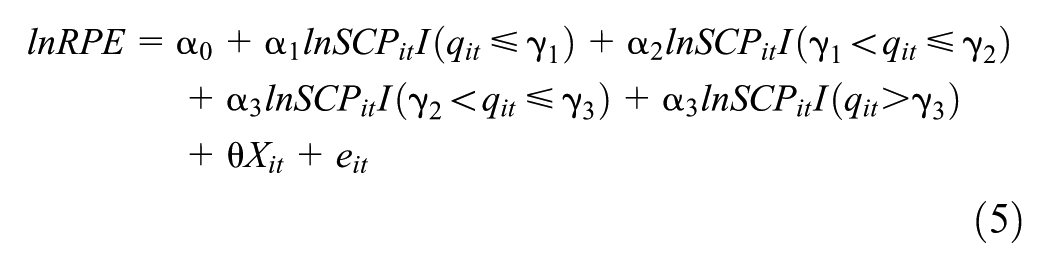
where RPE represents the four explained variables in this paper, SCP represents the scale of contiguous plots, Xit refers to all control variables (excluding the SCP, which is the core explanatory variable), θ denotes the coefficient of each control variable, e refers to the error term, and α represents an estimated parameter.
Variable Description
In accordance with pertinent research findings (Frija et al., 2009; Putri et al., 2024; Wei & Lu, 2024), this study selects supply chain performance (SCP) as the primary explanatory variable. Additionally, eight control variables are chosen on the basis of farmers’ demographic and social characteristics, production management capabilities, and farming conditions. Table 2 provides detailed definitions and abbreviations of the relevant indicators, whereas Table 3 presents the statistical descriptions of these indicators.
Variables and Their Meanings.

Descriptive Statistical Analysis of the Variables.

Results
Results for Rice Production Efficiency
The MaxDEA software was used to measure the TERP. Moreover, these three indicators were measured according to the concepts of land productivity, LP and the CPR, and the results are shown in Table 4 and Figure 3.
Comparative Analysis of the Efficiency Results for Rice Planting From 2020 to 2022.

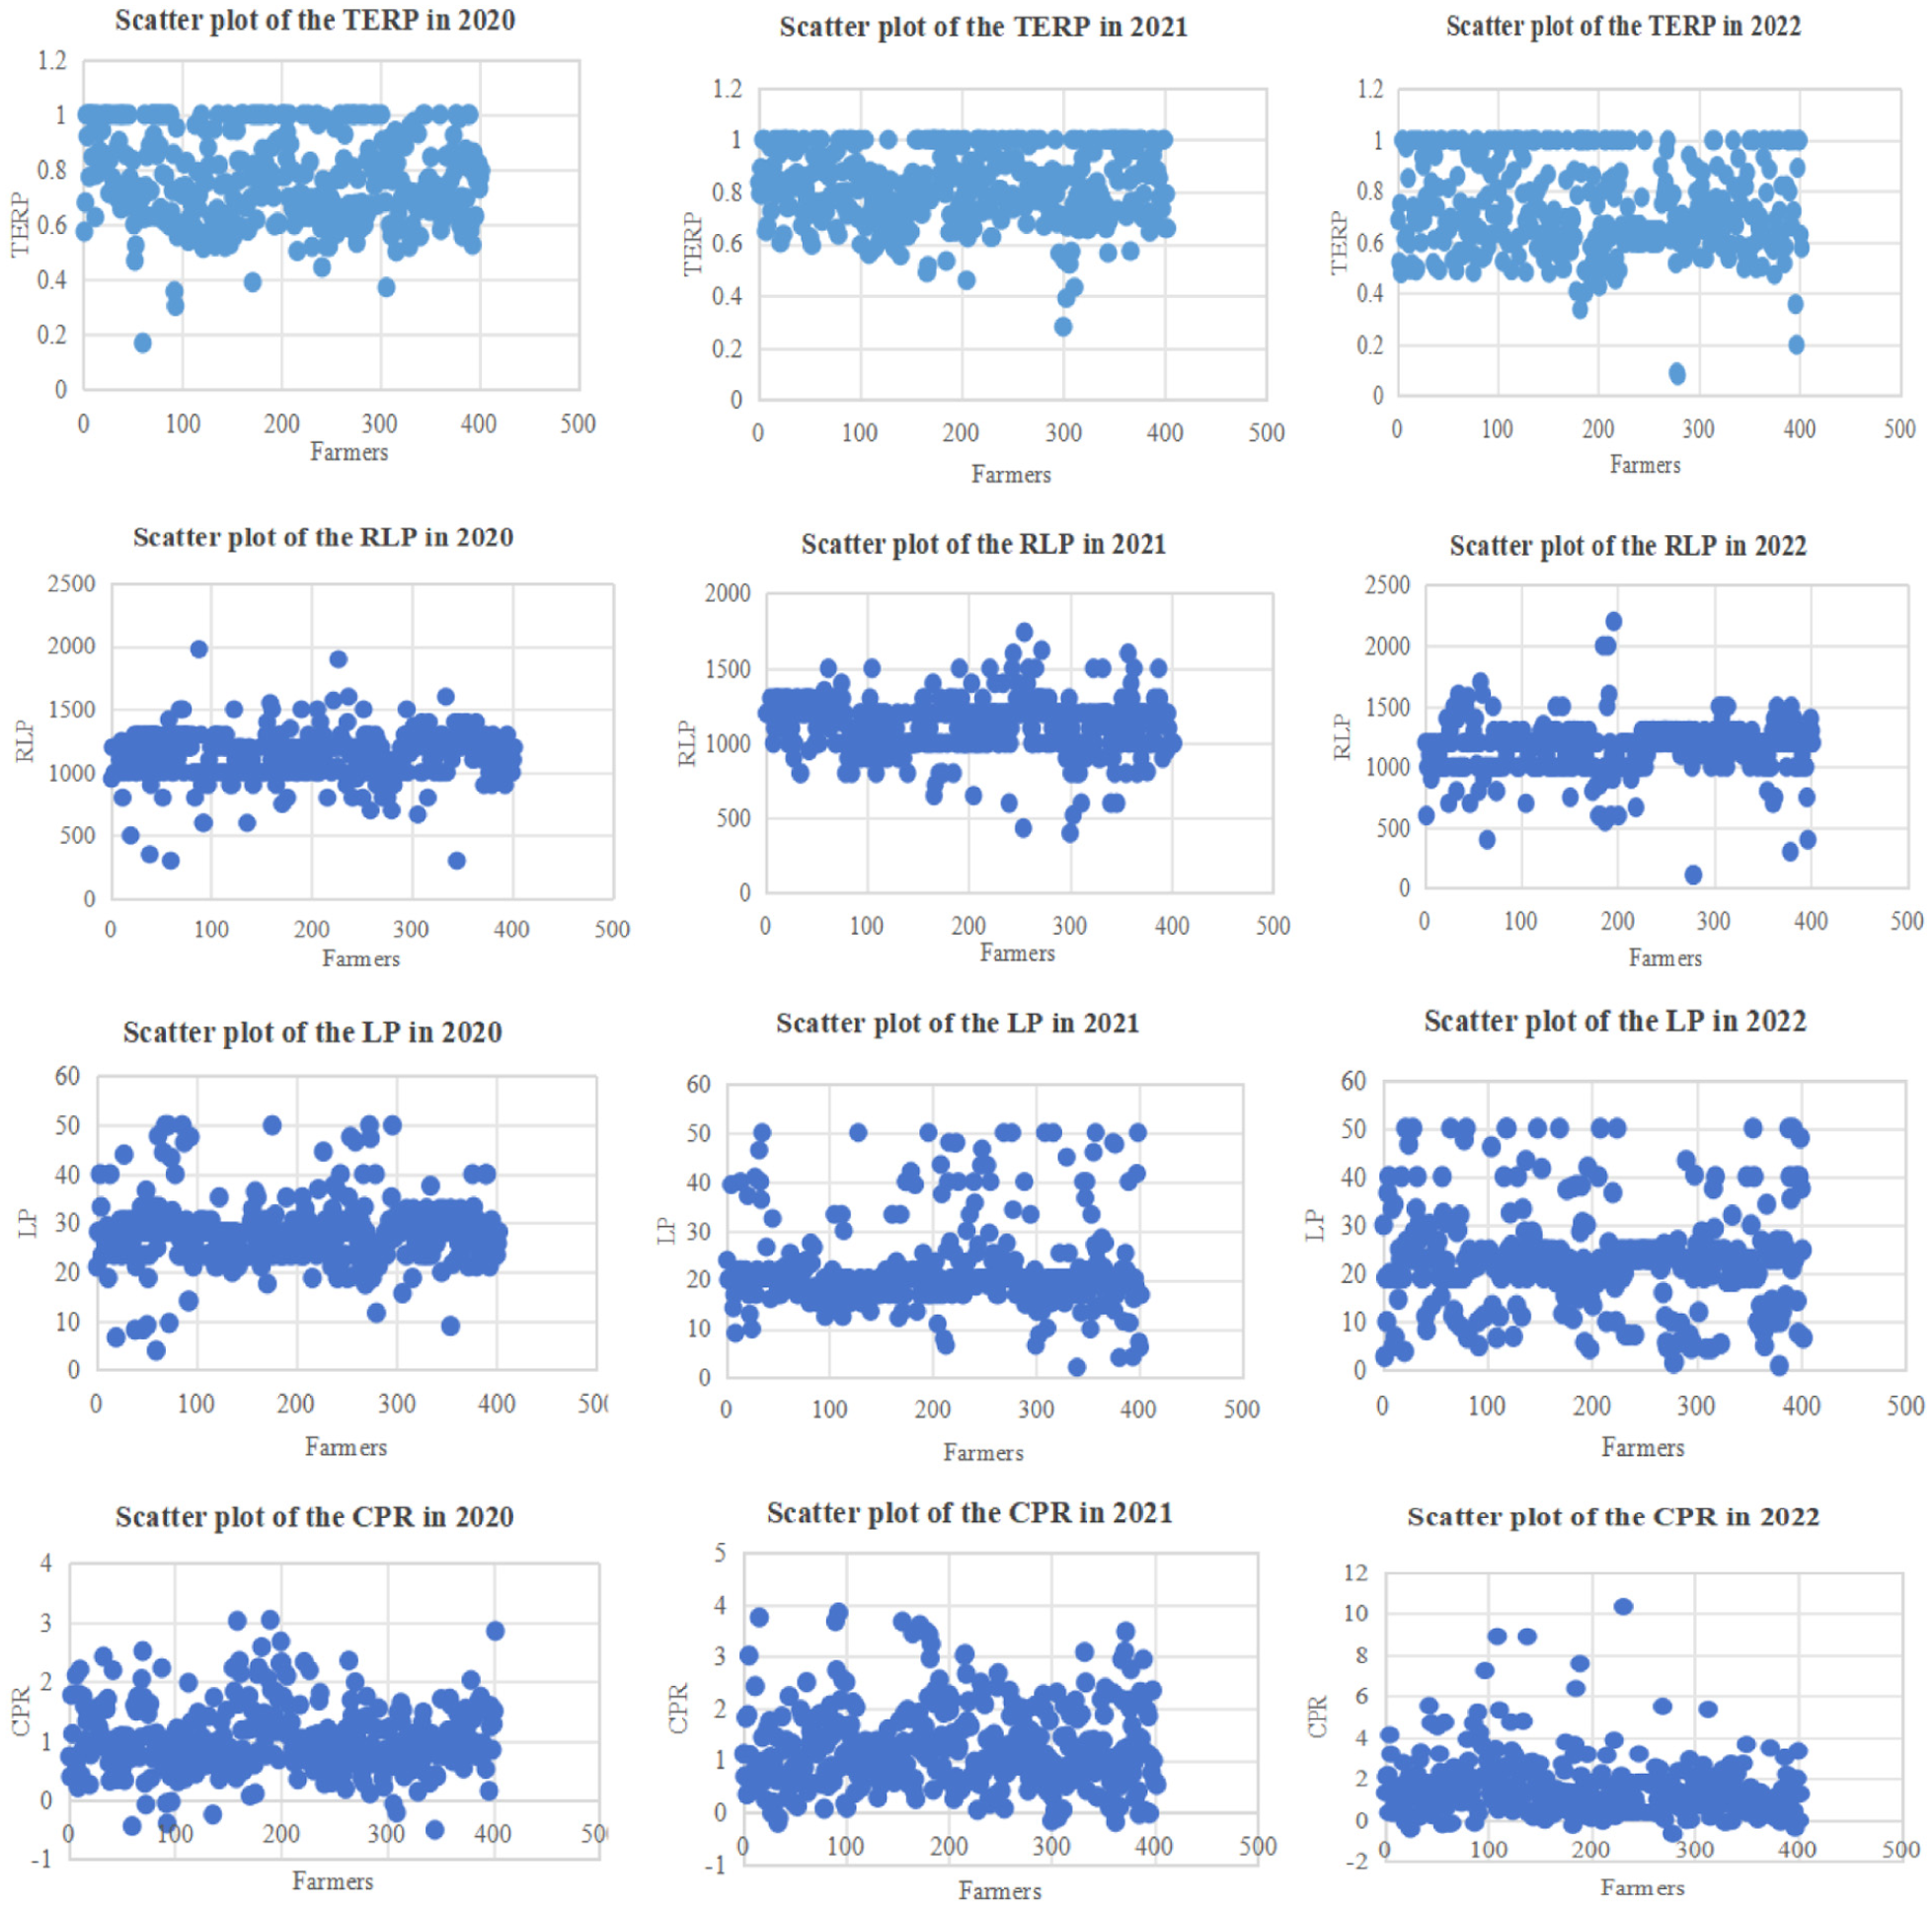
Scatter plot of the TERP, RLP, LP, and CPR from 2020 to 2022.
The average TERP value decreased from 0.76 in 2020 to 0.72 in 2022, exhibiting a trend of an initial increase, followed by a decrease. The coefficient of variation initially decreased but then increased over this period. The scatter plot revealed that in 2020 and 2021, more than 85% of the farmers had TERP values between 0.6 and 0.8. However, in 2022, there was a significant increase in the number of farmers with TERP values between 0.4 and 0.6, indicating a widening disparity in production technical efficiency among rice farmers. This divergence may be attributed to the initial success of the farmland rectification policy implemented in 2022, which led to varied production behaviors among farmers. Small-scale farmers largely maintained their traditional levels of production and operation, whereas those who expanded their planting areas adopted mechanization and modern management practices. For farmers whose scale of operations expanded, the utilization of large machinery and reduced costs of labor and other input factors due to land leveling have significantly altered their production decisions compared with those of small farmers, resulting in a slight downwards trend in the TERP values. Importantly, this decrease in TERP values is likely temporary. As the land leveling policy continues to be promoted, farmer production and management levels are expected to steadily increase, narrowing the gap between farmers and leading to a greater overall TERP.
The results show that the mean value of RLP increased from 1,130.77 in 2020 to 1,149.22 in 2022, exhibiting an initial decline followed by a subsequent increase. The coefficient of variation demonstrated a slight upward trend, reaching 18.84% in 2022. Nevertheless, the distribution pattern of RLP values in the scatter plot remained relatively stable, with most of the farmer RLP values falling between 1,000 and 1,500. In addition to natural factors, a primary driver of the increase in land productivity was changes in farmer management practices resulting from adjustments in the SCP.
Between 2020 and 2022, LP exhibited a pronounced downwards trend, decreasing from 27.71 to 22.82. Specifically, in 2021, the average LP for farmers decreased by 5.7%. The scatter plot clearly illustrates this shift in LP. Compared with 2020, there was a significant increase in the number of farmers with low LP levels in both 2021 and 2022, and the disparity in LP among farmers widened during this period. This phenomenon could be attributed to large-scale farming operations, for which additional labor was needed during peak farming seasons. However, owing to their limited managerial capabilities, farmers are unable to effectively oversee the efficiency of hired workers, leading to increased labor costs and reduced LP. Additionally, issues related to mechanization and labor allocation inefficiencies can result in redundant labor inputs, further reducing LP.
From the CPR results and scatter diagram, we determined that the CPR increased from 1.02 in 2020 to 1.53 in 2022. The scatter plot provides a clear visualization of this trend. Specifically, in 2020, the CPR for farmers primarily ranged between 0 and 3, whereas by 2022, the CPR for some farmers had significantly increased to between 3 and 4, or even higher. According to the data analysis, the primary factor contributing to this increase was the expansion in contiguous plots, which reduced the unit cost of rice production. Farmers can now purchase seeds, fertilizers, pesticides, and other production materials in bulk, thereby reducing input costs. Additionally, the use of machinery instead of manual labor has further decreased labor costs.
Econometric Regression Analysis Findings
The multicollinearity between variables was first tested using Stata 15.0, with the results indicating variance inflation factors of less than 2, which indicated that there was no multicollinearity. The stepwise regression method was subsequently employed to obtain the regression results presented in Tables 5 to 8. The model’s Prob > chi2 = .0000, which suggests a significant and well-fit regression equation.
Regression Results of the SCP on the TERP.

Note. Standard errors in parentheses, *p < .1, **p < .05, ***p < .01.
Regression Results of the SCP on the RLP.

Note. Standard errors in parentheses, *p < .1, **p < .05, ***p < .01.
Regression Results of the SCP on the LP.

Note. Standard errors in parentheses, *p < .1, **p < .05, ***p < .01.
Regression Results of the SCP on the CPR.

Note. Standard errors in parentheses, *p < .1, **p < .05, ***p < .01.
The results in the table clearly indicate that the primary term in the SCP exerts a positive and statistically significant effect on the TERP, RLP and LP at significance levels of 5%, 1%, and 10%, respectively. Conversely, the quadratic term in the logarithm of the SCP negatively affects the TERP, RLP and LP, with statistical significance observed at levels of 10%, 1%, and 5%, respectively. These findings suggest that a moderate expansion in the SCP can result in significant increases in the TERP, RLP, and LP. However, expansion beyond this optimal range leads to a decline in these measures. Thus, Hypotheses 1, 2, and 3 are supported by the results of this study. Nevertheless, when the impact on the CPR was considered at the land parcel contiguous scale, an inverted U-shaped trend similar to that of the previous variables mentioned above was observed; however, no statistically significant results were obtained from our model. These significant findings demonstrate that contiguous plots that are either too large or too small are detrimental to enhancing production efficiency. Consequently, the optimal rice planting scale we aim to achieve is theoretically sound.
For the regression results of the control variables, first, the results show that the degree of agricultural mechanization negatively affects the technical efficiency and the CPR of rice production, both significantly at the 1% level. The potential reasons for this can be summarized as follows: first, the expansion of the SCP is currently in its nascent stage. Farmers are transitioning from manual labor to mechanized operations, which has led to increased costs associated with agricultural machinery and a reduction in profit margins during the production process. The economies of scale have yet to materialize. Second, the level of mechanization for some farmers does not align with the scale of their plot operations. The heightened mechanization costs can be offset only through moderate expansion of the operational scale. However, it is worth noting that the degree of agricultural mechanization positively impacts RLP at a statistically significant level (1%). This suggests that agricultural mechanization has increased land yield and can substantially improve the RLP.
Second, the educational level of the head of household has a positive and statistically significant influence on both the technology efficiency of rice production and land use efficiency, with significance levels of 10% and 1%, respectively. This implies that increasing farmer education levels significantly enhances the efficiency of rice cultivation. Third, the number of households engaged in agricultural labor positively affects both the technology efficiency of rice production and land productivity, with significance levels of 5% and 1%, respectively. Moreover, soil type has a positive effect on both the technical efficiency and LP of rice production, with statistical significance observed at the 10% level for both variables. Finally, the total cultivated land area owned by households has a positive effect on RLP, which is statistically significant beyond the 10% threshold. Additionally, land fertility has a significant positive effect on RLP at a significance level lower than 1%.
Examination of Endogeneity and Stability
Endogeneity issues may exist due to mutual causality between the scale of contiguous plots and rice production efficiency. Specifically, an increase in the SCP can enhance rice production efficiency, while improved rice production efficiency might, in turn, lead to the expansion of the plot area. To isolate the primary causal factor, following the methodology employed by Guo Jiatang, we utilize lnSCP as the core explanatory variable for regression analysis. The rationale is that the impact of current improvements in rice production efficiency on the lagged lnSCP is negligible. As shown in Table 9, the regression results for the one-period lagged lnSCP and its quadratic term coefficient are consistent with the benchmark regression, thereby supporting the hypothesis that the scale of contiguous plots is the predominant cause of this causal relationship.
Regression Results When the One-Period-Lagged Natural Logarithm of the SCP Is Used as the Primary Explanatory Variable.

Note. Standard errors in parentheses.
p < .1. **p < .05. ***p < .01.
To ensure robustness, the instrumental variable (IV) method was employed for further testing. Specifically, the one-period lagged lnSCP value was used as an instrumental variable for the current period’s lnSCP in the regression analysis, with the results presented in Table 10. The Kleibergen–Paap LM statistic confirmed that the significance test was passed, indicating that the instrumental variable was not underidentified. Additionally, the Kleibergen–Paap Wald F statistic significantly exceeded the critical value at the 15% level, confirming that the instrumental variables were not weak. According to the findings in Tables 10 and 11, the regression coefficients of lnSCP and its quadratic term continued to exhibit an inverted U-shaped relationship with rice production efficiency even after endogeneity concerns were addressed. This suggests that the benchmark regression results remained robust and reliable.
Endogenous Regression Results When the One-Period-Lagged Natural Logarithm of the SCP Is Used as an Instrumental Variable.

Note. *,**,*** Denote significance at the 10%, 5%, and 1% levels, respectively, with robust standard errors in parentheses. The null hypothesis for the Kleibergen–Paap LM test is “H0: Insufficient identification of instrumental variables,” with the corresponding p values reported in parentheses. For the Kleibergen–Paap F test, the null hypothesis is “H0: Weak identification of instrumental variables,” and the critical values at the 15% significance level are provided in curly braces.
Stability Test Results (Variables Winsorized by 5%).

Note. Standard errors in parentheses.
p < .1. ** p < .05. *** p < .01.
Finally, to further examine the robustness of the benchmark regression results, this paper applies a 5% winsorization to all the variables, and the results are presented in Table 11. The stability test reveals that even with a reduced sample size, the regression outcomes remain consistent with the benchmark regression results. This finding indicates that the empirical findings are robust and reliable.
The Findings Demonstrate a Threshold Effect
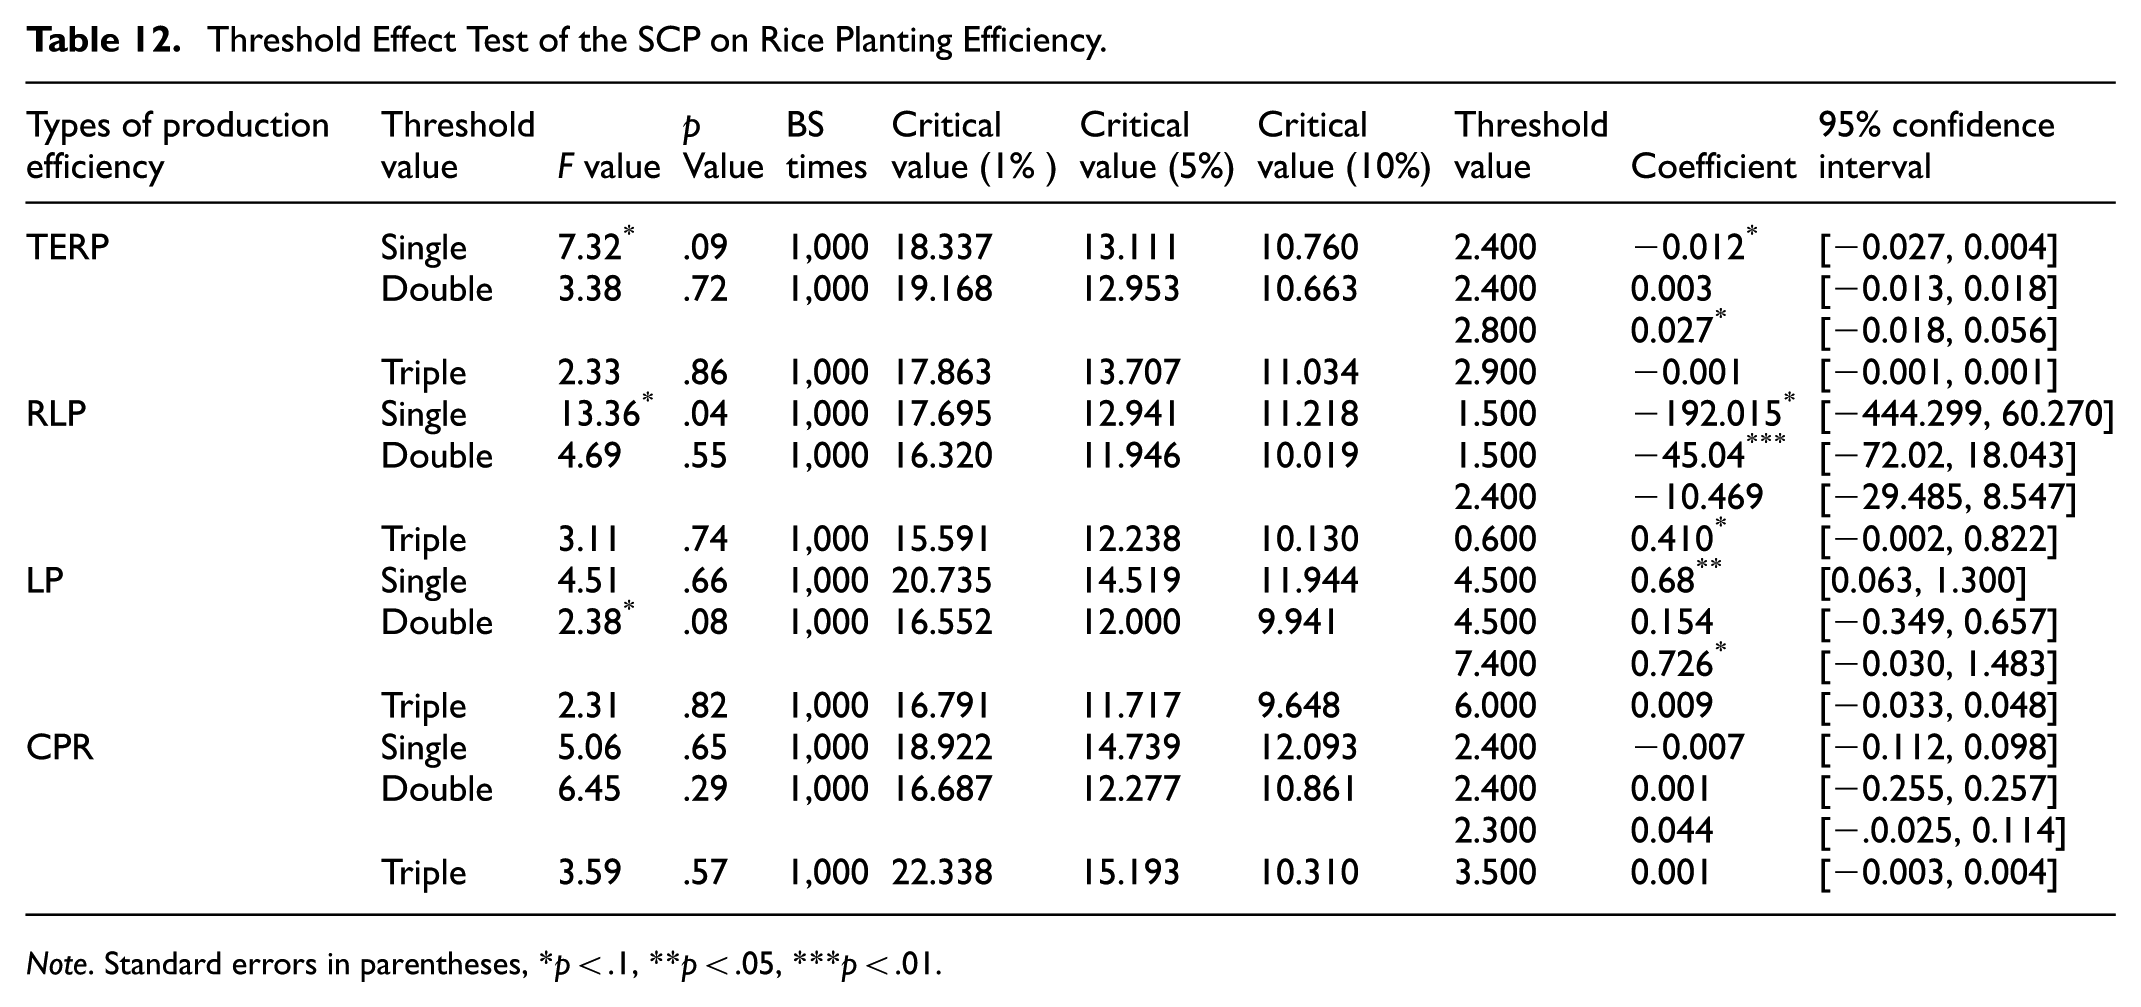
The results of the threshold analysis are presented in Figure 4 and Table 12. The table reveals a single threshold for continuous plot size in relation to TERP and RLP, with significant threshold values of 0.16 hectares and 0.1 hectares, respectively, corresponding to significance levels of 10% and 5%, respectively. Figure 4 shows that TERP and RLP increase only when the plot size exceeds their respective threshold values. Additionally, LP demonstrated a dual-threshold effect on the basis of the SCP, with significant thresholds observed at 0.3 hectares and 0.49 hectares, both at the 10% significance level. Specifically, LP decreases once the plot size exceeds 0.3 hectares but increases when the SCP surpasses 0.49 hectares. However, the threshold effect of the SCP on the CPR was not statistically significant. By comprehensively comparing the threshold effects of the SCP on TERP, RLP and LP, we found that the intersection of their threshold values occurs in areas exceeding 0.49 hectares. Therefore, only at continuous plot sizes exceeding 0.49 hectares can the TERP, RLP, and LP simultaneously increase.

Threshold values and likelihood ratio function estimates of the rice planting efficiency.
Threshold Effect Test of the SCP on Rice Planting Efficiency.
Note. Standard errors in parentheses, *p < .1, **p < .05, ***p < .01.
Conclusions and Policy Recommendations
Conclusions
Compared with previous studies on noncontiguous farmland, this paper presents the following significant findings:
First, the average value of the TERP decreased from 0.76 to 0.72 from 2020 to 2022, exhibiting an initial increase, followed by a decrease. Moreover, there was an expanding disparity in technical efficiency among rice farmers. The average RLP of rice increased from 1,130.77 to 1,149.22, showing an initial decrease, followed by an increase. LP exhibited a similar trend, with an initial decrease from 27.71 to 22.82 and then a further increase thereafter. Additionally, the CPR showed an increasing trend from 1.02 to 1.53.
Second, the regression results indicate that as the SCP expands, there is an inverted U-shaped relationship among the production efficiency indicators (TERP, RLP, LP, and SCP). The primary term of the contiguous land parcel scale has a positive and statistically significant impact on the TERP, RLP, and LP at significance levels of 5%, 1%, and 10%, respectively. Moreover, the quadratic term of the logarithm of the contiguous land parcel scale has a negative effect on these three metrics, with statistical significance observed at the 10%, 1%, and 5% levels, respectively. However, the impact on the CPR due to the contiguous parcel size is not statistically significant. In terms of the regression results of the control variables, the degree of agricultural mechanization has a negative effect on the TERP and the CPR, both of which are significant at the 1% level. Conversely, it positively influences RLP, with statistical significance at the 1% level. Educational attainment has a positive and statistically significant effect on both the TERP and RLP, with significance levels of 10% and 1%, respectively. The number of households engaged in agricultural labor positively affects the TERP and LP, achieving significance at the 5% and 1% levels, respectively. Additionally, the soil type positively impacts the TERP and LP, with statistical significance observed at the 10% level for both variables. Finally, the total cultivated land area and land fertility positively influence on RLP, with significance levels of 10% and 1%, respectively.
Finally, a comprehensive comparison of the threshold effects of the SCP on the TERP, RLP, and LP reveals that the intersection of their threshold values occurs in areas exceeding 0.49 hectares. Therefore, only continuous plot sizes exceeding 0.49 hectares can simultaneously enhance the TERP, RLP, and LP.
Policy Recommendations
Several policy implications can be derived from the main conclusions.
(1) The following factors should be carefully considered when expanding the scale of plot operations. First, it is imperative to reasonably determine the area of land contracted by farmers. Through village self-governance consultations, the will of farmers should be fully respected, and the contracted land area for farmers should be legally determined (Hu et al., 2024). This forms the foundation and key to ensuring continuous plot operations.
Second, the layout of farmland should be optimized. On the basis of farmland rectification experience in Jiangsu Province, dividing the village’s farmland into three categories is recommended: “self-planting area,”“circulation area,” and “combined self-planting and circulation area.” The self-planting area should primarily be located in convenient farming areas, for example, areas that are close to homes, roads, and water sources. It should be allocated to households that still wish to farm following the principle of “one household, one field.” Additionally, annual changes in farmers’ cultivation intentions should be considered, with contracts signed at the beginning of each year to allow for flexible adjustments. In the circulation area, contracted land should be uniformly transferred to rural collectives, which then lease it to enterprises or moderate-scale farmers on the basis of operational requirements, following the standard of “multiple households, one field.” The aim of this approach is to generate new agricultural entities such as family farms and social service providers, promoting intensive land use and cost savings for farmers. The combined self-planting and circulation area serves as a flexible buffer zone to address any shortages or surpluses in contracted land within the self-planting and circulation areas. The village collective coordinates the activities of various new agricultural business entities for cultivation in this area.
Third, the identification of key stakeholders responsible for promoting farmland rectification is crucial. The government must play a pivotal role in coordinating the interests of all parties involved and providing essential financial subsidies, technical guidance, and training to assist farmers in mastering advanced agricultural technologies and management practices. Moreover, rural communities represent a unique blend of social and familial relationships, and the reputation and ability of the village party secretary and captain are directly correlated with the successful execution of farmland rectification initiatives. The government needs to cultivate a cadre of village officials who possess competence, capability, and the courage to assume responsibility.
(2) The appropriate selection of machinery and equipment is essential. Farm machinery should be chosen on the basis of the operational scale of different plots. Specifically, for small-scale operations (<3.33 ha), lightweight, multifunctional, and cost-effective small- and medium-sized agricultural machinery (such as microtillers and small harvesters) should be promoted to minimize purchase and operational costs. For medium-scale operations (3.33–33.33 ha), medium-efficiency agricultural machinery (such as medium-scale tractors and precision planters) should be utilized to increase operational efficiency. For large-scale operations (>33.33 hectares), large and intelligent agricultural machinery (such as unmanned tractors and combine harvesters) should be employed, incorporating Internet of Things technology to achieve comprehensive mechanization. Additionally, the government should provide subsidies to farmers or cooperatives purchasing agricultural machinery, with a focus on supporting small and medium–sized agricultural machinery and intelligent equipment. Innovative financial services, such as agricultural machinery leasing and loans, should also be introduced to alleviate financial pressure on entities operating at a large scale (D. Xu et al., 2020).
(3) To increase soil quality and improve land fertility, measures should be implemented in accordance with crop production requirements. Land improvement initiatives, including irrigation, deep tillage, continuous cultivation, and the planting of green manure, should be undertaken to ensure that the land is suitable for agricultural crop production. Farmers should be encouraged to apply organic fertilizers such as cow dung, alongside chemical fertilizers, and implement reasonable crop rotation and straw mulching techniques to further improve soil fertility.
(4) We should actively encourage highly educated professionals to dedicate themselves to specialized production and operations in agriculture. Numerous high-tech research and development teams should be established to overcome the limitations of agricultural technology and enhance efficiency across all production stages. Additionally, village- or city-level agricultural technology training centers can be established to provide regular training for farmers, thereby improving farmer production and management skills.
The findings of this study not only provide practical guidance to relevant government departments in Jiangsu Province for enhancing the “small plots merged into a large plot” reform initiative, optimizing farmland layout, and flexibly adjusting farmland scales but also offer valuable theoretical and empirical references for the reform and optimization of farmland policies in other regions globally. However, one limitation of this study is its reliance on survey data exclusively from farmers in Jiangsu Province. While Jiangsu Province may be representative to some extent, this restricts our ability to conduct comparative analyses on the relationship between the scale and efficiency of land management across different regions. Furthermore, despite the comprehensive consideration of relevant influencing factors in this study, potential limitations in questionnaire design and reliance on available data may have resulted in omitted variables.
In future research, a more in-depth investigation can be conducted from the following perspectives. First, it is crucial to examine the relationship between land operation scales and agricultural production efficiency for different crops across various regions of China. Research on optimal agricultural operation scales only holds practical significance when specific crops are considered as subjects. The optimal scale varies among different crops and is influenced by regional natural factors as well as advancements in agricultural modernization. Second, the optimal scale of agricultural operations is dynamic, evolving over time due to changing farming conditions and improvements in farmers’ production management capabilities. Third, boundary factors such as water resources and land resources that constrain regional agricultural development should be incorporated into the theoretical and practical framework of multiobjective agricultural land operation scales. This integration will enrich the theoretical foundation of optimal agricultural operation scales and broaden the scope of research.
Footnotes
Acknowledgements
We would like to thank the editors and reviewers for their comments on our paper.
Author Contributions
Guifang Li: Writing—original draft, Writing—review & editing, Methodology. Xinyuan Wang: Writing—original draft, data curation, validation. Dongdong Ma: Writing—review & editing, Methodology, formal analysis. Cuiping Zhao: data curation, validation, and funding.
Funding
The authors disclosed receipt of the following financial support for the research, authorship, and/or publication of this article: The National Social Science Foundation of China (Nos. 23CJY054, 22BJY179, 22BJY193). The National Natural Science Foundation of China (Nos. 72373036, 72003057, 72573050). The Henan University Philosophy and Social Science Innovation Talent Support Program (No. 2025-CXRC-31). The Major Project of Philosophy and Social Sciences Research in Henan Provincial Universities (Nos. 2026-YYZD-17, 2025-YYZD-03). The Research Project on Humanities and Social Sciences Funded by the Henan Provincial Department of Education (No. 2026-ZDJH-615). The Annual Project of Philosophy and Social Sciences Planning of Henan Province (Nos.2024BZH023, 2022CJJ148, 2022CJJ147, 2023BJJ043). The Soft Science Key Project of the Science and Technology Department of Henan Province (Nos. 252400411021, 242102110345, 242400410266). The Post Expert Fund of Henan Modern Agricultural Industry Technical and Economic Evaluation System (No. HARS-22-17-G4). The Humanities and Social Sciences Project of the Ministry of Education (No.19YJA790121). The Research and Practice Project of Teaching Reform in Higher Education of Henan Province (No.2021SJGLX094).
Declaration of Conflicting Interests
The authors declared no potential conflicts of interest with respect to the research, authorship, and/or publication of this article.
Data Availability Statement
The data presented in this study are available on request from the corresponding author.