
Abstract
Vietnam’s rapid economic growth has intensified environmental pressures, particularly from international tourism, foreign direct investment (FDI), and export-oriented production. This study investigates how these sectors collectively influence national CO2 emissions. Using data from 1990 to 2023 sourced from the Vietnam General Statistics Office, and World Bank, this study first applies quantitative analysis to assess the correlations between these drivers and CO2 levels. An advanced Stacked Long Short-Term Memory (LSTM) model, with optimized preprocessing, is then used to forecast emissions from 2024 to 2030. The model achieves high predictive accuracy (RMSE = 0.1201, R2 = .8657) and consistently outperforms traditional methods such as ARIMA, KNN, Naive Bayes, and standard neural networks. Results reveal strong positive links between CO2 emissions and FDI, exports, and tourism, with projections indicating continued growth in emissions, potentially stabilizing after 2027. These findings offer valuable insights for developing policies that balance economic growth with environmental sustainability.
Introduction
Vietnam’s economic growth in recent decades has been among the fastest in Southeast Asia, driven by deepening integration into global markets through trade liberalization, foreign investment, and the expansion of international tourism (Hung et al., 2022; Ngoc & Xuan, 2024; P. T. Nguyen, 2022). This global engagement has generated substantial economic benefits, including job creation, infrastructure development, and technological advancement. However, it has also coincided with rising environmental pressures, most notably an increase in greenhouse gas emissions. In Vietnam, the three pillars include international tourism, foreign direct investment (FDI), and export-oriented manufacturing are the largest contributors to the national economy, but they also generate higher CO2 emissions than other sectors (Gan et al., 2024; Min et al., 2024; Munir et al., 2024; Ngoc & Xuan, 2024).
Over the past decade, Vietnam has transformed into a dynamic export-oriented economy, leveraging competitive labor costs and low utility prices to attract foreign investment and expand manufacturing capacity (P. T. Nguyen, 2022). Export volumes have more than doubled, positioning the country as a critical node in global supply chains (P.T. Nguyen, 2022; Vietnam Indicators, n.d.; DataBank, n.d.). The export portfolio remains heavily concentrated in energy and resource industries, such as telephones, textiles, electronics, footwear, and machinery. Major export markets include the United States, China, Japan, South Korea, and EU markets such as the Netherlands. However, this rapid export growth comes at a considerable environmental cost, particularly through rising CO2 emissions (P. T. Nguyen, 2022; Vietnam Indicators, n.d.; Vietnam Energy Online, n.d.). With exports accounting for more than 90% of GDP, balancing trade competitiveness with environmental sustainability has become a critical policy challenge (World Bank Data, 2025). International tourism is also another central pillar of Vietnam’s economy, generating foreign exchange revenues, creating employment, and stimulating regional development. Over recent decades, the country has emerged as one of Southeast Asia’s most sought-after destinations, welcoming millions of visitors each year (Asia and the pacific, n.d.). Investments in hospitality infrastructure, transportation, and destination marketing have supported this expansion. However, the sector also has a notable environmental footprint, contributing to greenhouse gas emissions through increased transportation, energy use for accommodation, and resource consumption. Consequently, while tourism strengthens Vietnam’s economy, it also poses challenges for climate change mitigation (Hung et al., 2022; Ngoc & Xuan, 2024). Similarly, Foreign Direct Investment (FDI) has also played a pivotal role in Vietnam’s industrialization, job creation, and export growth (Vietnam Indicators, n.d.). While it remains a critical engine of growth, its environmental impacts, particularly CO2 emissions, are increasingly severe (Raihan, 2024a; Xuan, 2025). A large share of FDI flows into manufacturing and processing industries dependent on fossil fuels. Large industrial hubs in northern Vietnam, like Bac Ninh and Bac BacGiang provinces, are an illustration of these instances. These areas host dense clusters of FDI industrial parks producing electronics, textiles, and food products, which are characterized by high energy consumption and substantial emission levels (Hung et al., 2022; Ngoc & Xuan, 2024).
Vietnam’s CO2 emissions are rising rapidly amid strong economic growth. However, along with the development process, the country is also facing environmental problems, including air pollution (G.T.H. Nguyen et al., 2024). In response, a decisive shift toward clean energy and enhanced control and forecasting of emissions (Dung, 2024; T. T. Nguyen et al., 2024) is required. To sustain long-term economic competitiveness and climate commitments, Vietnam must accelerate its green transition, strengthen environmental governance, and embed climate resilience into all levels of economic planning (Dung, 2024).
Forecasting CO2 emissions has become a central topic in recent research, with various studies exploring different predictive factors (Abd El-Aal, 2024; Akther et al., 2024; Begum et al., 2025; Dossou et al., 2025; Hung et al., 2022). Some focus on electricity consumption and gross domestic product (Xuan, 2025; Zhao, 2025; P. Jiang et al., 2019), while others examine population and the increase in tourism (Akther et al., 2024; Ali et al., 2024; Feng, 2024; Liang et al., 2025). Researchers also consider energy-related emissions, such as those from industry and manufacturing (Akther et al., 2024; Raihan, 2024b; Ye et al., 2024). Additional factors include seasonal changes and temperature fluctuations (Sarwar et al., 2024). Number of studies mentioned on FDI or export (Abd El-Aal, 2024; Işık et al., 2024), energy production with coal combustion (P. Jiang et al., 2019), and electricity generation by oil (Bosah et al., 2024). To enhance forecasting accuracy, modern models like deep learning, reinforcement learning, and ARIMA have been applied (Ajala et al., 2025; Alam et al., 2025; Das et al., 2025; V. G. Nguyen et al., 2023; Nie et al., 2025; Ning et al., 2021), highlighting a growing trend toward advanced computational approaches in emissions prediction.
In Vietnam, the three major economic drivers: foreign direct investment (FDI), export activities, and international tourism services together contribute almost 100% of the national GDP (General Statistics Office of Vietnam, n.d.). While previous studies have examined the environmental impacts of each factor separately, there is still a lack of research that systematically investigates their combined effect on CO2 emissions. In particular, no study has explored how the interaction among FDI, export growth, and tourism development collectively contributes to the increase of CO2 emissions in Vietnam (Hung et al., 2022; Ngoc & Xuan, 2024; P. T. Nguyen, 2022; V. G. Nguyen et al., 2023; T. T. Nguyen et al., 2024). With their economic role, it is essential to assess how these sectors contribute to environmental degradation, particularly in terms of CO2 emissions. Therefore, this study seeks to empirically investigate the relationship between these macroeconomic variables and Vietnam’s carbon emissions. Data collected from the World Bank and the Vietnam General Statistics Office from 1990 to 2023 was used for training the model, and then this model will be used for predicting CO2 emissions from 2024 to 2030. The Stacked LSTM model was designed with 90 input neurons, two LSTM layers, three fully connected layers, and an activation layer. To enhance the robustness of the analysis, this study applied a data preprocessing approach that normalized all factor values into the range [0–1] prior to model training. This step not only ensured accuracy and consistency in data scaling but also contributed to improving the model’s stability and predictive performance, thereby strengthening the reliability of the research findings.
The next part of this paper is structured as follows: The Related Studies section presents prior work in carbon emission forecasting; the Methods section will show the Forecasting Model with Stacked LSTM architecture and describe the process of this study; the Results section reports the outcomes and compares them with current machine learning models; the Discussion section provides further analysis; and the Conclusion section summarizes the key findings.
Literature Review
Tourism and CO2
Tourism is often portrayed as a sustainable growth engine in developing countries, such as those in ASEAN, yet mounting evidence highlights its substantial contribution to environmental degradation. While tourism expansion generates foreign exchange earnings, infrastructure, and jobs (Asia and the pacific, n.d.; DataBank, n.d.), it also creates a large carbon footprint through aviation, accommodation, and energy-intensive services (Ali et al., 2024; Dossou et al., 2025; Liu et al., 2025). Prior studies have established a positive relationship between tourism and CO2 emissions in both developed and developing economies (Dossou et al., 2025; Feng, 2024; Raihan, 2024a; Zhao et al., 2024). According to Raihan (2024b), tourism arrivals in Brazil significantly raised emissions in both the short and long term, while Min et al. (2024) showed that even temporary shocks such as the pandemic did not alter the long-term upward trajectory of tourism-related emissions. However, most studies focus narrowly on the direct emissions generated by tourist arrivals and related services, without unpacking the structural linkages between tourism and broader economic systems, such as exports and FDI (L. Jiang & Lv, 2025; Kholil et al., 2025; Oprea et al., 2025). In the case of Vietnam, although tourism has expanded rapidly, very few studies assess its relative contribution compared with FDI and exports (Tran et al., 2025; Xuan, 2025). This perspective is problematic in the context of Vietnam, where tourism, together with FDI and exports, constitutes nearly 100% of the national GDP (General Statistics Office of Vietnam, n.d.). Ignoring these interconnections risks misrepresenting the real scale of tourism’s environmental burden. Moreover, the relationship of tourism compared to FDI and exports has rarely been investigated, showing the understanding of whether tourism is a minor supplementary driver or a significant amplifier of Vietnam’s carbon emissions.
FDI/Export and CO2
Foreign direct investment (FDI) and export-oriented growth are widely acknowledged as key drivers of industrialization in developing economies (Bhat & Ikram, 2025; Kholil et al., 2025). In Vietnam, FDI has accelerated the expansion of manufacturing, electronics, textiles, and food processing industries, most of which are fossil fuel–intensive and carbon-heavy (Ngoc & Xuan, 2024; Raihan, 2024b). Existing studies consistently show a positive link between FDI inflows and CO2 emissions across both low- and high-income countries, often framed under the “pollution haven” hypothesis where industries with high environmental costs relocate to countries with weaker regulatory frameworks (Abd El-Aal, 2024; Xuan et al., 2024). The FDI emission relationship should be examined by sectoral heterogeneity and contextual conditions. Several studies have proven that the effect of FDI on emissions varied significantly across industries, and the renewable energy adoption can reduce carbon intensity in otherwise high-emission sectors (Xuan, 2025; Zhao, 2025). This indicates that FDI is not inherently detrimental to the environment but interacts with national energy strategies, technological capacity, and regulatory enforcement.
For the export sector, studies have shown that Vietnam’s exports are concentrated in energy- and resource-intensive industries (P. T. Nguyen, 2022), embedding high levels of carbon within its trade structure. Together with tourism, FDI, and exports account for nearly the entire national GDP (General Statistics Office of Vietnam, n.d.), analyzing them in isolation underestimates their combined environmental impact and limits the design of comprehensive policy responses. Empirical evidence further suggests that the pursuit of industrialization, largely geared toward export-led growth, has intensified environmental degradation (Abd El-Aal, 2024; P. T. Nguyen, 2022). FDI-driven industrial zones often prioritize rapid production over sustainability (Işık et al., 2024; Xuan et al., 2024), relying heavily on fossil fuels such as oil and coal (P. Jiang et al., 2019; Sakilu & Chen, 2025). When coupled with rapid tourism expansion, the combined effect of FDI and export growth has become a major contributor to CO2 emissions in Southeast Asia (Sakilu & Chen, 2025). This underscores a critical tension: while these sectors sustain economic growth, their unchecked environmental costs risk undermining long-term sustainability. Without policies to encourage cleaner production and green investment, the current development model may lock Vietnam into a high-emission growth path.
Machine Learning Methods for CO2 Forecasting
CO2 emission forecasting has become an area of interest for researchers, policymakers, and environmental organizations due to its critical implications for climate change and sustainable development. Accurate predictions of future CO2 levels are essential for planning effective mitigation strategies and assessing environmental policies (Yang et al., 2024). Conventional statistical techniques like Autoregressive Integrated Moving Average (ARIMA) continue to play an important role in emission forecasting. ARIMA and its variants are widely used due to their strong theoretical foundation and ability to handle time series data efficiently (Jin et al., 2024; Ning et al., 2021; Ostermann et al., 2024). In recent years, advancements in data science have led to the increasing use of machine learning techniques to enhance the accuracy of forecasting models (Ajala et al., 2025; Algwil et al., 2025; Chen et al., 2024; Jin et al., 2024; Kadem et al., 2024). Various studies now focus on applying algorithms such as Support Vector Machines (SVM), K-Nearest Neighbors (KNN), Artificial Neural Networks (ANN), and Deep Learning to model and predict CO2 emissions more effectively (Ajala et al., 2025; Algwil et al., 2025; Kadem et al., 2024). These approaches offer the advantage of capturing complex, nonlinear patterns within large datasets, which traditional models may fail to detect. It also overcomes the shortcomings of traditional econometric models, such as ARIMA or ARDL, which often struggle with nonlinearity and multi-factor dependencies. Feng (2024) applied a fuzzy support vector machine (FSVM) to address issues of instability and low accuracy in prior forecasting models, achieving notable improvements in predicting peak emissions at tourist destinations. Similarly, Liang et al. (2025) advanced a graph neural network framework to capture spatio-temporal correlations in tourism demand, enhancing the accuracy of forecasts for sustainable tourism policy planning. While these models demonstrate superior performance compared to classical approaches, they remain largely sector-specific (e.g., tourism), limiting their applicability in explaining macroeconomic and environmental linkages.
Other studies have applied machine learning more comprehensively. Raihan (2024b), using an ARDL model, found significant short- and long-term contributions of economic growth, energy consumption, and tourism to Brazil’s CO2 emissions. Although insightful, this econometric approach remains linear and does not capture more complex interdependencies. Sakilu and Chen (2025) adopted artificial neural networks across 18 developing countries, incorporating seven economic and energy-related variables. Their model achieved very high predictive accuracy (R2 ≈ .999), but such results raise concerns about overfitting, as the model may lack generalizability across different contexts. Xu et al. (2024) introduced a hybrid Tensor-LSTM-ARIMA model integrating heterogeneous data, including social media information, to improve prediction under uncertainty. This innovative approach illustrates the potential of hybrid deep learning methods to capture nonlinear and dynamic relationships more effectively than single models. Similarly, Algwil and Khalifa (2025) combined the Gaussian Mutation and Shrink Mechanism-based Moth Flame Optimization (GMSMFO) with Extreme Learning Machines, achieving robustness and precision in CO2 forecasting tasks.
Recent studies in Vietnam have increasingly explored the drivers of carbon emissions and the potential of advanced forecasting techniques. V. G. Nguyen et al. (2023) applied a range of machine learning algorithms, including neural networks with different architectures and optimization strategies, and confirmed their predictive power for CO2 emissions and energy assessments. While this demonstrates the promise of machine learning, the emphasis was primarily on algorithmic accuracy rather than on integrating the most critical economic drivers of emissions. Similarly, the application of Artificial Neural Networks (ANN) and Support Vector Machines (SVM) has been shown to improve prediction in various sectors. These models often remain “black boxes,” offering little interpretability for policy makers.
Economic and environmental linkages have also been investigated. P. T. Nguyen (2022) found that the carbon embedded in exports rose substantially between 2006 and 2023. These findings suggest that Vietnam’s global economic integration has deepened its carbon dependency. However, this study examined FDI and exports in isolation, failing to capture their combined and potentially reinforcing effects on emissions. Broader macroeconomic dynamics have been studied by Ngoc and Xuan (2024), who identified significant correlations among CO2 emissions, population growth, migration, FDI, and GDP using data from the World Bank and Vietnam’s General Statistics Office. Although useful in mapping correlations, this line of research still falls short of addressing causality or developing robust forecasting tools that can inform long-term policy.
Taken together, the Vietnamese literature illustrates progress in applying machine learning and econometric approaches but also reveals key limitations: a tendency to prioritize technical accuracy over interpretability, reliance on fragmented analysis of single drivers, and insufficient attention to the combined impact of Vietnam’s dominant economic pillars, including FDI, exports, and tourism, that collectively account for almost the entire GDP. Addressing these gaps is crucial for developing forecasting tools that are both methodologically sound and practically relevant for sustainable policy design.
From these previous studies, several critical gaps remain. Firstly, many Machine learning models emphasize predictive accuracy but offer limited discussion of interpretability or policy relevance, making it difficult to translate results into actionable strategies. Secondly, there is no explanation for the choice of factors, especially for economies like Vietnam, where structural dependence on FDI, exports, and tourism accounts for nearly 100% of GDP. Addressing these gaps requires an approach that not only improves forecasting accuracy but also integrates the most critical economic drivers into a single analytical framework. Third, existing studies did not mention the transformation of input data into a consistent unit to enhance the accuracy of output results.
Building on prior research that has identified multiple drivers of CO2 emissions and explored various forecasting models, this study narrows its focus to three factors: Foreign Direct Investment (FDI), international tourist arrivals, and exports. To capture their combined influence, this study employs a Stacked Long Short-Term Memory (Stacked LSTM) model to forecast Vietnam’s CO2 emissions for the period 2024 to 2030. The dataset is drawn from authoritative sources, including the Vietnam General Statistics Office and the World Bank, ensuring credibility and comparability. Furthermore, to improve the robustness of the model, a normalization technique is applied to harmonize input variables, thereby enhancing accuracy and consistency in the forecasting results.
Methodology
Data and Preprocessing
This study draws on data for Vietnam covering the period 1990 to 2023, compiled from reliable sources including the World Bank and the Vietnam General Statistics Office. The entire 1990 to 2023 series was employed as the training dataset. As summarized in Table 1, the key variables comprise international tourist arrivals, exports, foreign direct investment (FDI), and CO2 emissions. This study integrates all three pillars of Vietnam’s global economic engagement, FDI, exports, and tourism, into a unified forecasting model.
Factor Groups.

Since the variables differ in magnitude and measurement units, all input factors were normalized to relative values within the range [0, 1]. This preprocessing step helps prevent scale dominance, ensuring that no single variable disproportionately influences the model, and allows for a balanced contribution of all factors in the forecasting process. After prediction, the results were rescaled to their original units to obtain the final forecasted values.
The Stacked LSTM Architecture
The Stacked LSTM model in this study is designed with two LSTM layers, two fully connected layers, one activation layer, and one output layer. The Stacked LSTM architecture is particularly effective in capturing long-term temporal dependencies and nonlinear dynamics in time-series data, which are crucial for CO2 emission forecasting. Stacked LSTM provides a deep feature representation with multiple hidden layers, leading to improved accuracy in handling complex macroeconomic interactions. The architecture is described as follows:
LSTM Layer: The model begins with two LSTM layers, which have 90 units in this specific model.
Fully Connected Layers: Following the LSTM layer are three fully connected (dense) layers, each with 90 units. These layers process the information from the LSTM layer and prepare it for the final output.
Activation Layers: ReLU (Rectified Linear Unit) activation functions are applied after each of the fully connected layers. ReLU was used as an activation function in neural networks.
Output Layer: The model concludes with a final fully connected layer containing a single unit. This layer produces the model’s prediction, which is the predicted CO2 (kt) value.
The architecture of this model is applied in Python as
Our Proposed Method
The CO2 emission forecasting model is illustrated in Figure 1. This approach involves five key steps: Step 1: Collect relevant data from reliable sources; Step 2: Process, transform, and interpret the collected data to ensure consistency and accuracy; Step 3: Split the dataset into training and testing subsets; Step 4: Train a deep learning model on the training data and apply it to both datasets to generate predictions; Step 5: Convert the predicted results into final, interpretable outputs.

CO2 emission prediction model.
The 5-step model is described in detail as follows:
Step 1: Data collection from the World Bank Data, including factors such as International tourist arrivals, FDI, exports, and CO2 emissions.
Step 2: The data is cleaned, described, and initially assessed, and the relationships between the variables in the model are measured. Next, the data is uniformly transformed into the range [0, 1] to avoid discrepancies between measurement units, ensuring high accuracy in the training and prediction process. The equivalent predicted values will then be converted back into the final forecasted values. This transformation process is described as follows:
Suppose the table of factor values includes four factors described by the set A:

Where

To convert to uniform values, for each factor column, divide by the maximum value of that column. At this point, the transformed value of each

Step 3: In this step, the data is split into two separate datasets: the training dataset and the prediction dataset. The training dataset includes data from 1990 to 2023, while the prediction dataset consists of data for 2024.
Step 4: Train the deep learning model and apply it to predict CO2 emissions for 2024 and then forecast to 2030. The model’s error is checked, and the RMSE of the model is ensured to be at an acceptable level.
Step 5: Based on the equivalent predicted values, the values are transformed to provide the final CO2 emission prediction. The transformation is done by multiplying by the maximum value of the original CO2 emission column.
Results
Data Description
The dataset used in this study spans the period from 1990 to 2023. Data were primarily obtained from the World Bank. The scope of the dataset focuses on Vietnam’s CO2 emissions, including factors such as FDI, exports, and tourism. These data serve as the input for model training and statistical testing in the subsequent methodology section.
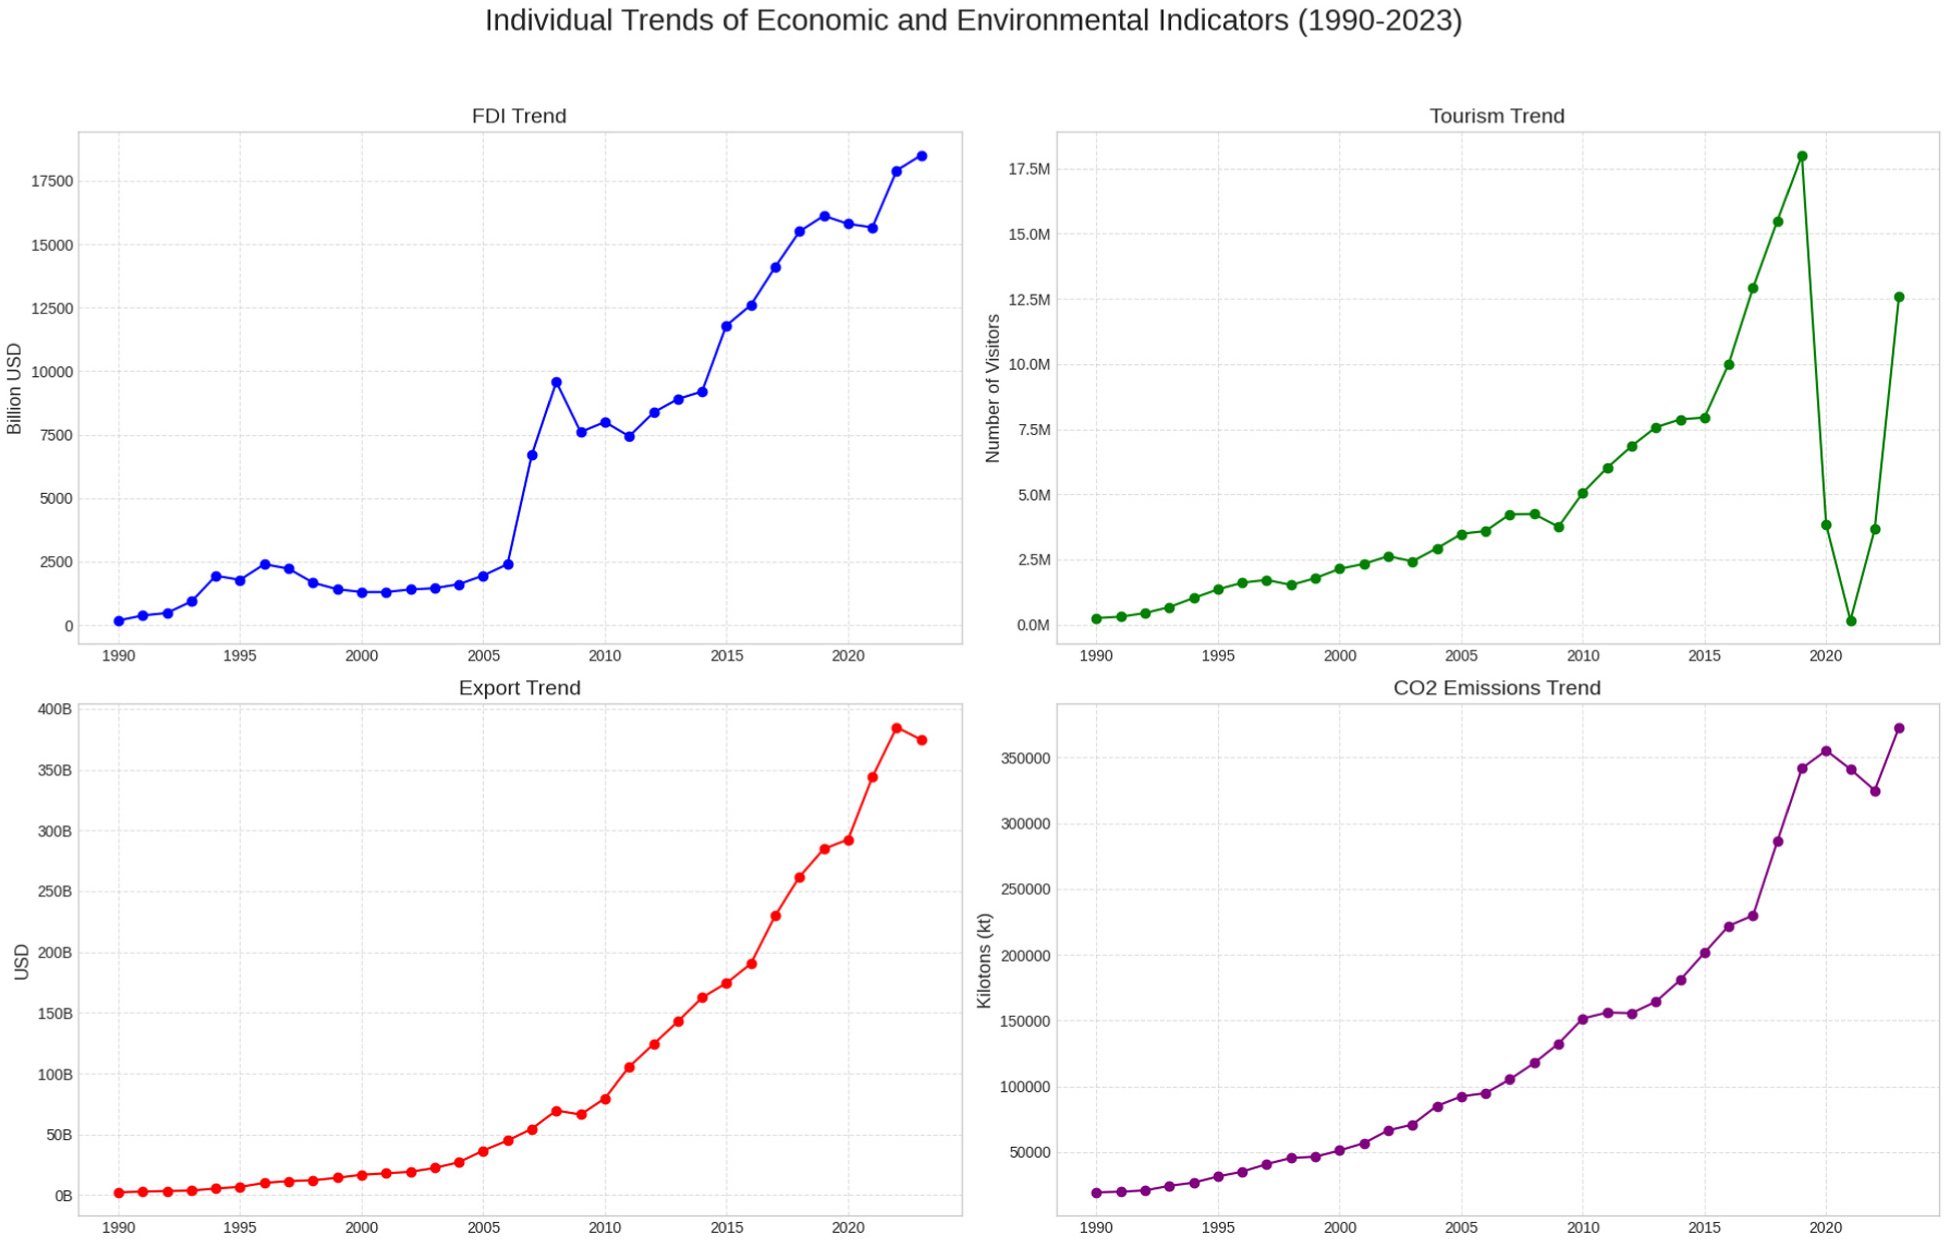
The charts in Figure 2 illustrate the trends in the variable’s values over time. Each chart provides a detailed view of how these values have changed, offering clear insights into their historical progression and patterns across time.
Description of the factor values by year in the collected dataset.
Based on the data in Figure 2, it shows that:
FDI: It shows a general upward trend in Foreign Direct Investment, with some fluctuations between 2008 and 2015, and strong growth from 2016 onward.
Number of International Visitors: It indicates steady growth in tourism until about 2019, followed by a sharp drop due to the COVID-19 pandemic, which has recovered in recent years.
Export: The bottom-left chart displays a consistent and significant increase in exports over time, particularly accelerating after 2010.
CO2 Emissions (kt): The bottom-right chart shows a continuous rise in carbon dioxide emissions, with sharp increases after 2010. A slight decline is visible around 2020 (due to COVID-19) before rising again.
Table 2 presents the descriptive statistics of the dataset based on 34 observations, including the count, mean, standard deviation, and selected percentiles (minimum, 25th, 50th, 75th, and maximum values.
Summary Statistics of Key Variables (FDI, Tourism, Exports, CO2).

The descriptive statistics provide a broad overview of the relationships between FDI, tourism, exports, and CO2 emissions in Vietnam over the study period (34 observations). The average annual inflow of FDI is about 6,721 billion USD, with a substantial standard deviation (6,052), indicating large fluctuations across years. For Tourism, Vietnam received on average 4.72 million international visitors annually, with a wide variation (std~4.52 million). The minimum was only about 157,300 visitors, while the maximum exceeded 18 million. This large spread reflects the rapid growth of the tourism sector, particularly in the 2010s, followed by sharp contractions during the COVID-19 pandemic. Exports have the largest scale among the independent variables, with an average annual value of approximately 1.06 × 10¹¹ USD. The high standard deviation (1.20 × 10¹¹) also points to rapid and uneven growth. Average annual CO2 emissions are approximately 137,239 kt, with significant variability (standard deviation~111,790). This sharp rise mirrors the country’s accelerated industrialization growth.
Regression Results and Statistical Testing
Figure 3 represents the results of the Pearson correlation, which reports on the significance of the correlation value between variables. This study used Python to show the correlation map between variables.

Pearson correlation map of the correlation between variables.
This map illustrates the relationships among four key variables: Foreign Direct Investment (FDI), the number of international tourists, exports, and CO2 emissions. The results reveal strong positive correlations among most economic variables and environmental impact. The correlation between exports and CO2 emissions is exceptionally high (0.98), and the correlation between FDI and CO2 emissions is close to 0.97. These strong associations suggest that economic growth through industrial expansion and increased trade is closely tied to environmental degradation. FDI and exports are also strongly correlated (0.96), indicating that foreign direct investment likely supports export-oriented industries.
Meanwhile, tourism has a moderate correlation with FDI (0.72) and CO2 emissions (0.69), but a weaker correlation with exports (0.64). This proves that while tourism contributes to the economy, its environmental and trade-related impacts are relatively more minor. The heatmap underscores that Vietnam’s economic development strategies, reliant on FDI and exports, tend to increase environmental pressure. Policymakers must recognize this link and adopt greener technologies, enforce environmental regulations, and diversify into less carbon-intensive sectors, such as sustainable tourism, to ensure long-term, balanced growth. To detail the factors influencing CO2 emissions, see Figure 4. Below measures the correlation between CO2 and the influencing factors:

The relationships between CO2 and factors.
Figure 4 displays three scatter plots that explore the bivariate relationships between key economic variables: Foreign Direct Investment (FDI), Tourism (measured by the number of visitors), and Exports (in USD), with CO2 emissions (in kilotons). These visualizations provide an overview of how these economic factors may relate to environmental impact. The first plot reveals a moderately strong positive correlation between FDI and CO2 emissions. This shows that increased foreign investment, particularly in energy-intensive sectors, may contribute to higher levels of emissions. It is noted in several studies (Abd El-Aal, 2024; Ngoc & Xuan, 2024; Sakilu et al., 2025; Xuan et al., 2024). The second plot examines the relationship between Tourism and CO2 emissions. While a positive association is observed, the data points are more scattered, indicating variability. Tourism’s contribution to emissions is multifaceted, encompassing transportation, lodging, and service-related activities that collectively impact the environment. The third plot shows a strong positive relationship between Exports and CO2 emissions. This aligns with existing research, as export-driven economies often depend heavily on industrial processes, especially in Vietnam.
Table 3 shows the regression results examining the relationship between FDI, tourism, and exports with CO2 emissions in Vietnam. The results of the R-squared values, coefficients, T-statistics, and p-values indicate that all three variables are positively and significantly associated with CO2 emissions.
Regression Analysis of the Factors and CO2 Emissions.

The regression analysis provides strong evidence of significant linkages between factors and CO2 emissions in Vietnam. The high T-statistics and consistently low p-values across all three models confirm the robustness of the findings. Both FDI and exports emerge as dominant drivers of carbon emissions in Vietnam, while tourism plays a secondary yet significant role. For FDI, the model explains 93.98% of the variance in emissions (R2 = .939841), with a large positive coefficient of 17.90521. The high T-statistic (22.3590) and extremely low p-value (4.24e-21) confirm that FDI inflows are a major driver of emissions, most likely through energy-intensive and manufacturing-based projects. Exports show the strongest association, with R2 = .959570, indicating that nearly 96% of the variation in emissions is explained by export growth. The coefficient (9.09e-07), though numerically small due to the large scale of export values, is highly significant, supported by a very high T-statistic (27.5588) and a p-value of 7.27e-24. This underscores the carbon-intensive nature of Vietnam’s export-oriented industrial sectors. By contrast, tourism has a weaker explanatory power (R2 = .470372) but still shows a statistically significant positive relationship with emissions.
Predict CO2 Emission With a Stacked LSTM Model
To capture the temporal dependencies inherent in CO2 emission data, the study applied a time-window sequence approach. The lag features were implicitly included through the sequential nature of LSTM. This approach ensured that the Stacked LSTM could effectively leverage historical dependencies without introducing redundancy or noise. The architecture of the Stacked LSTM model is designed according to section 3.3. This study used Python to train this model. After the training process, the performance of this model is summarized in Table 4.
Summary of the Stacked LSTM Model’s Performance.
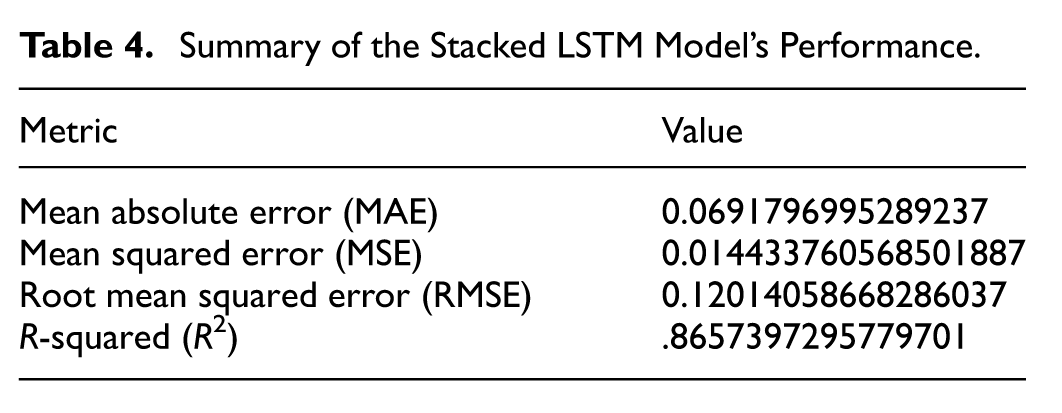
The evaluation metrics presented in Table 2 provide strong evidence of the robustness and accuracy of the proposed Stacked LSTM model. The Mean Absolute Error (MAE) of 0.0692 and the Root Mean Squared Error (RMSE) of 0.1201 indicate that the model’s prediction errors are relatively small, suggesting that the forecasts closely approximate the observed values. The Mean Squared Error (MSE) of 0.0144 further confirms the model’s ability to minimize large deviations, reflecting stability in handling fluctuations in the dataset. The R-squared (R2) value of .866 demonstrates that the model explains nearly 87% of the variance in CO2 emissions, which is considered a fit in time-series forecasting contexts.
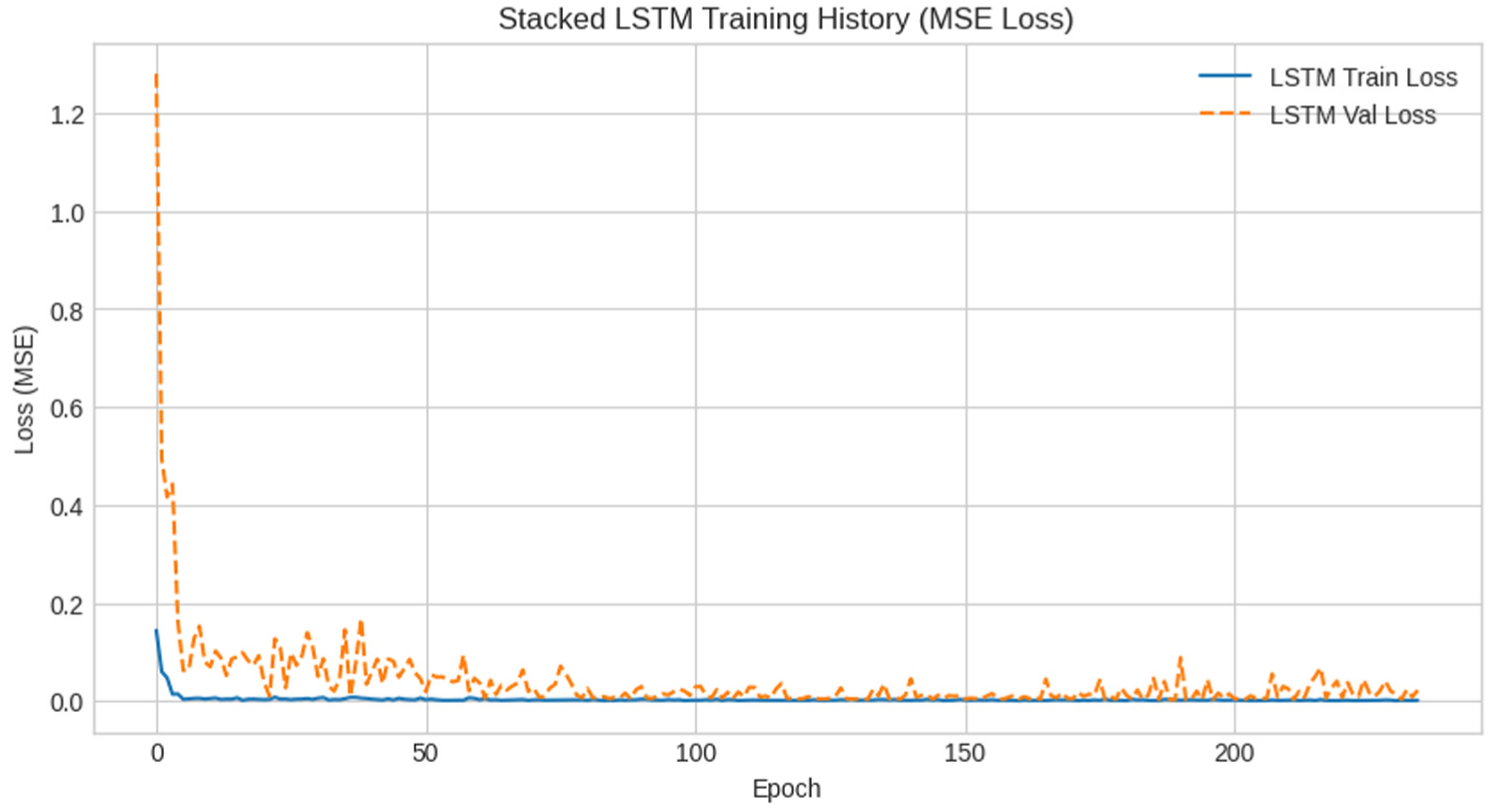
Figure 5 illustrates the training history of a Stacked LSTM model, showing both training and validation loss (MSE) over 250 epochs, Adam optimizer, learning rate = 0.001, batch size = 32. The training loss (solid line) continues to decrease and stabilizes near zero, showing the model’s ability to fit the training data, indicating effective learning.
Validation loss (MSE).
Figure 5 presents the training and validation loss curves for the Stacked LSTM model, measured by Mean Squared Error (MSE). The results indicate that the model achieved rapid convergence during the first 10 to 20 epochs. After this initial phase, the loss values gradually stabilized, suggesting that the model effectively captured the underlying patterns in the data. By approximately 50 epochs, the validation loss exhibited minor fluctuations but remained consistently low. The relatively close alignment between the training and validation loss curves also indicates that the model avoided significant overfitting. Although the validation loss shows slight oscillations, these remain within an acceptable range. The final plateau at near-zero loss values confirms the robustness of the model, supporting the predictive results reported in terms of MAE, RMSE, and R2.
Next, the study compares the performance of the Stacked LSTM model with several other forecasting models, such as Neural Networks, ARIMA, Naive Bayes, and KNN, as shown in Table 5.
Compare the Accuracy of the Proposed Stacked LSTM and Other Models, ARIMA, Neural Networks, and Naive Bayes.

Table 3 compares the performance of several models, including Stacked LSTM, ARIMA, Neural Networks, Naive Bayes, and KNN, based on four evaluation metrics: RMSE (Root Mean Squared Error), R-squared, MAE (Mean Absolute Error), and MSE (Mean Squared Error). The stacked LSTM Model demonstrates the best overall performance with the lowest RMSE (0.1201), highest R-squared (.8657), and lowest MAE (0.0691) and MSE (0.0144). This suggests that Stacked LSTM is the most accurate and reliable model among those compared. ARIMA performs reasonably well, with an RMSE of 0.1124, R-squared of .4754, MAE of 0.0958, and MSE of 0.0126. Neural Networks have a higher RMSE (0.1676), lower R-squared (.2877), and higher MAE (0.1520) and MSE (0.0281) compared to the stacked LSTM and ARIMA, indicating lower accuracy. Naive Bayes shows the worst performance across all metrics, with the highest RMSE (0.8711), a negative R-squared (−.1364), and very high MAE (0.8626) and MSE (0.7588). This model is unsuitable for the task. KNN also performs poorly, with a high RMSE (0.3865), low R-squared (.0921), and high MAE (0.3670) and MSE (0.1493).
Figure 6 shows the comparison between actual CO2 emissions and predicted values from different forecasting models on the test set (2017–2023)

CO2 emission prediction performance of different models.
Figure 6 compares the performance of four different models—Stacked LSTM, DNN (Deep Neural Network with one hidden layer), KNN (K-Nearest Neighbors), and ARIMA—in predicting CO2 emissions from 2017 to 2023. The “Actual CO2 (Test Set)” line represents the real CO2 emission values, allowing for a visual comparison of each model’s accuracy. This model appears to provide the most accurate predictions, with its line closely following the actual CO2 trend. The DNN model’s predictions are less accurate than the Stacked LSTM. It tends to underestimate the actual CO2 values. KNN performs the worst. Its predictions are relatively flat and fail to capture the increasing trend of CO2 emissions, indicating that it is not suitable for this time-series forecasting task. ARIMA also underperforms compared to Stacked LSTM. Its predictions show an increasing trend from the actual values. Next, the study compares the forecast results for the years 2025 and 2030 between the reality (2024) and Stacked LSTM models after the final data transformation, as shown in Table 6 below. Table 6 shows the result of the CO2 prediction based on the Stacked LSTM model.
The Final Prediction Results by Stacked LSTM.

The table presents a comparison of actual CO2 emissions for the year 2024 with CO2 emission predictions made by a Stacked LSTM model for the years 2024 through 2030. For 2024, the Stacked LSTM model predicts a CO2 emission value (383,177.8722 kt) that is very close to the actual CO2 emission (384,883.37 kt). This suggests the model’s prediction for the initial year is fairly accurate. The model predicts a fluctuating trend in CO2 emissions for the years 2025 to 2027. Emissions are predicted to decline in 2025, rise in 2026, and continue to increase in 2027.
Figure 7 illustrates the historical trend and forecast of CO2 emissions in Vietnam. This visualization provides evidence of persistent emission growth from 1990 to 2023, and a rising trend to 2030.

Forecasted CO2 emissions from 2024 to 2030 in Vietnam.
The figure presents a time-series plot of CO2 emissions, spanning both historical data (1990–2023) and forecasted values (2024–2030). The Stacked LSTM model predicts that this upward trend will continue through 2030. The forecast shows a consistent increase in CO2 emissions. The historical trend indicates a growing CO2 level due to increased industrial activity, energy consumption, and other human activities. The model’s forecast suggests that without significant intervention or changes in current practices, this trend is expected to persist.
Discussion
Key Findings
Based on the analysis of data, some key findings related to CO2 emission predictions are shown for this study.
The study found that there is a positive correlation between FDI, Tourism, Exports, and CO2 emissions, implying that growth in these areas is associated with increased CO2 levels. This finding was also found in some previous studies (Raihan, 2024; Xuan et al., 2024). The forecasted CO2 emission trends reveal important linkages to Vietnam’s prospective economic scenarios. Periods of accelerated FDI inflows and export expansion are projected to coincide with sharper increases in emissions, underscoring the trade-off between export-led growth and environmental sustainability. This suggests that while trade and investment remain vital engines of economic development, their unchecked expansion may reinforce Vietnam’s carbon-intensive growth trajectory. In addition, surges in international tourist arrivals are associated with short-term spikes in emissions, emphasizing the urgency of promoting green tourism practices, such as low-carbon transportation, eco-friendly accommodations, and stricter environmental standards for service providers. This finding highlights that Vietnam’s long-term growth strategy must be accompanied by stronger policy frameworks to decouple economic performance from environmental degradation.
The proposed Stacked LSTM architecture comprising two LSTM layers, three fully connected layers, and two activation layers consistently outperforms benchmark models such as ARIMA, traditional Neural Networks, and K-Nearest Neighbors (KNN) in forecasting CO2 emissions in terms of evaluation parameters. It achieves the highest predictive accuracy, the strongest model fit, and the lowest error rates across evaluation metrics. Notably, the prediction for the initial year (2024) closely approximates the actual CO2 emission value, underscoring the model’s capability to capture short-term dynamics while maintaining robustness for longer-term projections.
The historical data and the Stacked LSTM model forecasts reveal a persistent upward trajectory in CO2 emissions, indicating that emissions are likely to continue rising in the near term. However, the model also projects a gradual leveling off after 2027, suggesting a potential stabilization in emission growth that may reflect structural shifts in Vietnam’s economic or energy landscape.
Policy Implications
The key findings of this study provide valuable insights for policymakers in Vietnam as they navigate the dual challenge of sustaining economic growth while reducing environmental pressures. The forecasting model demonstrates that surges in FDI, tourism, and export activities are strongly associated with rising CO2 emissions. These findings highlight the need for policies that strategically decouple economic expansion from carbon intensity.
First, policymakers should design incentive structures that attract FDI into renewable energy, clean technology, and low-carbon manufacturing sectors, thereby shifting investment away from fossil fuel–dependent industries. At the same time, export-oriented growth strategies should incorporate environmental standards and carbon footprint assessments to ensure that increased trade does not exacerbate the country’s carbon trajectory.
Second, the tourism sector requires tailored interventions to mitigate its episodic but noticeable emission increases. Expanding low-carbon tourism initiatives—including eco-friendly accommodations, sustainable transport systems, and stricter environmental certifications—can help reduce the sector’s environmental burden while maintaining its role as a major contributor to GDP.
Finally, the forecasting framework developed in this study can serve as an evidence-based tool for policy planning. By integrating predictions into long-term development strategies, the government can adopt proactive measures such as carbon pricing mechanisms, energy efficiency regulations, and adaptive monitoring systems. This forward-looking approach would enable Vietnam to meet its economic objectives while moving closer to national and international climate commitments.
Theoretical Implications
Beyond practical applications, the study also contributes to the theoretical understanding of the relationship between economic growth and environmental sustainability. The forecasted upward trend in CO2 emissions, followed by a potential stabilization after 2027, resonates with the Environmental Kuznets Curve (EKC) hypothesis, which suggests that emissions rise in the early stages of industrialization but may plateau or decline as economies adopt cleaner technologies and more stringent environmental policies.
Besides, the results align with decoupling theory, which emphasizes the importance of separating economic growth and environmental degradation. The demonstrated link between FDI, exports, tourism, and CO2 emissions illustrates the risks of a carbon-intensive growth model, while also highlighting green growth opportunities through technology transfer, renewable energy adoption, and sustainable trade practices. Integrating these international drivers into a unified forecasting framework extends the theoretical literature by showing how multiple macroeconomic factors interact to shape emission trajectories, rather than considering them in isolation.
Finally, the application of advanced deep learning techniques, such as the Stacked LSTM model, contributes to methodological discussions within environmental economics. While traditional econometric models have been widely used to test environmental theories, this study demonstrates that machine learning can complement theory-driven approaches by uncovering complex nonlinear relationships and offering predictive insights. This suggests a promising direction in computational forecasting.
Limitations and Future Works
While this study provides valuable insights into the relationship between international economic activities and CO2 emissions, several limitations should be acknowledged. First, although the Stacked LSTM model demonstrates strong predictive performance, it remains sensitive to outliers and structural breaks in the data. Unexpected issues such as the COVID-19 pandemic, geopolitical tensions, or disruptions in global supply chains can significantly alter the trajectories of FDI, exports, and tourism, thereby affecting the reliability of forecasts. Future studies should explicitly test the robustness of forecasting models under such irregular conditions and incorporate shock-adjusted or scenario-based simulations.
Second, the reliance on normalized data, while beneficial for ensuring comparability across variables, may obscure the magnitude of actual variability in real-world economic indicators. This limitation raises challenges for interpreting absolute changes in emissions and highlights the need for complementary approaches that preserve original scales.
Finally, the study focuses exclusively on three major drivers: FDI, Tourism, and Exports as predictors. Still, it may be beneficial to incorporate additional factors, such as energy consumption and urbanization, to improve the accuracy of CO2 emission predictions. Finally, causal inference was not used in this study. That clearly shows the causal relationship between economic factors and CO2 emissions. Including these dimensions in future models would provide a more holistic understanding of Vietnam’s emission trajectory and strengthen the explanatory and predictive capacity of forecasting tools.
Conclusion
This study examined the influence of three key factors: foreign direct investment, exports, and international tourism on Vietnam’s CO2 emissions, utilizing a Stacked LSTM deep learning model to forecast emissions for the period 2024 to 2030. The results demonstrate a strong positive association between these economic factors and rising carbon emissions, confirming that Vietnam’s trade- and investment-led growth has been achieved at a substantial environmental cost. Both historical data and forecasting results reveal an overall upward trend in emissions, though the model also suggests a potential stabilization after 2027, indicating structural shifts in Vietnam’s economic and energy systems.
The findings carry important policy implications, as they highlight the urgent need for Vietnam to decouple economic growth from carbon intensity. The forecasting tool offers policymakers evidence to anticipate future emissions and design proactive interventions, such as redirecting FDI toward clean technologies, strengthening energy efficiency standards, and promoting low-carbon tourism and trade practices.
Despite these contributions, the study has several limitations. Building on the study’s limitations, future research could explore several directions. The future work will consider integrating shock-sensitive or hybrid models to capture better unexpected disruptions, such as pandemics, supply chain failures, or geopolitical instability. Additionally, the study also expands explanatory variables to include energy mix, renewable adoption, technological innovation, and environmental regulations, which would offer a more comprehensive view of emission drivers and green transition effects. Finally, applying the framework to other emerging economies would test its generalizability, refine environmental economic theories, and provide broader lessons for sustainable development.
The future research will enhance the robustness of forecasting models by integrating shock-sensitive or hybrid approaches, broadening the scope of explanatory variables, and incorporating geospatial or sectoral analysis to capture emission heterogeneity across regions and industries. Comparative studies with other emerging economies could also test the generalizability of the model. This study also underscores that Vietnam stands at a critical juncture. If the government does not implement strategic interventions, rising emissions could undermine long-term sustainability. However, with timely and well-designed policies, the country has the potential to pursue an economic trajectory that is both prosperous and environmentally responsible.
Footnotes
Ethical Considerations
This study used publicly available secondary datasets; therefore, formal ethical approval was not required.
Consent to Participate
This study did not involve human participants or animal subjects. The research is based solely on secondary datasets that are publicly available.
Author Contributions
Ha Thi Thu Nguyen confirms being the sole contributor of this work and has approved it for publication.
Funding
The author received no financial support for the research, authorship, and/or publication of this article.
Declaration of Conflicting Interests
The author declared no potential conflicts of interest with respect to the research, authorship, and/or publication of this article.
Data Availability Statement
The datasets used in this study are publicly available from official statistical sources. Further details are available from the corresponding author upon reasonable request.