
Abstract
The impacts of shadow banking regulation on bank risks remain inadequately understood in existing literature. To address this gap, we develop a comprehensive index of China’s shadow banking regulation intensity through textual analysis and machine learning techniques to empirically examine regulatory effects on banks’ multidimensional risks. Analyzing data of 181 commercial banks from 2007 to 2020 in China, we demonstrate that intensified shadow banking regulation leads to higher risk, manifested by more non-performing loans, lower profitability, and more conservative practices, as indicated by higher loan loss provisions and lower liquidity risk. The findings remain robust across multiple endogeneity and robustness tests. Mechanism tests confirm that the channel behind these effects is that tighter shadow banking regulation curtails banks’ shadow banking business. Moreover, expansionary monetary policy attenuates the economic costs of regulation and vice versa. These findings provide insights for authorities to enhance the effectiveness of regulatory policies.
Plain Language Summary
In recent years, Chinese financial regulatory authorities have consistently strengthened the regulation of shadow banking to control shadow banking activities and enhance the stability of the financial system. Questions worth studying is: What is the effectiveness of shadow banking regulation? Has it reduced risks in the banking industry? To investigate this, we developed an index that measures the intensity of shadow banking regulation in China and used it to examine the impact of shadow banking regulation on bank risks. Our findings indicate that increased regulation intensity results in higher bank risk, as indicated by more non-performing loans and lower profitability, and more conservative practices, as indicated by higher loan loss provisions and lower liquidity risk. We also investigated the mechanisms behind these effects and found that tighter regulation led to a reduction in banks’ shadow banking activities. Additionally, we discovered that expansionary monetary policies helped mitigate the negative economic consequences of regulation, and vice versa. Our study has significant implications for policymakers and regulatory authorities. It emphasizes the importance of meticulously designing and implementing regulatory policies to maximize their effectiveness in risk management within the banking sector. By comprehending the impact of shadow banking regulation, authorities can make well-informed decisions to safeguard the stability of the financial system.
Introduction
The shadow banking system was an important contributor to the 2008 global financial crisis (Claessens et al., 2012). There has been an international consensus to strengthen shadow banking regulation in post-crisis periods. Although shadow banking is still relatively modest in most emerging market economies (EME), its growth is alarming, and may contribute to systemic fragility of the financial system (Ghosh et al., 2012).
China’s shadow banking system differs in nature from that of advanced economies, due to factors including the financial structure, levels of financial deepening and regulatory policy orientation. It mostly manifests as quasi-credit. Shadow banking loans are the core of quasi-credit shadow banking, although they are not regulated as loans and are conducted in a low-transparency manner. Thus, China’s shadow banking has exposed the banking sector to significant potential risks. In this regard, China’s financial regulators have enacted a series of policies to control shadow banking, such as the Notice on Regulating Relevant Matters concerning the Wealth Management Cooperation between Banks and Trust Companies (China Banking Regulatory Commission [2010] No.72) and the Guiding Opinions on Regulating the Asset Management Business of Financial Institutions (People’s Bank of China [2018] No.106). The regulatory measures led to a reduction in the scale of China’s quasi-credit shadow banking by nearly 30 trillion yuan from its historical peak, as claimed by the China Banking and Insurance Regulatory Commission in January 2023. Nevertheless, it is rarely investigated how effective shadow banking regulation may reduce risks in the banking sector. Clarifying this issue is of economic and policy importance, as it advances research in shadow banking and provides significant insight into improving the efficiency of financial regulations.
There is burgeoning literature evaluating financial regulations, with particular emphasis on their effectiveness in restraining bank risks. Although the majority of research concurs that tighter enforcement of financial regulations can effectively lower bank risks (Berger et al., 2021; Hirtle et al., 2020), the assessment of regulatory efficacy is inconclusive because of diverse regulatory targets and standards (González, 2005; Klomp & de Haan, 2014). Concerning economic consequences of shadow banking regulation, theoretical literature suggests that while stronger regulation of shadow banking may mitigate risks, it may also bring about undesirable consequences (Ordoñez, 2018; Zhou & Wang, 2021). However, empirical research in this field is limited. Existing studies predominantly rely on natural experiments to evaluate the efficacy of specific regulatory policies targeted at shadow banking activities (Akhigbe et al., 2016; Liu et al., 2023; Y. Peng et al., 2023). Nevertheless, these studies are constrained by their focus on individual regulatory interventions, thus offering a narrow perspective on the overall efficacy of shadow banking regulation.
This study closes the gap by developing a unique index of the intensity of China’s shadow banking regulation. Two common approaches to quantify the intensity of regulatory policies are used in the existing research. The first employs a regulatory indicator to measure regulatory intensity (Liu & Xie, 2021; Wang et al., 2021). However, this method has the drawback of only having a single criterion and is inappropriate for replication. The second strategy is supported by survey data from Barth et al. (2004, 2013), Laeven and Levine (2009), He et al. (2021). Despite comprehensive issue coverage and detailed categorization, this method faces limitations from subjective bias and restricted temporal scope. However, neither approach is appropriate for gauging shadow banking regulation given the differences between shadow banking and traditional banking regulations, such as the novel and broad range of businesses involved, the diversity of regulatory objects and matters and the dearth of regulatory indicators. This study enhances current efforts based on financial regulation policy documents in three ways. First, our measurement strategy can be applied to any other subject by employing the Latent Dirichlet Allocation (LDA) algorithm (Blei, 2003). Second, the measurement can be calculated on a frequent basis, such as annually, quarterly, or even monthly. Third, the cost is low compared to the questionnaire and expert scoring methods. We process texts using Natural Language Processing (NLP) techniques, greatly reducing manual workload and time.
Our study contributes to the banking literature by documenting empirical evidence on impacts of shadow banking regulation on multidimensional bank risks, complementing literature on the effectiveness of financial regulation. Using a sample from China that includes 181 commercial banks from 2007 to 2020, we conduct empirical analyses to examine the influence of shadow banking regulation on banks’ multidimensional risks. Following Hirtle et al. (2020), we investigate three risk dimensions—credit risk, earnings risk, and liquidity risk—to fully capture the responses of China’s banking sector faced with tightening shadow banking regulation. To alleviate the endogeneity issue, we apply several methods and carry out robustness tests to confirm our key conclusions. Moreover, we perform analysis to shed light on the underlying mechanisms. In addition, we also investigate whether these correlations are counteracted by monetary conditions. Our findings reveal that stricter shadow banking regulation increases bank credit risk and earnings risk while reducing liquidity risk, with these effects varying significantly across different monetary policy conditions.
Furthermore, the findings of this paper are of policy interest. First, the stability of China’s banking sector deserves greater concerns, as Chinese banks, albeit being in an emerging market economy (EME), have become increasingly competitive in the global financial system over the last decade. With total assets around $50 trillion, China’s banking system is currently the largest in the world, surpassing the US’s $23 trillion. This paper offers valuable insight into enhancing the efficiency of financial regulations and fostering the healthy development of the financial market. Second, considering that China accounts for 70% of all EME non-bank financial intermediation assets, our research on China can also shed light on the less well-known EME shadow banking sectors (Financial Stability Board, 2021, 2022). Our methodology is applicable to financial markets in other economies with comparable regulatory frameworks.
The paper proceeds as follows: Section “Literature Review” provides a comprehensive literature review. Section “Hypothesis Development” presents our theoretical framework and hypotheses. Section “Methods, Variables and Data” outlines the methodological framework, including the construction of shadow banking regulation intensity index, empirical model specification, data sources, and variable selection. Section “Results” explores empirical evidence. Section “Conclusion” concludes and discusses policy implications.
Literature Review
The Shadow Banking System in China
The Financial Stability Board (2013) characterizes shadow banking system as a credit intermediation operating wholly or partially beyond traditionally regulated banking. Although like traditional banks, shadow banks perform credit and maturity transformation, they are inherently fragile due to the absence of both implicit and explicit public liquidity support and tail risk protection (Adrian & Ashcraft, 2012). Shadow banking in advanced economies is dominated by off-balance sheet financing techniques to intermediate credit. It differs from the on- and off-balance sheet financing typically conducted by traditional banks (Gorton & Metrick, 2010; Pozsar et al., 2012). Compared with western counterparts, the structure of China’s shadow banking system is unique. Chinese shadow banking activities entail various financial products, including wealth management products (WMPs; Allen & Gu, 2020). The core feature of China’s shadow banking system is its close association with commercial banks and its reliance on implicit guarantees from banks and the government (Dang et al., 2019).
Three main forces drive China’s shadow banking activities. First, strengthening traditional banking regulations prompt banks to engage in regulatory arbitrage. Hachem and Song (2017) attribute rapid expansion of shadow banking to stricter liquidity rules in the late 2000s. Liu et al. (2022) find that the capital-constrained banks increase their exposure to shadow loans to circumvent regulatory limits. Second, some studies indicate a link between the fiscal stimulus plan in 2008 and the rise of the sector. For example, Z. Chen et al. (2020) find that the shift in local government debt from bank loans to non-bank debt following the stimulus plan, is closely related to the rapid increase in shadow banking activities. Third, shadow banking expands partly because of the necessity to circumvent various credit restrictions enforced by the central government on banks (Zhu, 2020).
The economic implications of shadow banking are multifaceted. Shadow banking provides broader access to affordable credit and further increases investment and consumption, thereby boosting economic growth (Feng et al., 2023). Tsai (2017) argues that shadow banking can be productive in China because non-banking financial institutions (NBFIs) are familiar with local business needs and could establish a lasting foundation for commercial financial intermediation serving small and median enterprises (SMEs). Nevertheless, a substantial body of research focuses on the disadvantages of shadow banking. Lindgren (2018) highlights that shadow banking evades traditional bank regulations and amplifies systemic risk due to lack of transparency and implicit government guarantees. Empirical studies provide further evidence of the risks. For instance, Moreira and Savov (2017) uncover how shadow banking contributes to financial fragility. Ouyang and Wang (2022) find that WMP offerings deteriorate the stability of Chinese banking sector, predominantly owing to asset-liability maturity mismatches and abrupt funding constraints.
The Shadow Banking Regulation and Bank Risks
Following the global financial crisis, there has been a coordinated policy response to enhance shadow banking regulatory frameworks, aimed at reducing systemic risk exposure and strengthening financial stability. In developed economies, a range of initiatives has been implemented, including reinforcing capital and liquidity regulations, strengthening transparency and disclosure requirements, restricting banks’ off-balance-sheet activities, limiting securitization, and monitoring non-financial institutions (Adrian & Jones, 2018; Gabor, 2018). For example, in 2010, the US enacted the Dodd-Frank Act to alleviate systemic risk, terminate implicit guarantees, and develop better market discipline (Balasubramnian & Cyree, 2014). Similarly, China also implemented a series of regulation policies to keep shadow banking system under stricter regulation. For example, the New Regulation on Asset Management Business seeks to standardize asset management activities of financial institutions, particularly addressing issues concerning shadow banking. However, given that shadow banking supplements available funding sources, the optimal intensity of shadow banking regulatory measures and the consequences of such regulation, remain indeterminate.
There’s abundant literature on the impact of financial regulations, including the capital requirement, liquidity regulation and macroprudential regulation, on bank risks. However, the conclusions regarding whether these regulations effectively mitigate risks remain mixed. A substantial body of studies sheds light on the crucial role of various financial regulatory measures in suppressing banks’ risk-taking, improving transparency and thus reducing bank risks (Allen et al., 2012; Duijm & Wierts, 2016; Kandrac & Schlusche, 2017). These studies advocate for promoting financial development and soundness through enhanced regulations (Barakat & Hussainey, 2013). However, stringent regulations may alternatively have unintended consequences, such as amplifying certain types of risks by increasing banks’ operating costs (Guiso et al., 2006), incentivizing risk-taking activities (Blum & Hellwig, 1995), inducing a credit crunch (Jiménez et al., 2012), and triggering regulatory arbitrage (Acharya et al., 2012). In addition, some studies find that the correlation between financial regulations and bank risks is influenced by heterogeneous factors (Anginer et al., 2018; Laeven et al., 2016).
Burgeoning theoretical literature examines economic implications of shadow banking regulation. Ordoñez (2018) develops a model and finds that more extensive regulation on traditional banking and the elimination of shadow banking may cause undesirable consequences, potentially creating a “new shadow banking system” where banks engage in more fragile risk-taking behaviors. Zhou and Wang (2021) conduct a counterfactual analysis of regulatory policies and indicate that stronger regulation in China can effectively reduce the scale of shadow bank financing and control systemic financial risks, while it is at the cost of reducing investment efficiency, misallocating resources and decreasing the steady-state output level. Constrained by the scarcity of data, empirical studies on outcomes of shadow banking regulation, especially its potential to mitigate bank risks are relatively rare. Akhigbe et al. (2016) offer empirical evidence suggesting that banks experience a reduction in risks in post-Dodd–Frank era. In China, Liu et al. (2023) and Y. Peng et al. (2023) find that the introduction of policies aimed at curbing shadow banking activities in China has indeed mitigated bank risks.
Overall, China’s shadow banking system exhibits unique forms and characteristics. While most literature focuses on the traditional bank regulation, research of shadow banking regulation is relatively scarce. Although a few empirical studies have examined the relationship between the shadow banking regulation and bank risks, they have primarily evaluated the efficacy of a single instrument. In reality, shadow banking regulation in China is a dynamic and ongoing process. Therefore, our paper aims to fill the research gap by constructing an index of China’s shadow banking regulation intensity based on analyzing a series of regulatory policy documents. We also investigate the implications for bank risks, thus advancing comprehension of regulatory dynamics within China’s shadow banking sector.
Hypothesis Development
Shadow Banking in China
Shadow banking in China is more integrated into the traditional banking system than that in the United States (Dang et al., 2019; Elliott et al., 2015). In China, shadow banking and traditional banks complement each other in providing credit rather than substitute. Sun (2019) defines a bank’s shadow as a significant component of China’s shadow banking system. A critical feature of a bank’s shadow is that it camouflages loans as alternative items on and off its balance sheet for regulatory arbitrage (Ehlers et al., 2018).
Commercial banks engage in shadow businesses both on- and off-balance sheets. On-balance sheet shadow banking provides loan-like funding to firms through interbank and investment channels. With the interbank channel, banks cooperate with another financial institution and record funds as interbank assets, while partners with fewer regulatory constraints lend directly to firms. Banks hide loans as investment assets in the investment channel and provide funding through trust companies and securities companies. Thus, banks can circumvent regulatory requirements, disguising leverage for profitability (K. Chen et al., 2018). Off-balance-sheet shadow banking is characterized by banks using short-term funds raised from non-principal guaranteed wealth management products to provide funding to firms or channel investments into trust and securities companies (Ehlers et al., 2018).
Direct Consequences of Shadow Banking Regulation
Based on the institutional background, strengthening shadow banking regulation may have two direct consequences. First, it forces banks to transfer some off-balance-sheet shadow banking items back to the balance sheet and reclassify some disguised assets as loans, which means more binding regulatory constraints on capital adequacy and liquidity. Second, it restricts banks’ participation in shadow banking activities, leading to a contraction in shadow banking operations.
In the first circumstance, the banks’ credit risk may increase in the short term. Borrowers of shadow banking usually have difficulty borrowing directly from banks (Hachem, 2018; Sun, 2019). Alternatively, shadow banking channels fund underserved and potentially riskier sectors and establish structures to convert loans into other types of assets, thereby obscuring the underlying credit risks (Ehlers et al., 2018). Once shadow banking regulation is tightened, the risks embedded in the corresponding on- and off-balance-sheet shadow banking items will be revealed. Based on this analysis, we put forward the following hypotheses:
Under the second circumstance, banks’ profitability may decrease while earnings volatility may increase, leading to larger earnings risk exposure. The reason might be that intensified regulation compels banks to terminate profitable shadow banking activities or allow shadow banking products to mature without renewal.
In addition, shadow banking regulation may also raise banks’ liquidity risk exposure. When banks’ shadow businesses hidden in interbank or investment accounts are transferred to the loan account, the proportion of liquid assets reduces, and liquidity risk increases accordingly. Meanwhile, banks may face a liquidity crisis once investors' confidence is shaken and a significant withdrawal of deposits or wealth management products on the liability side occurs. This may stem from investors’ higher sensitivity to banks’ negative information, or their interests or beliefs directly influenced by newly implemented shadow banking regulation. For instance, the New Regulation on Asset Management Businesses issued in 2018, prohibits banks from issuing principal- or return-guaranteed WMPs and emphasizes that investors are responsible for their investment gains or losses. Consequently, investors who initially believe in banks’“implicit guarantee” may reduce or even redeem their wealth management products (Dang et al., 2019). Drawing from this argument, we propose the third hypothesis:
Proactive Risk Management Behavior of Commercial Banks
The hidden risk becomes explicit following the strengthening of regulation, namely, the worse loan quality and falling profitability and liquidity levels, creating significant pressure on bank operations. Therefore, it is rational for banks to focus more on prudent operations when facing strengthening regulations, consistent with existing literature (Berger & Bouwman, 2013; Klomp & de Haan, 2014).
Banking theory suggests that banks may pursue safer strategies by stopping risky activities and improving risk management procedures when facing strengthened regulation and supervision (Berger et al., 2021). First, increased regulation lowers the probability of bank insolvency and reduces banks’ moral hazard incentives (Berger & Bouwman, 2013). Second, increased regulation makes banks more aware of their risk management culture, which improves their operational soundness (Chaly et al., 2017). Third, intensified regulatory scrutiny of risk management may elevate the role of bank risk managers, thus alleviating principal-agent frictions within banking organizations (Hirtle et al., 2020).
For earnings risk, banks develop new profitable and sustainable businesses to offset the negative impacts of shadow banking regulation, which may be challenging to achieve in the short term. For credit risk, banks may actively respond to potential defaults by raising loan loss provisions. For liquidity risk, banks may proactively manage their liquidity position and reduce (increase) the proportion of illiquid assets (liquid assets), thus enhancing their liquidity and reducing liquidity risk (Imbierowicz & Rauch, 2014). This action may, to some extent, counteract rising liquidity risks. Considering banks’ proactive risk management behavior, we modify the research hypotheses as follows.
Methods, Variables, and Data
Measuring Shadow Banking Regulation Intensity
Framework of Shadow Banking Regulation Intensity Index
Quantitative political science research traces its origins to Libecap (1978). As the field developed, researchers began to implement fresh inter-disciplinary strategies. These approaches qualify and quantify policy stances and tendencies (Shapiro & Wilson, 2019). In keeping with these groundbreaking efforts, we use NLP techniques and corpus linguistic methodologies to create an index of financial regulation intensity. Drawing on textual analysis of regulatory documents, the index incorporates three components—policy issuer, policy tone, and policy measures—as outlined in Table 1. Following J. Peng et al., (2008), the index Reg is defined as:
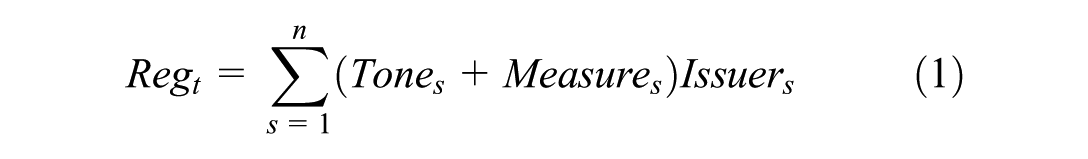
where n presents the count of regulatory documents released during period t.
Framework of the Regulation Intensity Index.

As noted above, Table 1 outlines the framework of the index measurements and details for categories of the three dimensions. The appropriate weights for combining categories into three dimensions are determined using CRITIC, an objective weight assignment approach.
Policy Issuer
This dimension includes two secondary indicators: administrative level and joint issuance. For the administrative level, we assign the score as follows: the State Council (2 points), the People’s Bank of China (1.5 points), the China Banking and Insurance Regulatory Commission and the Securities and Futures Commission and other institutions (1 point). In cases of joint issuance, the value is assigned based on the highest-ranking issuing authority. As for the measure for “joint issuance,” a score of 2 is assigned to policies jointly released by multiple institutions, while individually issued policies are given a score of 1.
Policy Tone
We use sentiment analysis to measure the tone. Negative tone, as defined in our paper, refers to (a) the regulator’s negative comments regarding the businesses undertaken by the regulated, in conjunction with (b) the modal phrases indicating increased regulation intention. That is, more negative policy texts and harsher tones imply strengthened intensity. Practically, the dictionary method is employed:
Specifically, we select 149 non-repetitive negative-toned text segments from 77 vital official documents referring to Sun (2019). Negative sentiment words/phrases are identified according to the frequency and checked against the general dictionary. New negative phrases are added if they were previously neglected such as “to seek accountability after misbehavior” (问责), “rectification” (整治), “chaos” (乱象). If the words/phrases are already included in the basic dictionary, but its connotation in policy texts differs from its general usage, we would change its classification. For example, “规范” when used as an adjective is classified as a positive word in the basic dictionary, but under the policy text context, it is used as a verb meaning “enforce strict compliance/regulation.” Therefore, it is classified as a negative word in our dictionary. Following this approach, 74 negative words are added to the dictionary, the list of which is shown in Appendix Table A.1. We check the classification of phrases in the dictionary one by one with the context of the policy documents and form a financial regulatory lexicon containing 1,508 negative phrases.
Step 3: Define and quantify negative tone. Following Henry (2008) and Loughran and McDonald (2011), we calculate absolute negative tone, the ratio of negative phrase frequency to the total phrase frequency. The reason for using absolute negative tone is as follows. Unlike texts such as announcements of listed companies, press news and public opinion, positive phrases in policy texts generally appear at the beginning of documents, are more symbolic in form, and often have no substantive point. Therefore, absolute negative tone is used in this paper.
Policy Measures
We consider both breadth of coverage and depth of policy measures. The more regulated institutions involved, and the types of regulated activities covered by a policy, the wider the breadth. The depth is measured with corpus linguistic features. The more hierarchies in the headings, the more specific the listed measures are. In addition, in the policy text, threshold numbers often denote specific requirements of restrictive standards.
Crawling, Pre-Processing, and Screening of Policy Texts
Collection and Pre-Processing of Policy Documents
This paper constructs a list of key words for shadow banking regulation with reference to CBIRC Research Group (2020) and Li (2019). Regulatory documents are obtained from nine official websites, including the State Council, People’s Bank of China, and China Banking and Insurance Regulatory Commission. We search the archives of each website from January 2000 to December 2020 and obtain 5,488 policy documents. Then, we use textual analysis techniques to pre-process the raw texts, including word segmentation and excluding common stop words.
Policy Text Screening
The main challenge is to screen policy documents aimed at regulating shadow banking. Following Hansen et al. (2018), we apply the keyword matching method and LDA machine learning algorithm and obtain 682 policy documents.
① Keyword matching method
Upon completing data preprocessing via “Jieba,” we employ the keyword list for secondary matchings. While full-text matching proves sufficient for document identification in the web crawling phase, phrase-level matching is essential for precise matching.
② LDA machine learning algorithm
Latent Dirichlet Allocation (LDA) algorithm is proposed by Blei (2003) for topic classification. The number of topics contained in a corpus, n, is predetermined and the algorithm calculates n topics, each of which is described using a series of keywords and gives the probability of each text corresponding to each topic.
We select 30, 40, 50, 60, 70, and 80 as topic numbers and obtained 6 LDA classification results. For any text, we calculate the probability of each topic under any LDA classification model and selected the top two topics. If the first two topics of a document in any LDA classification do not belong to the shadow banking regulation, then we drop the document. In other words, at least one of the top two topics under each LDA classification method must belong to shadow banking regulation.
Finally, samples of financial regulatory policies that do not target shadow banking regulation are excluded. Moreover, we carry out de-duplication, resulting in 682 policy texts.
Empirical Model
Bank risks are typically considered to be persistent in banking empirical literature (Cerulli et al., 2020; Cicchiello et al., 2022; Cucinelli et al., 2020). To capture the persistent and dynamic nature of bank risks, we incorporate lagged period values of bank risks as explanatory variables in a dynamic panel model. However, according to Nickell (1981), the lagged dependent variable can introduce biased and inconsistent estimates in the fixed effect model due to the correlation between the difference of the lagged dependent variable and the difference of the error term. This issue, known as Nickell’s bias, is particularly pronounced in the “small T, large N” context. To achieve consistent estimates in the dynamic panel data model, Arellano and Bond (1991) introduce the difference GMM method first proposed by Holtz-Eakin et al. (1988) in which the second lagged dependent variable and all the further available lags are used as instruments for the difference of the lagged dependent variable. However, the performance of the Arellano-Bond estimator deteriorates under two conditions: (a) the dependent variable displays significant persistence and (b) the variance of unit-specific error component increases relative to the variance of the idiosyncratic error term. Arellano and Bover (1995) and Blundell and Bond (1998) propose augmenting the difference GMM method with the original level equation, where the lagged first-differenced dependent variable serves as the instrument for the lagged dependent variable. This method is called “system GMM.” In this study, we use the two-step system GMM approach (Arellano & Bover, 1995; Blundell & Bond, 1998) in our main regression and use difference GMM method in robustness analysis.
To explore the relationship between shadow banking regulation and bank risks, we estimate the following equation:
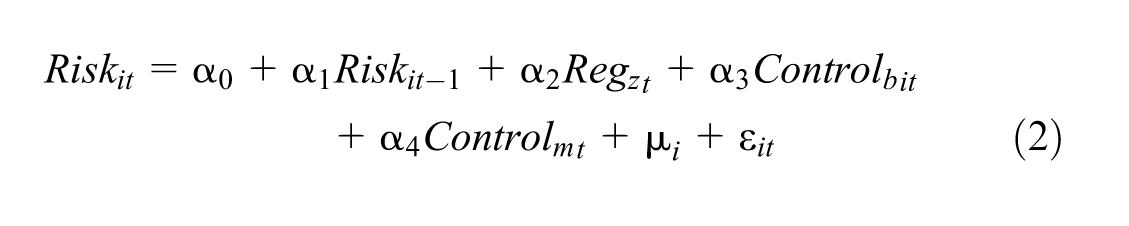
where i denotes individual banks;
In our main regression, following existing literature (Acemoglu, 2008; Cicchiello et al., 2022; Shen & Yao, 2008), we treat the lag of dependent variable and our main variable of interest (
Diagnostic tests are conducted as preliminary analyses. We carry out Sargan test (Sargan, 1958) of overidentifying restrictions to examine the absence of the correlation between the instruments and error term. The null hypothesis of the Sargan test assumes that the orthogonality condition is satisfied. If the p-value of the test surpasses .1, then it indicates that the instruments are orthogonal to the error term.
We also use Arellano–Bond AR (1) and AR (2) tests to test the first- and second-order autocorrelation of the residuals (Arellano & Bond, 1991). There should be no serial autocorrelation of the error term
Variables
For the dependent variable Risk, we consider credit, earnings, and liquidity risks following Hirtle et al. (2020). Credit risk is proxied by the ratio of non-performing loan (NPL) and loan loss provision (LLP), representing passive credit risk exposure and active credit risk management, respectively. Earnings risk is proxied by return on assets (ROA) and the standard deviation of ROA (sdROA). Liquidity risk is proxied by the liquidity ratio (LR) and the ratio of liquid assets to total deposit and short-term funding (LDR).
The key explanatory variable is
Following Laeven and Levine (2009), we control bank characteristics
Data
Our sample consists of unbalanced panel data from 181 commercial banks in China from 2007 to 2020. Bank-level data are obtained from the BankFocus Database, and macroeconomic variables are obtained from the National Bureau of Statistics of China. To address the possible outlier problem, we perform a 1% winsorize treatment for continuous variables. Descriptive statistics are displayed in Table 2.
Descriptive Statistics.

From descriptive statistics, significant variations among banks’ risks are evident. Regarding credit risk measures, the non-performing loan ratio (NPL) exhibits a standard deviation of 0.877, with a maximum rate of 7.21% and a minimum rate of 0.05%. Similarly, the standard deviation of the loan loss provision rate is 0.595, ranging from −0.002% to 3.222%. In terms of earnings risks, banks show less fluctuation. Return on assets (ROA) has a mean of 0.88% and a standard deviation of 0.361. Liquidity risks vary considerably. Liquid assets can account for as much as 62.658% of total assets and 73.257% of total deposits and short-term fundings, while these ratios can also decrease to as low as 5.78% and 6.827%, respectively.
Results
Measurement Results and Validity Tests
Measurement Results
Figure 1 depicts the index, which shows clear spikes around key events. We display components of the intensity index in the Appendix Figure A.1.

Index of China’s shadow banking regulation intensity.
As shown in Figure 1, China’s shadow banking regulation can be divided into three phases. During the initial phase (Q1 2000–Q4 2008), regulatory authorities adopted a restrained approach.
In the second phase (Q1 2009–Q2 2018), triggered by the launch of the government’s 4-Trillion Yuan Stimulus Plan, banks collaborated with non-bank financial institutions to channel funds to enterprises through regulatory arbitrage (K. Chen et al., 2018). As the rapid, unregulated expansion of shadow banking heightened systemic risks, regulatory authorities enacted prompt corrective policies to fill regulatory gaps. Consequently, the regulatory intensity index increased, its mean being 7.11, and reached its peak (17.18) in Q2 2017.
In the third phase (Q3 2018–Q4 2020), the scale of shadow banking decreased, and the regulation intensity diminished correspondingly. Shadow banking innovations became minor. For example, the commercial banks competed for funding by providing higher interests for “structured deposits,” but is soon prohibited. Authorities have conducted regulatory reviews to rectify irregularities.
Validation Tests
Our analysis reveals that the trend of the intensity index is consistent with critical time points and stylized facts in regulatory practice. In the validity test, we further test if the direct economic consequences are in line with expectations and if it is comparable with similar indicators.
Whether the Direct Economic Consequences of Regulations Conform to Expectations
Existing literature agrees that shadow banking regulatory policies effectively restrain the expansion of the shadow banking system. The validity of the regulatory policy intensity indicator would be supported if the expected results are obtained. Figure 2 demonstrates an inverse relationship between the regulatory index and shadow banking growth rates (correlation coefficient = −.5412). This finding aligns with our expectations.
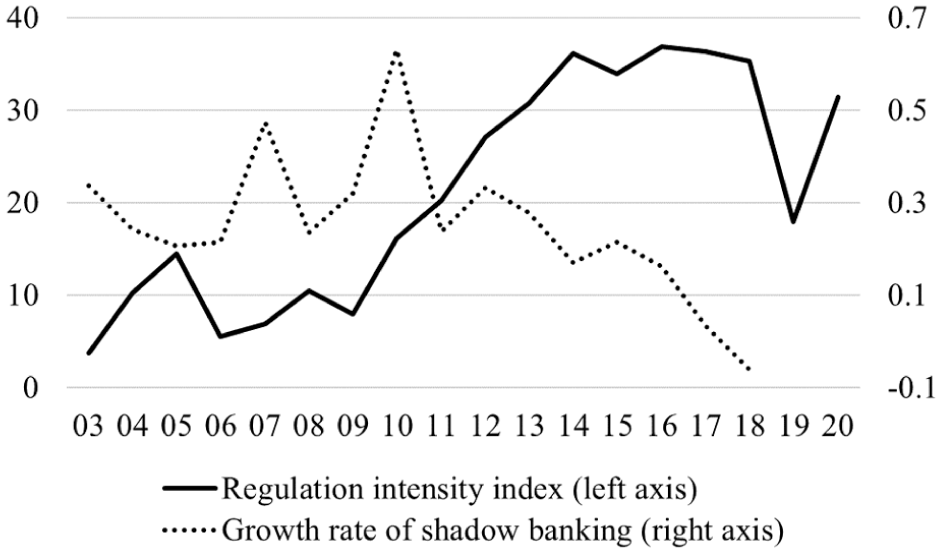
The intensity index and growth rate of shadow banking in China.
Whether the Index We Construct is Comparable With Similar Indicators
As discussed previously, there are few quantitative indicators of shadow banking regulatory policies. In this paper, we construct a policy guidance indicator and make comparison with our intensity index. Positive correlation of the two implies the validity of the intensity index. The policy guidance index is measured as the frequency of speeches, publications, and news releases containing shadow banking-related content published by regulatory officials. As shown in Figure 3, our index and the policy guidance indicator exhibit a generally aligned trend (correlation coefficient = .46).

The intensity index and the policy guidance index.
Main Regression
Table 3 displays results of empirical model (2) with different bank risk measures, including credit risk, earnings risk, and liquidity risk. The p value of the Sargan test is greater than .1, which cannot reject the null hypothesis that the instruments are exogenous, rejecting over-identification problem. From the p value of the Arellano-Bond test, the residual term has no autocorrelation, which satisfies the requirements of GMM estimation. We include a second lag when dependent variables are LLP, sdROA and LR. This adjustment is made as the Arellano-Bond test reveals second-order serial correlation in the error terms when incorporating solely their first lag. Overall, all regressions pass the Sargan test, AR(1) and AR(2) test, confirming the validity of the instrumental variables selected in this study and justifying the use of system GMM estimation.
Shadow Banking Regulation and Bank Risks.

Note. ***, **, and * represent significance at the 1, 5, and 10% levels, respectively. Standard errors are in parentheses. Y refers to the dependent variable of each column. L.Y and L2.Y denote lagged dependent variables by one and two periods respectively.
Panel A shows that shadow banking regulation and credit risk are positively correlated, consistent with hypothesis H1. As implied by the estimated coefficients, when the index increases by one standard deviation, NPL increases 0.0807 (0.1246 × 0.648) percentage points, 4.89% (0.1246 × 0.648/1.65) of its mean value and LLP increases 0.0590 (0.0912 × 0.648) percentage points, 5.37% (0.09 × 0.648/1.1) of its mean value. Although the percentage change in LLP relative to its mean is larger than that in NPL, the absolute change in LLP is smaller than that in NPL, meaning that banks actively respond to potential defaults by raising the level of provision, but the response is insufficient to cover all exposures. It corroborates our hypothesis that shadow banking regulation forces banks to bring off-balance-sheet shadow banking items onto the balance sheet, which typically carry higher risk than non-shadow loans. Hence, shadow banking regulation exposes banks’ credit risk inherent in banks’ operations. Faced with tightened regulation, banks make more loan loss provisions in case of future uncertainty and foreseeable loss (Ng et al., 2020). Panel B shows that bank profitability is negatively correlated with regulation intensity, consistent with H2. However, earnings stability is not significantly altered. Confronted with stricter shadow banking regulation, banks cut off profitable shadow banking businesses and witness decline in profitability. Overall, shadow banking regulation amplifies banks’ earnings risk. Panel C reveals a pronounced positive correlation between shadow banking regulation and bank liquidity. In other words, it reveals that strengthening regulation decreases bank liquidity risk, which complies partly with H3’. This observation implies that banks proactively manage their liquidity positions and set higher liquidity targets when faced with elevated regulations, thus mitigating a rise in liquidity risk. This phenomenon results from a reduction in moral hazard incentives and enhancements in banks’ risk management practices. In summary, these results align with our hypotheses, indicating shadow banking regulation may have altered banks’ trade-offs among risks, with a higher weight on liquidity risk than credit risk.
Discussions of Endogeneity
In the baseline regression model, we address potential endogeneity bias using system GMM estimator. This approach addresses endogeneity by estimating an instrumental regression for the first-difference equation and level equation. To further mitigate the endogeneity problem, we apply two more methods as follows.
Add Control Variables
The positive association between shadow banking regulation and bank risks may be attributable to an omitted variable capturing the magnitude of shadow banking activities. As shadow banking operations expand, the banking sector may accumulate substantial latent risks, potentially prompting financial authorities to implement more stringent regulatory frameworks. We re-estimate the baseline regression by adding a control variable representing overall shadow banking scale (SBTA), measured by the aggregate scale of shadow banking to total assets of the banking industry (Sun, 2019).
The estimation results are presented in Table 4. The influence of shadow banking regulation intensity on the risk indicators remains consistent with the main results. This evidence indicates our estimates are not subject to endogeneity bias.
Endogenous Analysis: Add Control Variables.

Notes. ***, **, and * represent significance at the 1, 5, and 10% levels, respectively. Standard errors are in parentheses. Y refers to the dependent variable of each column. L.Y and L2.Y denote lagged dependent variables by one and two periods respectively. Note that we include a second lag in the regressions for LLP, sdROA, and LR to ensure all specification tests pass.
Placebo Tests
We conduct placebo tests following Berger et al. (2022). We construct a “pseudo” regulatory intensity index by substituting Reg_z with Reg_z (Composite) values randomly sampled from the distribution of Reg_z. Insignificant coefficients would confirm that our findings are driven by “real” regulation intensity.
We estimate regression coefficients using 100 random samples of Reg_z (Composite) and report the average coefficient estimates and the result of Sargan and Arellano-Bond tests. Table 5 shows that Reg_z (Composite) is not significant and small in magnitude, hence, our finding is not driven by endogenous bias.
Endogenous Analysis: Placebo Test.
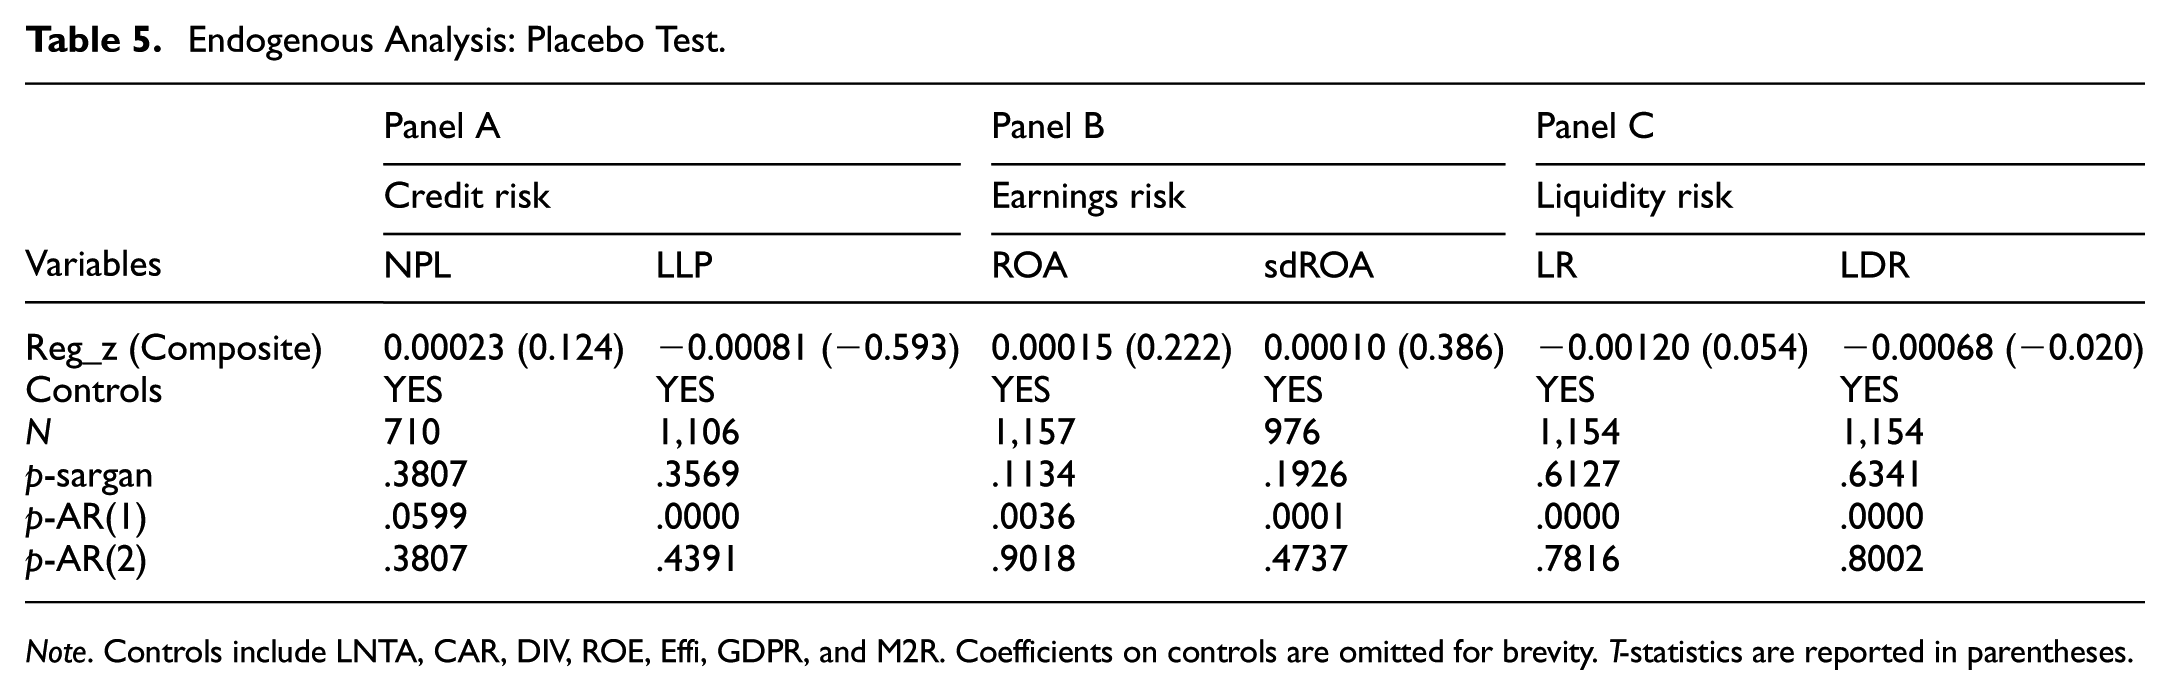
Note. Controls include LNTA, CAR, DIV, ROE, Effi, GDPR, and M2R. Coefficients on controls are omitted for brevity. T-statistics are reported in parentheses.
Mechanism Analysis
We perform additional analysis to reveal the mechanisms behind the correlations between shadow banking regulation and bank risks. As mentioned in Section 3, after regulators enhance intensity, banks’ shadow banking business is forced to be discontinued and part of the business is returned to the on-balance-sheet loan account, which exposes banks’ multidimensional risks. As a result, if shadow banking business shrinks after elevated regulation, then the aforementioned channel can be supported.
To examine this channel, we employ an empirical analysis to check whether shadow banking regulation can impact banks’ shadow banking business. Following Zhu et al. (2016) and K. Chen et al. (2018), we use the ratio of reverse repos, securities borrowed & cash collateral (RSCR) and the ratio of receivables investment (RR) to measure on-balance-sheet shadow banking business.
As shown in Table 6, the marginal tightening of shadow banking regulation is associated with a contraction in the size of shadow banking operations. The coefficient of Reg_z on RSCR is −0.4284 at the 5% significance level, and the coefficient on RR is −2.4679 at the 1% significance level. It suggests that when regulatory intensity increases by one standard deviation, the RSCR decreases by 0.2776 (0.4284 × 0.648), accounting for about 6.26% (0.4284 × 0.648/4.43) of its average value, and the RR will decrease by 1.5991 (2.4679 × 0.648), about 10.70% (2.4679 × 0.648/14.94) of its average value. The result aligns with findings documented by Y. Peng et al. (2023), which reveals a negative correlation between shadow banking regulation and on-balance-sheet shadow banking business. Additionally, our results demonstrate both statistical and economic significance. The significant reduction in on-balance-sheet shadow banking business because banks suspend the shadow banking business, or they are forced to reclassify existing shadow banking activities as on-balance-sheet loan assets faced with regulatory pressure.
Regulation and Shadow Banking Intensity.

Note. *** and ** represent significance at the 1 and 5% levels, respectively. Standard errors are in parentheses. Y refers to the dependent variable of each column. L.Y and L2.Y denote lagged dependent variables by one and two periods respectively. Note that we include a second lag in the regression for RR to ensure all specification tests pass.
Robustness Analyses
Alternative Model Specification
In the main regression (Section 5.2), we treat the lag of dependent variable and regulation intensity index as endogenous variables. In this section, following the approaches of Ghosh (2015), Conlon et al. (2020) and Zhao and Xu (2021), we consider the possibility that several bank-level control variables are endogenous or predetermined. Bank size (LNTA) is designated as a predetermined variable because banks make risk decisions based on their size, which in turn affects their risks. Capital adequacy ratio (CAR), earning diversity (DIV), profitability (ROE) and bank efficiency (Effi) are set as endogenous variables because these bank-level variables are likely to be jointly determined with bank risks. To address endogeneity, we use lagged levels of endogenous and predetermined variable as instruments for first difference equation and lagged first-differenced variables mentioned above as the instruments for level equation. For macroeconomic control variables, the growth rates of both GDP (GDPR) and money supply (M2R) are set as exogenous variables.
It’s worth noting that as we set more endogenous variables, the number of instruments grows, which may lead to biases in two-step standard errors and other issues. To address this concern, we follow Roodman (2009) to collapse instruments to reduce the instrument count. We employ system GMM approach with collapsing instruments and present results in Table 7. System GMM estimates pass various specification tests, including the Sargan test, AR(1) test, and the AR(2) test. As is shown in Table 7, our baseline regression results remain robust under this alternative model specification.
Shadow Banking Regulation and Bank Risks.

Note. ***, **, and * represent significance at the 1, 5, and 10% levels, respectively. Standard errors are in parentheses. Y refers to the dependent variable of each column. L.Y and L2.Y denote lagged dependent variables by one and two periods respectively. Note that we include a second lag in the regressions for LLP, sdROA, and LR to ensure all specification tests pass.
Removing the Observations before 2010 and after 2020
We limit the sample period to 2010 onward, which excludes the period when Chinese state-owned banks removed non-performing loans from balance sheets under the government’s guidance. To address the effects by the unanticipated COVID-19 pandemic, we drop observations in 2020. The results are displayed in Table 8 and confirm our main findings.
Regressions Using Sub-Sample Data.
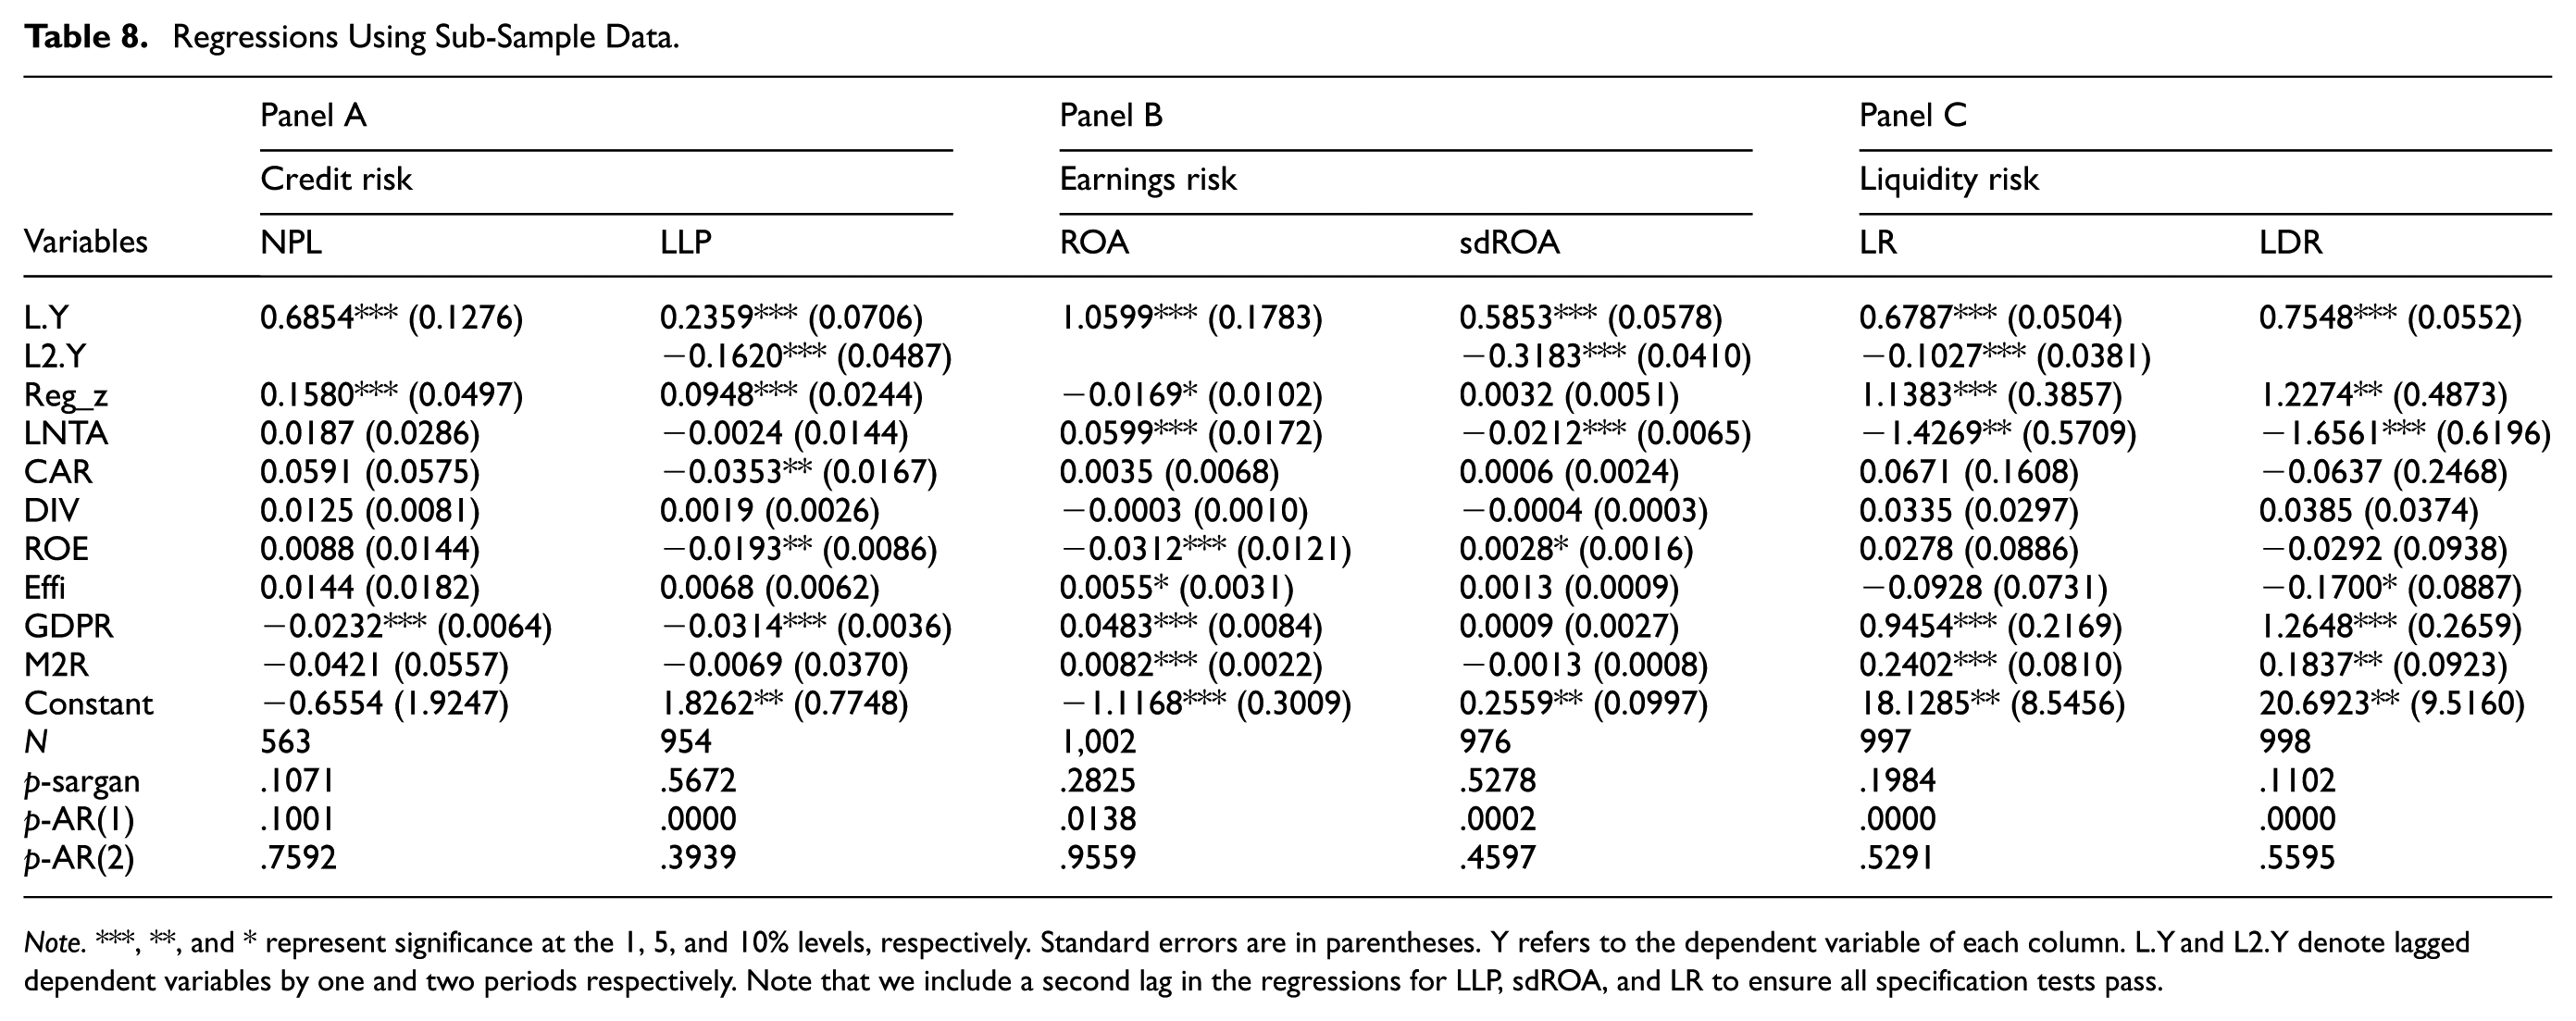
Note.***, **, and * represent significance at the 1, 5, and 10% levels, respectively. Standard errors are in parentheses. Y refers to the dependent variable of each column. L.Y and L2.Y denote lagged dependent variables by one and two periods respectively. Note that we include a second lag in the regressions for LLP, sdROA, and LR to ensure all specification tests pass.
Alternative Measure of Regulation Intensity
The number of regulatory policy documents can serve as proxy for regulatory intensity (Pan & Wei, 2015). We rerun the main regression using this alternative measure. The results presented in Table 9 corroborate our baseline results.
Alternative Measure of Regulation Intensity.

Note. ***, **, and * represent significance at the 1, 5, and 10% levels, respectively. Standard errors are in parentheses. Y refers to the dependent variable of each column. L.Y and L2.Y denote lagged dependent variables by one and two periods respectively. Note that we include a second lag in the regressions for LLP, sdROA, and LR to ensure all specification tests pass.
Alternative Estimation Methods
Existing studies estimate dynamic panel models employing either system GMM or difference GMM. System GMM estimates the first-differenced and level equations simultaneously as a system. Compared to difference GMM, system GMM estimators can enhance estimation efficiency and allow for the estimation of coefficients of variables that do not vary with time. Additionally, we employ the difference GMM model to re-evaluate the empirical results. As illustrated in Table 10, results remain consistent with baseline results.
Using Difference GMM Model.
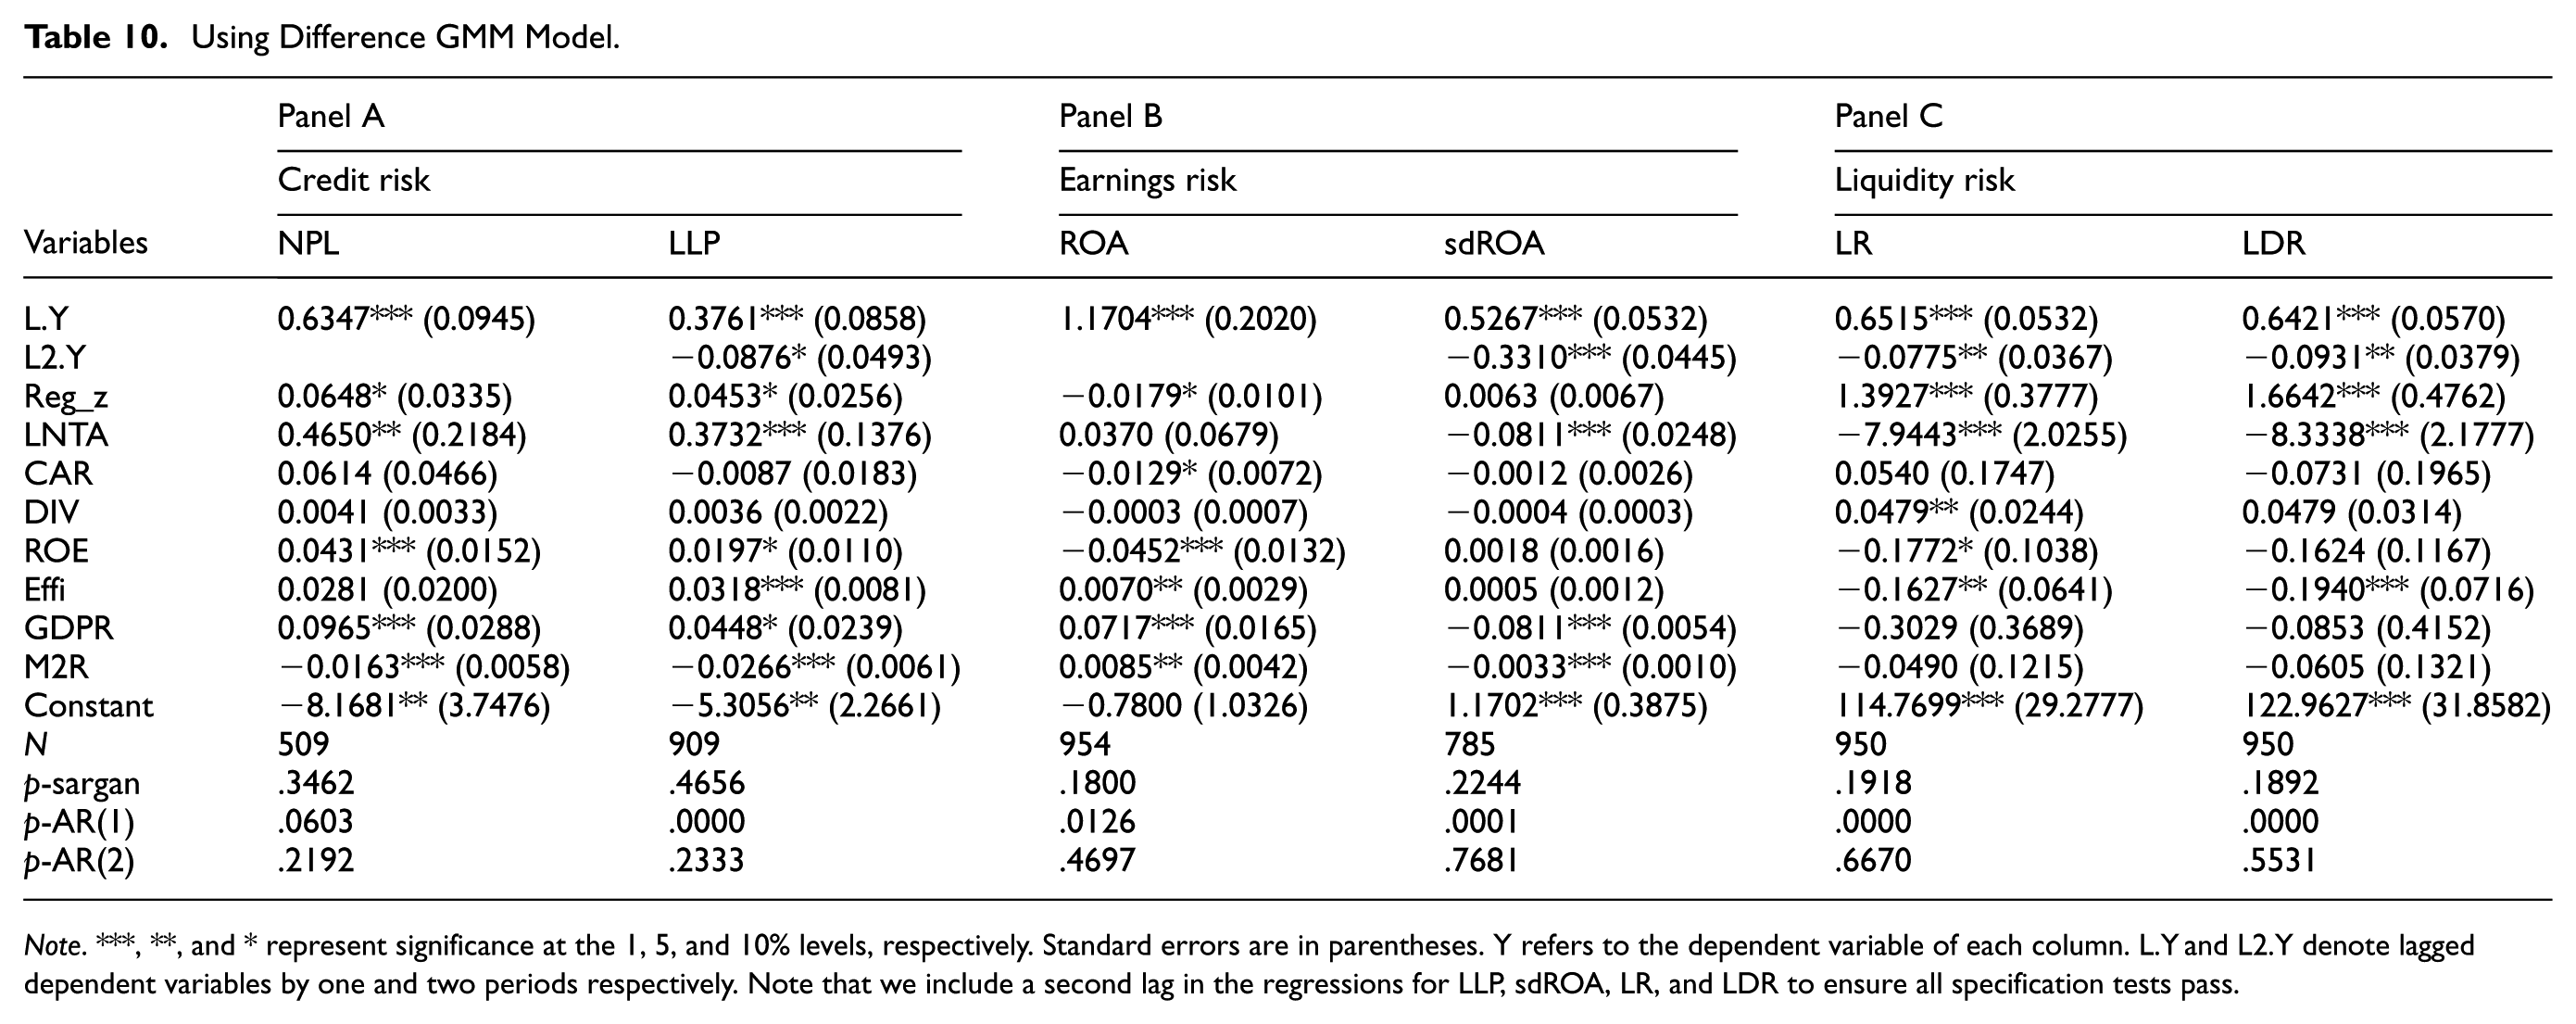
Note. ***, **, and * represent significance at the 1, 5, and 10% levels, respectively. Standard errors are in parentheses. Y refers to the dependent variable of each column. L.Y and L2.Y denote lagged dependent variables by one and two periods respectively. Note that we include a second lag in the regressions for LLP, sdROA, LR, and LDR to ensure all specification tests pass.
Further Test: Discussion About Coordination Between Shadow Banking Regulation and Monetary Conditions
This section tests whether expansionary monetary conditions can attenuate the economic costs of shadow banking regulation. We perform the analysis by interacting the index and the growth rate of money supply (Reg_z_M2R). As shown in Table 11, with favorable monetary conditions, banks actively increase their loan loss reserves to respond to potential defaults (Panel A) and suffer fewer declines in profitability levels (Panel B). To sum up, expansionary monetary policy can alleviate adverse costs brought by strengthening regulations. Conversely, tightening monetary policy further escalates the economic costs of strong regulations on banks. This finding highlights the importance of financial and monetary policy coordination, consistent with the view that monetary policy should be adjusted to consider banking regulation and financial stability (Huang et al., 2012; International Monetary Fund, 2015).
Shadow Banking Regulation, Monetary Policy, and Bank Risks.
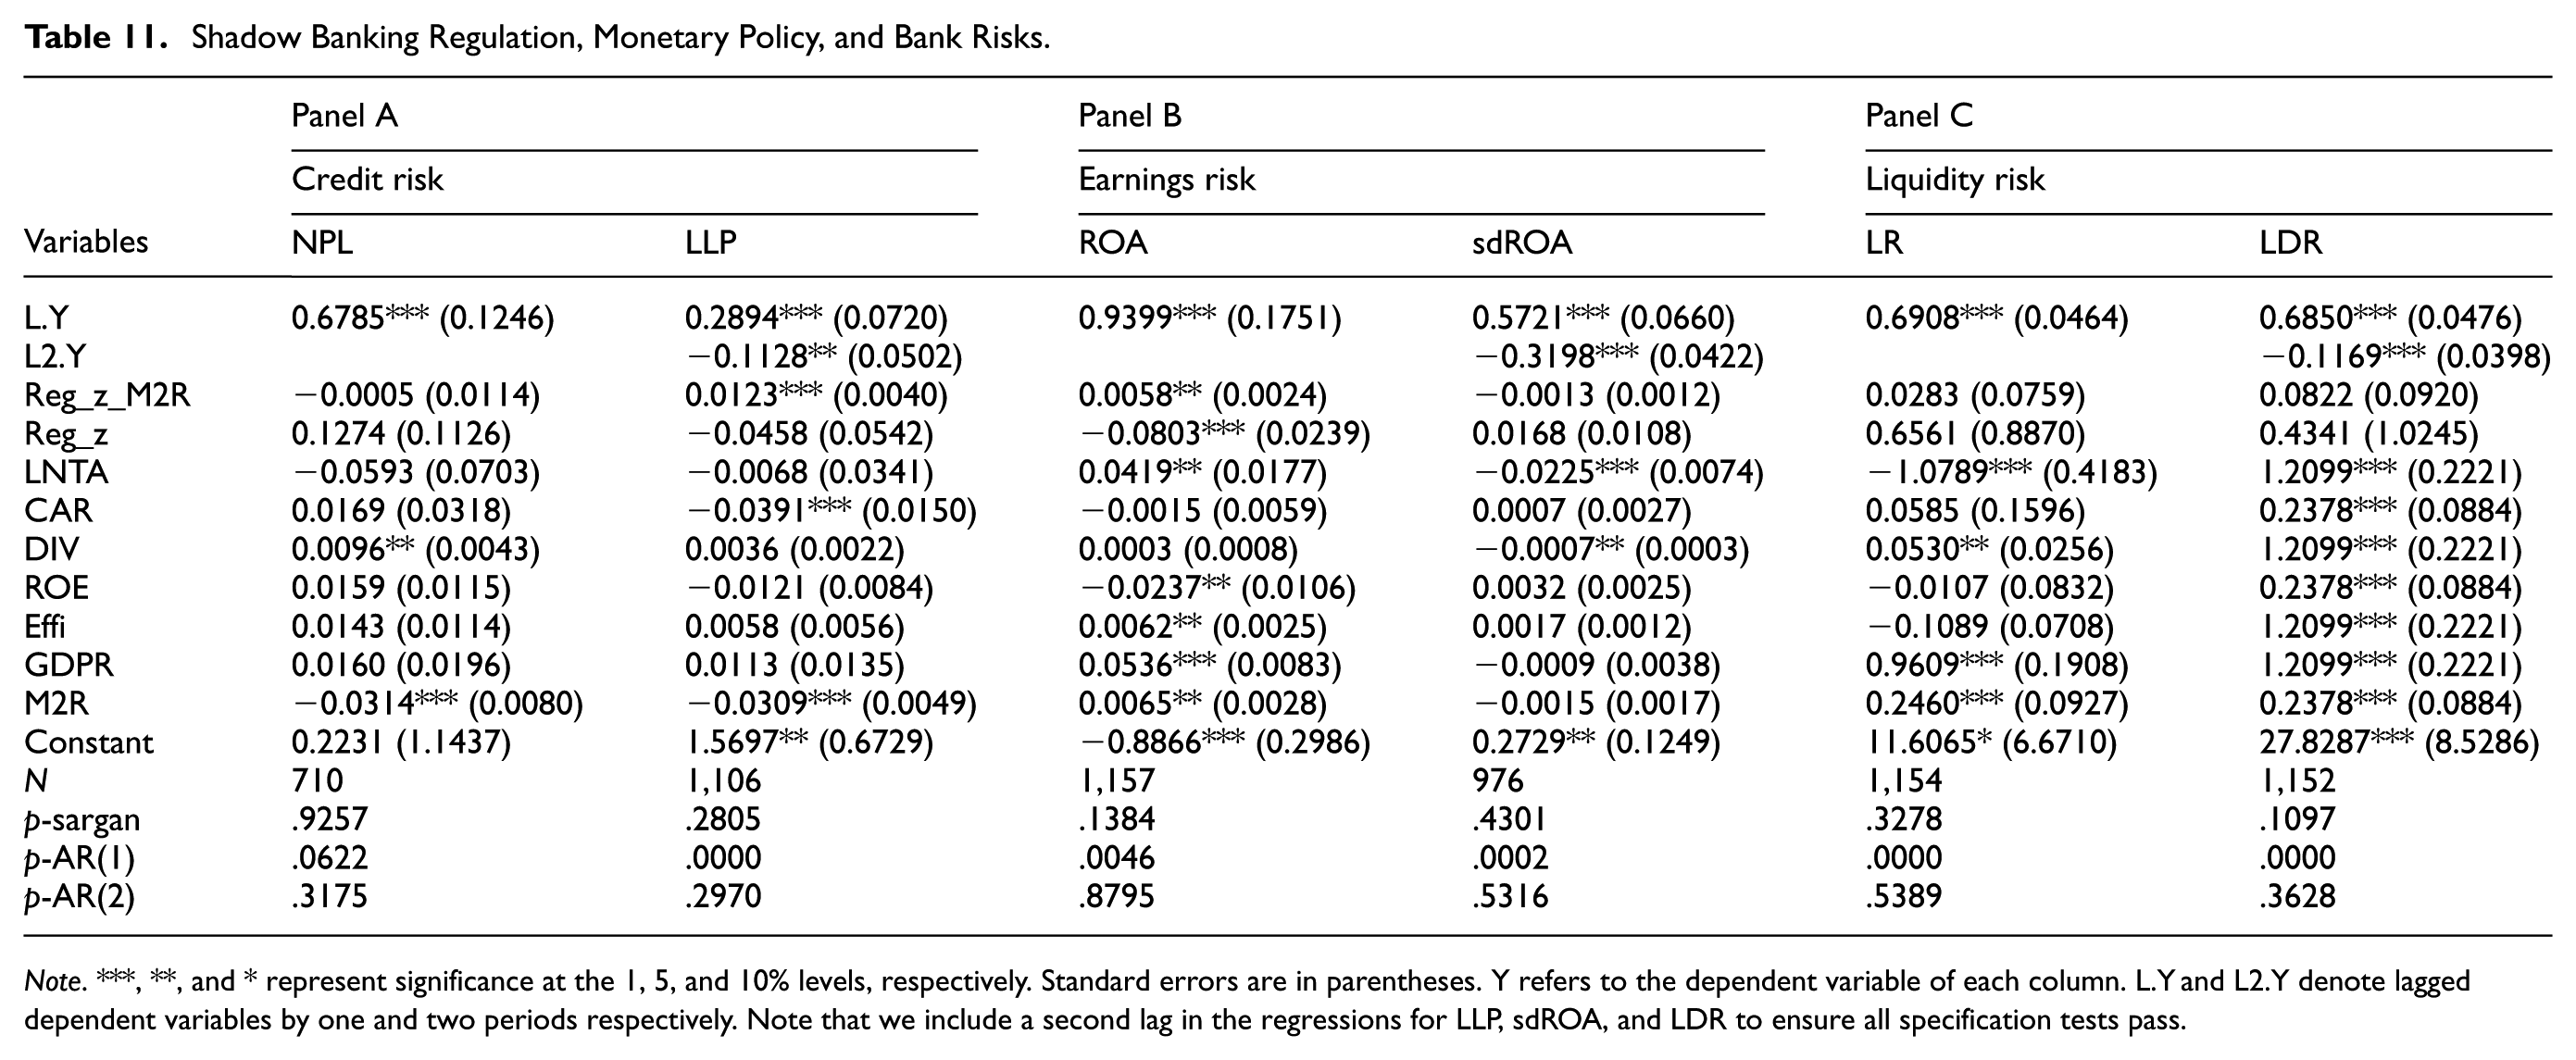
Note. ***, **, and * represent significance at the 1, 5, and 10% levels, respectively. Standard errors are in parentheses. Y refers to the dependent variable of each column. L.Y and L2.Y denote lagged dependent variables by one and two periods respectively. Note that we include a second lag in the regressions for LLP, sdROA, and LDR to ensure all specification tests pass.
Conclusions
We construct an index measuring China’s shadow banking regulation and perform bank-level analysis to assess how bank risks are influenced. From a methodological perspective, we show how to use official documents to develop the new index of interest to financial economists and policy makers.
The sample for empirical analysis covers 181 commercial banks from 2007 to 2020. Using our index, we perform empirical analysis, investigating the impact of shadow banking regulation on banks’ multidimensional risks and underlying channels. In addition, we analyze whether monetary conditions counteract these influences.
Our main findings are as follows: First, strengthening regulations has lifted banks’ risk and boosted their motivation for active risk management. On the one hand, strengthening regulations increase banks’ exposure to credit and profit risks. On the other hand, intensified regulation also increases banks’ loan loss provisions and decreases their liquidity risk. This implies the bright side that banks are incentivized to cover potential loan defaults and significantly increase the allocation of liquid assets to reduce the possibility of liquidity dry-up. In this regard, enhanced shadow banking regulation generates certain economic costs and imposes a short-term operational burden on the banking sector.
Second, we confirm the influencing channel: shadow banking regulation pushes the shadow banking business to downsize or forces the banking sector to shift some shadow banking business back to on-balance sheet accounts. This further validates the effectiveness of regulatory policy. Shadow banking regulation imposes a short-term operational burden on the banking industry, and is objectively unavoidable.
Finally, the impact of shadow banking regulation varies across monetary environments. During periods of expansionary monetary policy, the economic costs of stringent regulations are lower, and banks would be better positioned to cover credit and earnings risk exposure and vice versa. In other words, the combination of tighter regulation and expansionary monetary policy can mitigate the negative impact on the banking sector.
Thus, this study has policy implications. Regulatory authorities need to be aware of economic costs and to balance financial market stability and banking sector development. Regulatory policies should be issued and appropriately implemented and better coordinated with monetary policies to avoid amplifying risks in the banking industry.
Although the Shadow Banking Regulation Intensity Index developed in this study constitutes an innovative and systematic effort to quantify regulatory stringency, it still has several limitations. First, the index is designed to capture regulatory tightening and may be less sensitive to regulatory easing. Additionally, it does not account for regulatory policies that were subsequently repealed or superseded. Second, our analysis focuses on credit, earnings, and liquidity risk dimensions, leaving other bank-related risks (such as systemic and operational risk) unexamined.
Future studies could constructively address these limitations in several directions. For instance, the index methodology could be refined to capture not only regulatory tightening but also easing episodes, and incorporate subsequent policy abolishment and replacement. Additionally, researchers could incorporate systemic and operational risks, and examine how shadow-banking regulations interact with other regulatory tools, thereby providing a more comprehensive view of banks’ risk profiles under different policy mixes. Another promising direction is to apply our text-based regulatory index approach to other countries and adapt the index to different institutional contexts. Studies in these directions would provide policymakers with deeper insights into how to balance regulatory stringency and financial stability across various contexts.
Footnotes
Appendix A
The Description of Variables and the Sources of Data.

| Variable | Definition | Data source |
|---|---|---|
| Risk measures | ||
| NPL | Ratio of non-performing loans over total loans | BankFocus Database |
| LLP | Ratio of loan loss provisions over total loans | BankFocus Database |
| ROA | Return on assets | BankFocus Database |
| sdROA | Standard deviation of ROA over the next 3 years | BankFocus Database |
| LR | Ratio of liquid assets over total assets | BankFocus Database |
| LDR | Ratio of liquid assets over total deposits and short-term funding | BankFocus Database |
| Regulation intensity index | ||
| Reg_z | Z-score normalized shadow banking regulation intensity | Calculated by the authors |
| Bank-level control variables | ||
| LNTA | Natural logarithm of total assets | BankFocus Database |
| CAR | Ratio of tier-1 and tier-2 assets over risk-weighted assets | BankFocus Database |
| DIV | Ratio of non-interest income over total income | BankFocus Database |
| ROE | Return on equity | BankFocus Database |
| Effi | Ratio of non-interest expenses over revenues | BankFocus Database |
| RSCR | Ratio of reverse repos, securities borrowed & cash collateral over total assets | BankFocus Database |
| RR | Ratio of receivables investment over total assets | BankFocus Database |
| Macroeconomic control variables | ||
| GDPR | Growth rate of GDP | National Bureau of Statistics of China |
| M2R | Growth rate of money supply | National Bureau of Statistics of China |
| SBTA | The overall scale of banks’ shadows in China divided by the total assets of the banking sector | Calculated by the authors according to Sun (2019) |
Acknowledgements
The authors would like to express their gratitude to Professor Xiaoneng Zhu from Shanghai University of Finance and Economics and Dr. Yuandong Mu from Beijing Foreign Studies University for their insightful comments and directions on this paper. The author is grateful to the anonymous referees of the journal for their extremely useful suggestions to improve the quality of the article.
Author Note
The views expressed in the paper are those of the authors and may not reflect those of the People’s Bank of China.
Ethical Considerations
This article does not contain any studies with human or animal participants, and informed consent is not required.
Funding
The authors disclosed receipt of the following financial support for the research, authorship, and/or publication of this article: Sha Sun acknowledges support from the Ministry of Education Youth Project in Humanities and Social Sciences (grant number: 23YJC790118), National Natural Science Foundation of China (NSFC) General Program (grant number: 72473012), Beijing Foreign Studies University’s double first-class major signature research “Study on Global Indices 2025” (grant number: 2025SYLZD002) and Beijing Foreign Studies University’s “COVID-19 Epidemic” double first-class special research project “Research on the mechanism and effectiveness of consumer voucher policy under the impact of epidemic” (grant number: SYL2020ZX015). Ruihui Xu acknowledges support from China Postdoctoral Science Foundation Project “Dynamic Analysis of China’s Shadow Banking under Strict Regulation: Structural Evolution and Risk Transmission Mechanisms” (grant number: 2018M630244).
Declaration of Conflicting Interests
The authors declared no potential conflicts of interest with respect to the research, authorship, and/or publication of this article.
Data Availability Statement
The raw data supporting the conclusions of this article will be made available by the authors, without undue reservation.