
Abstract
This study investigates return spillovers among the 15 most capitalized cryptocurrencies during the Russia-Ukraine war and the COVID-19 pandemic. Data were extracted from the Coin Market Cap database to ensure a comprehensive analysis of market behavior, covering a daily series from January 2020 to December 2023. The research employs three autoregressive techniques (TVP-VAR, LASSO VAR, and Ridge VAR) to verify the robustness of findings regarding market fragility influenced by non-economic shocks. The study identifies extensive return spillovers primarily driven by Bitcoin and Ethereum, with considerable influences from Cardano, Litecoin, and Polkadot. The results show Ethereum as a primary spillover transmitter in the cryptocurrency market, taking that position formerly held by Bitcoin. Despite the speculative nature of cryptocurrencies, there is potential for diversification through two stablecoins, Tether and USD Coin, which exhibit limited spillover effects from other cryptocurrencies and negative correlations with one another. As a stablecoin, DAI served as a potential diversifier during the COVID-19 pandemic but not during the Ukraine war. The study offers practical insights for investors on managing crypto portfolios during geopolitical and global health crises and the strategic use of stablecoins. Societally, the study examines the need for enhanced regulatory frameworks to reduce systemic risks in the highly interconnected cryptocurrency market.
Introduction
Since the inception of Bitcoin (BTC hereafter) in 2009, there has been an ongoing debate regarding the potential to serve as a hedge against traditional assets. Characterized by its volatility, the crypto market has been the subject of intense investigation and attraction. The crypto industry simultaneously presents both unique profit opportunities and inherent risks (Field & Inci, 2023; Gemici et al., 2023; Le et al., 2023; Theiri et al., 202389). The COVID-19 pandemic and the Russia-Ukraine introduced unprecedented uncertainties into global financial markets. The crises tested the resilience of both traditional and digital assets, raising concerns about the vulnerability of global financial stability (Peng et al., 2023). Driven by the limitations of conventional safe haven instruments, investors are increasingly turning to alternative financial securities. Cryptocurrencies introduced a new paradigm for financial transactions independent of central bank control. The crypto market urged extensive discussions on their intrinsic value and stability compared to stocks, bonds, and other financial instruments (Dimpfl & Elshiaty, 2021; Dutta et al., 2023; Geuder et al., 2019; Gowda & Chakravorty, 2021). Distinguishing financial securities as diversifiers, hedges, or safe havens is essential for developing effective investment strategies. This classification helps investors understand how different assets can diminish portfolio risk during various financial shocks. Unlike other altcoins, Bitcoin (BTC) has maintained its leading position in the crypto industry. Its rapid market growth emphasizes its importance in the crypto environment, challenging the hedging effectiveness of conventional assets (Paule-Vianez et al., 2020; Yang et al., 2022). BTC’s evolving role beyond just an alternative investment has become a strategic tool in risk management. According to Yang et al. (2022), BTC’s distinct characteristics and low correlation with traditional financial instruments offer an innovative approach to diversification. Meanwhile, Paule-Vianez et al. (2020) highlight its increased relevance and protective attributes during distress times, noting its potential to act as a buffer against market volatility. This dual functionality emphasizes BTC’s growing importance in investment strategies and asset allocation.
Investing in cryptocurrencies is highly volatile and speculative. Unlike traditional stock investments, cryptocurrencies do not offer ownership rights, dividends, or claims on corporate profits; their value is mainly determined by market demand and supply. Price volatility in the crypto market is significant and influenced by speculative trading and market sentiment. As a result, investors cannot rely on traditional fundamental analysis but often use technical analysis, which focuses on price patterns and trading volumes. Given the lack of underlying financial data, cryptocurrency investments should be considered risky. The potential for high returns drives investors, but they must be aware of the possibility of losing their entire investment. Investors should be aware of the speculative nature of cryptocurrencies, as their value can potentially decrease to zero.
The crypto evolution is characterized by rapid developments, particularly during global shocks like the COVID-19 pandemic. This period increased investment risks and transformed the financial environment, requiring a reassessment of investment strategies. The growing interest in cryptocurrencies has led to extensive research, mainly related to the stablecoins and Central Bank Digital Currencies-CBDCs (Adhami & Guegan, 2020; Goodell et al., 2023; Y. Wang et al., 2022). The detailed examination of cryptocurrencies has enhanced our understanding of their regulatory challenges and technological advantages. This exploration has expanded discussions about cryptocurrency privacy and security. The research by Choi (2021), Doan et al. (2022), Moosa (2020), and Sun et al. (2023) analyzed the impact of social media platforms on the price discovery and efficiency of the cryptocurrency market. This context has led to investigations into investor behavior, mainly focusing on herding behavior, where investors may prioritize collective decision-making over rational judgment. The herding behavior concept suggests a deviation from the Efficient Market Hypothesis (EMH), indicating that assets may be mispriced due to investor panic and euphoria (Ah Mand et al., 2023; Teraji, 2003). Recent studies (Ah Mand et al., 2023; Aslam et al., 2023; Souza & Carvalho, 2023) indicate that despite cryptocurrency volatility, there is a shift toward greater market efficiency. Currently, there is mixed evidence regarding herding behavior. Some studies suggest its presence during uncertain times, while others identify actions that counter herding tendencies (Bouri et al., 2019; Gurdgiev & O'Loughlin, 2020; King & Koutmos, 2021; Raimundo Júnior et al., 2022). The Russia-Ukraine war demonstrated how political and military events can affect the herd behavior of crypto investors (Le et al., 2023). The conflict introduced high uncertainty and growth in cryptocurrency-related information, as seen with the Ukrainian government’s appeal for cryptocurrency funding (The Economist, 2022). This event demonstrated the intricate dynamics of the cryptocurrency market, including how external factors influence investor behavior and market trends. The Ukrainian government’s use of digital currencies enabled instant financial transactions, avoiding banking delays. This situation highlights their evolving role and benefits in delivering financial support when traditional methods fail.
The COVID-19 pandemic once again emphasized the strong interconnectedness of the global financial system. The World Health Organization (WHO) declared COVID-19 a global pandemic in March 2020, urging governments worldwide to implement strict measures. These measures, although necessary, led to a heightened global economic uncertainty, impacting the banking, insurance, and equity markets (Goodell et al., 2023; Nguyen et al., 2022; Sarkodie et al., 2022; Singh & Neog, 2020). The pandemic increased academic interest in cryptocurrencies due to their distinctive blockchain characteristics and diversification capabilities. Sarkodie et al. (2022) examined the evolving relationship between cryptocurrencies and traditional financial assets, further investigating their interconnectedness during crises. Their findings showed that cryptocurrencies are significantly affected by global COVID-19 death rates and tend to rebound during economic shocks, advising investors to diversify mainly during recovery phases. The pandemic’s impact on cryptocurrencies showed diverse effects. Despite their inherent volatility and initial price declines, cryptocurrencies like BTC experienced a considerable rise in value as investors turned to alternative assets during financial uncertainty (Yen & Ha, 2023). This shift emphasized the potential role of cryptocurrencies as safe havens. However, the evidence remained mixed; some studies argued their hedging capabilities against extreme market conditions, while others challenged this view.
The ongoing Russia-Ukraine war has heightened global instability, highlighting the intricate dynamics of geopolitical tensions. The European energy market has substantially changed due to the war, moving from heavy reliance on Russian natural gas to liquefied natural gas-LNG (Flanagan et al., 2022; Zettelmeyer et al., 2022). The shift toward LNG has helped the European economies maintain their energy security despite the cut-off from Russian gas. However, in the meantime, this led to increased competition and higher prices in the global LNG market. The market’s reaction to this war provided new insights into cryptocurrency behavior during crises. Moreover, it offered a comparative view of their performance and evolving role as alternative investments. Khalfaoui et al. (2023) found that cryptocurrency values are greatly influenced by public attention to geopolitical events, with co-movements between war attention and returns varying by market state. Their findings indicate that price fluctuations are caused by crypto investors seeking liquidity and responding to war-related news. However, significant price drops are often caused by sell-offs from large cryptocurrency holders, commonly referred to as crypto whales. Numerous studies indicate that gold serves as an effective safe haven during crises, with its hedging capabilities surpassing those of Bitcoin (Choudhury et al., 2022; Conlon & McGee, 2020; Feng et al., 2018; Ghorbel et al., 2022; Ghorbel & Jeribi, 2021; Kliber et al., 2019; Salisu et al., 2021; Z. Wang et al., 2023). The war’s impact on the global economy, food security, and geopolitics has been influential, while there is mixed evidence regarding its direct influence on the crypto market, mainly Bitcoin (Appiah-Otoo, 2023; Boubaker et al., 2022; Boungou & Yatié, 2022; Pereira et al., 2022). Several studies have highlighted BTC’s hedging capabilities against financial turmoil, suggesting that including BTC in a portfolio could lead to considerable gains and improve risk-adjusted returns (He et al., 2024; Cheng & Yen, 2020; Kalyvas et al., 2020; Mokni et al., 2022; Nuhiu et al., 2023; Paule-Vianez et al., 2020; Xu & Kinkyo, 2023). Their findings indicate that BTC can act as a hedge against various uncertainties, such as global financial crises and significant market fluctuations. The hedging features of BTC are especially evident during economic turbulence and a lack of trust in traditional financial systems. Its decentralized nature, independence from government control, and low transaction fees make it an attractive solution for both hedging and as a safe-haven asset. However, it is necessary to acknowledge BTC’s speculative characteristics and high volatility make it a challenging option for stable hedging.
The relationship between market shocks, investor behavior, and cryptocurrency dynamics is essential for participants in the crypto market. This study seeks to explore the interconnectedness within the crypto market, specifically in response to major non-economic shocks. Unlike other studies, our focus is on the return connectedness of cryptocurrencies rather than their volatility. The rationale for this approach is explained as follows. First, the crypto market is mainly driven by individual investors rather than professionals. This indicates that their positions are primarily influenced by price movements (returns) rather than volatility issues. The situation may differ in regulated markets, where institutional investors dominate the market. It is difficult to believe that crypto participants base their decisions on volatility metrics. Several studies confirm that crypto participants possess financial literacy (Fujiki, 2021; Gignac et al., 2023; Panos et al., 2020). A survey of 1,000 respondents from the U.S., Mexico, and Brazil found that 98% of investors lack basic knowledge of cryptocurrencies yet still invest in them (Yahoo Finance, 2021). Another study by Toluna, a leading global research and insights provider on smarter data-driven decisions, reveals that 60% of respondents do not clearly understand how the crypto market operates (Finbold, 2022). Second, the lack of intrinsic value prevents crypto holders from setting reservation prices. Investors in this industry closely monitor crowd movements, making their ecosystem highly interconnected. The COVID-19 pandemic outbreak caused participants to liquidate their positions. Figure 2 demonstrates the shock to the crypto industry, with Bitcoin and Ethereum losing 45.9% and 51.4% of their market value, respectively. Measures implemented by national governments during the COVID-19 pandemic heightened job insecurity, revealing a clear need for liquidity. During these uncertain times, there was a decreased willingness to invest in risky securities, and interest in cryptocurrencies diminished. Additionally, the war in Ukraine posed a considerable setback for cryptocurrencies, threatening their viability. During this period, BTC reached its lowest level of $16,000. Rising electricity prices were an additional concern that made mining operations difficult. Exceptions are made by three stablecoins, USDC, TETH, and DAI, which resist external events because their market values are pegged to the U.S. dollar.
The study contributes to the literature on cryptocurrency interconnectedness by investigating the impacts of significant non-economic shocks—the COVID-19 pandemic and the Russia-Ukraine war. Unlike previous research focusing solely on market efficiency or volatility, our study analyzes return spillovers among major cryptocurrencies using robust autoregressive models. The research examines the role of stablecoins, like Tether and USD Coin, which have been less explored in prior studies, by evaluating their potential as diversifiers in cryptocurrency portfolios during market stress. The findings provide valuable insights for investors looking to integrate cryptocurrencies into diversified portfolios amid global uncertainties, challenging existing views on their stability and speculative nature during crises. The research informs future regulatory discussions and investor strategies to mitigate the inherent risks of these digital assets. Considering the purpose of the study, two related research questions arise:
RQ1: How do the return spillovers among the 15 most capitalized cryptocurrencies vary in response to the Russia-Ukraine war and the COVID-19 pandemic?
RQ2: What role do stablecoins play in reducing return spillovers among the 15 cryptocurrencies during the two non-economic shocks?
The remainder of the paper is organized as follows: Section 2 reviews the literature, while Section 3 explains the methodology and data description. Section 4 presents the findings and discusses their implications for crypto portfolio holders. Meanwhile, Section 5 concludes with a summary of the main findings, the study’s limitations, and suggestions for future research.
Literature Review
This literature review examines the evolving dynamics of the cryptocurrency market, focusing on the complexities of return spillovers and market behavior both before and during the non-economic shocks. It highlights the mechanisms driving return spillovers and explores current and relevant research to clarify how these digital assets interact under both stable and stressed conditions.
Crypto Market Prior to Non-economic Shocks
Before the COVID-19 pandemic and the Russia-Ukraine war, the cryptocurrency market experienced considerable growth, increased investor interest, and regulatory oversight. In the years leading up to these events, the cryptocurrency market transformed from a niche interest into a global financial phenomenon characterized by a substantial increase in market capitalization and trading volumes. Bitcoin was increasingly seen as “digital gold,” providing a hedge against economic uncertainty. Corbet et al. (2018) indicate that Bitcoin’s growth resulted from broader market acceptance, regulatory clarifications, and institutional investment, which stabilized its value. Conversely, Ethereum, the second-largest cryptocurrency, has grown significantly due to its smart contract capabilities, stimulating the development of decentralized applications (dApps). Cong and He (2019) emphasized that Ethereum’s adoption surged because of its flexible blockchain platform, attracting many projects in the decentralized finance (DeFi) sector. According to research data by Smith and Crown (2019), the total market capitalization of cryptocurrencies experienced a compound annual growth rate of over 48% from 2016 to 2019. This period also experienced a considerable increase in Initial Coin Offerings (ICOs), with investors contributing billions of dollars into new crypto ventures (Benedetti & Kostovetsky, 2018).
The pre-pandemic era also witnessed a considerable shift in the demographics of crypto investors. Research by Aalborg et al. (2019) indicates a transition from a predominantly tech-savvy investor base to a more diverse group that included institutional participants. This shift was partly driven by blockchain technology advancements, which improved transaction speeds and security, making these platforms more attractive to traditional investors. Additionally, regulatory frameworks began to emerge as governments and financial authorities worldwide recognized the permanence and influence of cryptocurrencies in the financial sector. Wu and Pandey (2020) explained how different regulatory frameworks across various jurisdictions impacted investor participation and market stability. Volatility remained a defining characteristic of the crypto market. However, its appeal as a non-correlated asset class drew hedge funds and private equity firms seeking high returns and diversification benefits. Research by Gandal et al. (2020) indicates that despite its notorious price fluctuations, Bitcoin has experienced periods of reduced volatility when institutional interest has increased, suggesting a maturing market capable of attracting more conservative financial entities. Moreover, technological innovations, such as the rise of stablecoins and the expansion of decentralized finance (DeFi) platforms, played an essential role in redefining the crypto investment environment. These developments addressed substantial concerns regarding the volatility and usability of cryptocurrencies. Catalini and Gans (2021) emphasized that stablecoins have emerged to address the price fluctuations commonly associated with traditional cryptocurrencies. Pegging stablecoins to reliable assets such as the U.S. dollar enhances their use in day-to-day transactions and protects against fiat currency inflation. This overview of the pre-shock period helps understand the structural and market dynamics changes caused by subsequent non-economic shocks.
Crypto Market During Non-economic Shocks
COVID-19 has intensified interest in cryptocurrencies, not just as speculative investments but also as possible diversifiers. During this period, there was a substantial shift toward digitalization in various sectors, as many individuals and businesses increasingly adopted digital payment methods (Neves et al., 2023; Xia et al., 2022). Fears of economic uncertainty and inflation caused by government stimulus packages drove investors to look for alternative stores of value. This trend has increased interest in cryptocurrencies like BTC and Ethereum, which are seen as potential hedges against inflation. The growing acceptance among financial institutions demonstrates this, especially with introducing a new range of cryptocurrencies (Lacity, 2022). Studies by Asiri et al. (2023), Ha (2023), and Raza et al. (2022) examined the interconnectedness and volatility of cryptocurrencies during the COVID-19 pandemic, emphasizing their roles as both receivers and transmitters of market shocks. Their research demonstrates how cryptocurrencies react to global economic shocks, indicating their evolving role in the financial ecosystem. On the other hand, studies by Frikha et al. (2023) and Nuhiu et al. (2023) explored the benefits of incorporating cryptocurrencies into investment portfolios, particularly for diversification during the COVID-19 pandemic. Moreover, Taera et al. (2023) and Lamine et al. (2023) investigated the volatility and persistence of external shocks, indicating that BTC showed effective signals as safe haven instrument. Research by Kayral et al. (2023) found that before COVID-19, both Bitcoin and gold were effective hedges against G7 stock indices, but their roles changed during the pandemic, and the Russia-Ukraine war. Their findings emphasized the significance of including BTC and gold in financial portfolios, especially during market downturns. Maghyereh and Al-Shboul (2024) found that, in general, cryptocurrencies displayed weak efficiency during the pandemic, with varying efficiency levels observed among different coins. The inefficiency was more noticeable during the COVID-19 outbreak than during the Russia-Ukraine conflict. However, Ethereum and Ripple demonstrated strong resilience. Moreover, Przyłuska-Schmitt et al. (2023) observed volatile price fluctuations in Bitcoin and Ethereum, questioning their stability as stores of value compared to gold. Mnif et al. (2023) found that energy-conserving cryptocurrencies reacted negatively to the pandemic but positively during the Russia-Ukraine war. Their findings indicate that while energy-conserving cryptocurrencies do not fully serve as a safe haven, they provide some diversification benefits.
The Russia-Ukraine war has complicated the global financial landscape, leading to investigations into the impact of geopolitical tensions on the cryptocurrency market. It offers a new perspective on how cryptocurrencies behave during crises compared to traditional safe-haven assets like gold. Studies by Abdullah (2023), Appiah-Otoo (2023), and Mgadmi et al. (2023) examined the causal relationships between stock indices and cryptocurrencies and the direct impacts of war on Bitcoin’s trading volume. Their findings indicate that cryptocurrencies can serve as both hedging instruments and safe havens during geopolitical crises; however, their effectiveness varies depending on the context. Concurrently, studies by Kumar et al. (2023), Mgadmi et al. (2023), and Ustaoglu (2023) investigated the volatility and risk spillover in commodity, stock, and crypto markets, identifying considerable disruptions and fluctuations. Kumar et al. (2023) used the TVP-VAR model to examine the interconnectedness of commodities, cryptocurrencies, and G20 capital markets. Their results found substantial connections between the COVID-19 pandemic and the Russian-Ukraine war, characterized by increased portfolio weights and shifts in investment strategies. Furthermore, Mgadmi et al. (2023) and Ustaoglu (2023) examined the short-term effects of stock market fluctuations on cryptocurrencies, comparing gold’s effectiveness as a hedging and safe-haven asset with Bitcoin. Their findings emphasized gold’s stability and hedging strength during wartime. A study by Hampl et al. (2024) indicated that while traditional cryptocurrencies like Bitcoin and Ethereum showed weak safe-haven properties for commodities, they showed strong performance against Forex. Furthermore, Theiri et al. (2023) studied the effect of the Russia-Ukraine war on Bitcoin (BTC) and Ethereum’s liquidity, finding a notable but temporary increase showing that cryptocurrencies respond more to short-term market fluctuations than long-term trends.
In a broader context, Bajra and Aliu (2023) explored spillover volatility among financial instruments, including Bitcoin and Ethereum, during the COVID-19 pandemic and the war in Ukraine. Their findings show that Bitcoin significantly impacts equity stocks, emphasizing its growing importance in global financial markets and its influence on speculative and conventional instruments. Furthermore, Aliu et al. (2022) investigated the risk-return trade-offs of combining cryptocurrencies with traditional assets. They found that adding cryptocurrencies to diversified portfolios can reduce overall risk significantly, noting that stocks can lower the risk of crypto assets by 36%. This supports the idea that cryptocurrencies provide valuable diversification benefits. Their results highlight that gold generally outperforms Bitcoin (BTC) in stability and performance while suggesting that cryptocurrencies can serve as alternative assets in times of market turmoil. However, evidence regarding their effectiveness as safe havens or hedges against traditional market downturns remains mixed. The interconnectedness between cryptocurrencies and financial markets suggests that cryptocurrencies should not be viewed in isolation. The two consecutive shocks clearly demonstrated that various economic and geopolitical factors influenced their performance.
Return Spillovers in Crypto Market
Understanding return spillovers within the crypto market is essential for examining the complex interrelations and systemic risks that define this asset class. Return spillovers occur when price movements in one cryptocurrency significantly affect the prices of others, potentially leading to domino effects across the market. A study by Diebold and Yılmaz (2014) introduced a methodology to measure connectedness in financial markets, which subsequent studies adapted for the cryptocurrency context. Their framework analyzes the dynamic spillover effects among cryptocurrencies by identifying the transmitters and receivers of market shocks. Applying this model, Antonakakis et al. (2019) found that Bitcoin and Ethereum are the most influential cryptocurrencies, acting as major transmission hubs for spillover effects and emphasizing their crucial roles in the market. Similarly, Koutmos (2018) demonstrated how shocks to Bitcoin can lead to significant price adjustments in smaller altcoins, suggesting a hierarchical structure within the crypto market where major cryptocurrencies dictate market trends. This hierarchical influence became particularly evident during periods of high market volatility, as documented by Corbet et al. (2018), who investigated the contagion effects among cryptocurrencies during turbulent times. The rise of stablecoins and their increasing importance in the crypto ecosystem have introduced new dynamics to return spillovers. Research by Baur and Hoang (2020) indicates that stablecoins like Tether (USDT) exhibit lower return spillovers than traditional cryptocurrencies, suggesting their potential role as safe havens or diversifiers during market stress. The implications of these findings are significant, especially regarding portfolio management and regulatory perspectives. Understanding the directional intensities of return spillovers helps investors manage risks and optimize the diversification benefits of crypto assets. From a regulatory perspective, recognizing these spillover effects is essential for developing frameworks to mitigate systemic risks inherent in this highly interconnected market.
The literature review emphasized the growing importance of cryptocurrencies in global financial markets, particularly during times of widespread uncertainty. Our research aims further to explore the complex role of cryptocurrencies in crises. We investigate how external factors, such as geopolitical tensions and pandemic-related uncertainties, influence the behavior of crypto investors. By building on the existing literature, we aim to clarify the role of cryptocurrencies in portfolio diversification. This study is intended exclusively for investors who incorporate cryptocurrencies into their portfolios. To achieve this, we focus solely on the portfolio benefits derived from a combination of the 15 most highly capitalized cryptocurrencies.
Methodology
Our study investigates the problem by combining three autoregressive models. Subsection 3.1 describes the time-varying parameter vector autoregressions (TVP-VAR) model, while Subsection 3.2 covers LASSO and Ridge-VAR models.
Time-Varying Parameter Vector Autoregressions (TVP-VAR)
The Time-Varying Parameter Vector Autoregressions (TVP-VAR) was performed based on work by Antonakakis et al. (2020). The Elastic Net and its restricted models are generally named LASSO and Ridge VAR connectedness approach. The TVP-VAR improved model by Antonakakis et al. (2020) rests on the original work by Diebold and Yilmaz (2009, 2012) and Diebold and Yılmaz (2014). The improved process does not need to determine the number of rolling windows arbitrarily. At the same time, it overcomes the issue of observation loss, as no rolling-window computations are involved. The proposed technique enables the variance to vary through multivariate Kalman filters and is less sensitive to outliers. Antonakakis et al. (2020) improved the existing technique through the following steps: (i) outliers do not affect the stability of the model, (ii) there is no need to set an arbitrary rolling window, and (iii) the observations do not lose during connectedness calculations. Earlier improvements on the TVP-VAR have been made by Gabauer and Gupta (2018) and Antonakakis et al. (2018). However, the standard TVP-VAR model is specified as follows:


With

Where
The generalized impulse response function (GIRF) and forecast error variance decomposition (GFEVD) approach of Diebold and Yılmaz (2014) transform into vector moving average (VMA) considering the Wold theorem, defined in the following equation:


With
The
The GIRF indicates the response of variable j generated from the shocks in variable i. On the other hand, GFEVD computes the pairwise directional connectedness from j to i, highlighting the influence of one variable on the other. All the system variables must explain 100% forecast error variance i. The model is a flexible tool to investigate possible changes in the time variation of the series changes of shocks generated from one variable to others in the system and vice versa. To verify the series for unit root, we performed Augmented Dickey-Fuller (ADF), Phillips-Perron (P.P.), and Kwiatkowski-Phillips-Schmidt-Shin (KPSS) tests. The results suggest that our logarithmic return series is stationary across all cases.
LASSO and Ridge Vector Autoregressions
The LASSO and Ridge Vector Autoregressions were conducted according to Gabauer et al. (2020). The Appendix shows all the R studio codes, tests, plots, and other procedures. The following techniques verify how robust the TVP-VAR estimates are. Both methods’ frameworks allow dynamic forecasting and analyzing of shocks via impulse response and forecast error variance decomposition. Mathematically, the methods stand on the Diebold and Yılmaz (2014) connectedness approach formulated as follows:

Where
Data and Descriptive Statistics
The fifteen largest cryptocurrencies were selected from the Coin Market Cap database based on market capitalization, considering criteria such as trading volume and market longevity (Coin Market Cap Database [CMC], 2024). We focused on the period from January 2020 to December 2023 to capture the impacts of these two non-economic shocks. Daily data capture day-to-day volatility while effectively minimizing noise from higher-frequency data. For data cleaning, several steps were taken to ensure dataset quality. Missing values were addressed using linear interpolation for minor gaps, while days with significant missing data were excluded. We identified outliers through statistical analysis, determining whether they resulted from market events or data errors. Logarithmic returns were employed to stabilize variance and normalize price movements. Throughout this process, we performed consistency checks against the original Coin Market Cap data and cross-referenced with secondary sources for reliability.
Table 1 presents summary statistics for the 15 largest cryptocurrencies during the study period. The mean logarithmic returns are near zero, while the standard deviation ranges from 0.03 to 0.06. The highest standard deviation appears in SOL (0.06), followed by XRP (0.05), LINK (0.05), and MATIC (0.05). The median values, predominantly at 0.00, imply that over half of the daily logarithmic returns were neither significantly positive nor negative. The minimum and maximum values demonstrate the wide-ranging fluctuations, likely influenced by the war-related news and investor sentiment. The skewness varies across the selected cryptocurrencies, indicating heavy tails and the presence of outliers. The series under investigation are negatively skewed except for TETH, XRP, and MATIC. Higher kurtosis values in the case of TETH, XRP, USDC, and DAI document extreme returns than a normal distribution. The XRP and CARD demonstrate normal distribution characteristics with skewness close to zero and kurtosis not far from three. The two-sided goodness-of-fit test, such as the Jarque–Bera (J.B.) test, verifies the lack of symmetry with a p-value less than 0.05. The unit root tests (ADF, P.P., and KPSS) show that our daily logarithm return series are stationary at the level (I0). Ljung-Box and Pierce-Box tests verify if a serial correlation exists in our series (see Figure A.4 in the Appendix). Up to two lags, the findings indicate that the residuals are not independently distributed (there is no white noise) except for CARD and USDC.
Descriptive Statistics for the 15 Most Well-Capitalized Cryptocurrencies.

Source. Authors’ elaboration.
Note: The table provides central tendency and dispersion measures based on the daily logarithmic returns for 15 most capitalized cryptocurrencies. The daily series represents the full-time period from January 1, 2020, to December 1, 2023. The measures of central tendency and dispersion stand for the mean, standard deviation (Sd), minimum (Min), Maximum (Max), range, skewness (Skew), and Kurtosis (Kurt). Augmented Dickey-Fuller (ADF) with two lags, Phillips-Perron (P.P.) and Kwiatkowski-Phillips-Schmidt-Shin (KPSS), investigate the unit root issues of the series. The symmetry of the series was analyzed through the Jarque–Bera test (J.B.) while serial correlation with Ljung–Box test and Pierce–Box test conditioned by two lags.
The distribution box plot in Figure 1 shows the daily logarithmic returns based on 1,431 observations. The large number of outliers illustrates the volatile nature of cryptocurrencies compared to traditional financial instruments. The series under study are non-random, and returns are not identically distributed. The interquartile range (IQR) suggests that the middle 50% of the daily logarithmic returns are clustered within a narrow range. Outliers represent days with unusual market movements, likely influenced by news related to wars. It may indicate variations in how the market responds to the war, liquidity levels, or investor sentiment changes.

Distribution plots of daily returns of the 15 most well-capitalized cryptocurrencies.
Figure 2 presents the closing prices for the 15 most capitalized cryptocurrencies. During the initial outbreak of COVID-19, cryptocurrencies experienced a continuous rise, with the prices of Bitcoin, and Ethereum exploding to all-time highs in November 2021, reaching $67,500 and $4,800, respectively. However, they experienced an unprecedented crash a year later, just after the beginning of the Russia-Ukraine war. The war in Ukraine further accelerated energy commodity prices, especially electricity. Most cryptocurrencies rely on a proof-of-work (PoW) consensus mechanism for mining new coins, which raises environmental concerns due to its high electricity consumption. According to the Cambridge Bitcoin Electricity Consumption Index, Bitcoin alone consumes 127 terawatt-hours (TWh) annually, equivalent to Norway’s total electricity consumption (Cambridge Bitcoin Electricity Consumption Index [CBECI], 2024). Ripple (XRP) stands out as the most energy-efficient among the 15 cryptocurrencies examined. Additionally, both XRP and Dogecoin (DOGE) have been less affected by the war in Ukraine and higher electricity prices.

Crypto market trends with closing prices of the 15 most capitalized cryptocurrencies.
Results and Discussions
The results of this study include three sections. In Section 5.1, TVP-VAR, LASSO VAR, and Ridge VAR are analyzed for the period of the Russia-Ukraine war. Section 5.2 treats the period of the COVID-19 pandemic through identical methods. Pairwise connectedness plots are positioned in Section 5.3.
Estimations During the Russia-Ukraine War
This section examines return spillovers during the Russia-Ukraine war from January 1, 2022, to December 1, 2023. The TVP-VAR, LASSO-VAR, and Ridge VAR models were performed to verify how robust the estimations are. The connectedness table related to Ridge-VAR of the Russian-Ukraine war and COVID-19 is in the appendix. TVP-VAR adapts to changing market conditions over time, providing a dynamic view of connectedness; LASSO VAR emphasizes variable selection, enhancing model accuracy by eliminating less significant variables;, and Ridge VAR stabilizes variance in multicollinearity scenarios, ensuring robustness against overfitting. Each model stands on one autoregressive lag (nlag = 1), 10 periods ahead (h = 10), and 200 rolling window (window.size = 200). After being transformed into logarithmic returns, the series pass the stationary tests (ADF, P.P., and KPSS).
Table 2 shows the return connectedness based on TVP-VAR during the Russian-Ukraine war. To-connectedness ranks 103.48% (ETH) and 13.22% (USDC). In short, To-connectedness indicates the return spillover that each input gives to the system. The five cryptocurrencies with the highest spillover are ETH (103.48%), followed by DAI (102.33%), LTC (101.86%), WBTC (100.79%), and BTC (100.62%). It is worth noting that ETH spillover is increasing during this period while the transmission power of BTC is weakening. This result is consistent with the findings of previous research (Antonakakis et al., 2019; Koutmos, 2018) that recognizes Ethereum and Bitcoin as major market influencers. Nevertheless, our findings emphasize Ethereum’s growing importance in the DeFi sector, challenging Bitcoin’s traditional dominance, as noted by Cong and He (2019). Nevertheless, the low interconnectedness of stablecoins like USDC corresponds to Baur and Hoang (2020) findings that stablecoins can serve as safe havens during market turbulence. Over the years, the importance of BTC has faded within the crypto market. The BTC trade volume fell from $178.89 k in January 2021 to $40.82 k in January 2024 (Statista, 2024). This reduction underlines shifting market dynamics and investor preferences, likely due to the promotion of altcoins, evolving investment strategies focusing on diversification, and growing investment in other digital assets.
The return connectedness based on TVP-VAR estimation during the Russia-Ukraine War.

Source. Authors’ elaboration.
Note: This table indicates the TVP-VAR estimations during the Russia-Ukraine war, standing on the fifteen diverse asset classes in the system. The series covers the period from January 1, 2022, to December 1, 2023, with daily logarithmic frequencies. The results were generated using one autoregressive lag (lag = 1), 200 rolling windows, and ten steps ahead (h=10). To-connectedness indicates volatility spillover that variable (i) transmits to others, while From-connectedness signifies spillover effects that variable (i) absorbs from the others in the system. The Net Connectedness shows the difference between To and From-connectedness.
The outbreak of the COVID-19 pandemic and then the war in Ukraine weakened media interest in cryptocurrencies. On the other hand, Net-Connectedness represents the difference between the spillover that specific input absorbs from the system and gives to it. Again, ETH leads with 15.02%, followed by DAI with 14.11%, LTC with 13.76%, WBTC with 12.66%, and BTC with 12.53%. Cryptos with negative Net-connectedness are USDC (−31.77%), TETH (−19.55%), TRON (−19.45%), LINK (−10.77%), and DOGE (−7.41%). Considering the To- and Net-connectedness of USDC, TETH, TRON, LINK, and DOGE gives the impression of room for diversification. These cryptos absorb 84.58% and 45.00% of the system, respectively. The findings are similar to those of Raza et al. (2022) and Asiri et al. (2023), who noted that cryptocurrencies can absorb and transmit market shocks during economic uncertainty, impacting their role in investment portfolios.
Concurrently, USDC (45.00%) and TETH (52.78%) offer room for diversification as they absorb the least spillover (From-Connectedness) and simultaneously give a little to the system (To-connectedness). This shows that USDC and TETH react the least to changes in the system since both are considered stablecoins. Simultaneously, they influence the inputs in the system with limited spillover. The findings are consistent with previous research (Catalini & Gans, 2021; Kumar et al., 2023; Lacity, 2022; Maghyereh & Al-Shboul, 2024), which suggests that stablecoins—pegged to stable assets like the U.S. dollar—provide protection against the inherent price fluctuations of the cryptocurrency market. The inclusion of USDC and TETH within the crypto portfolio can mitigate the diversification risk. Despite being a stablecoin, DAI remains the lead in the spillover influence within the system. The number of steps is reduced to five (h = 5), while the rolling window is reduced to 150 (window.size = 150) to estimate the short-run spillover effect. The short-run estimations for the period of the Russia-Ukraine war are very close to the long-run ones. However, minor differences were identified in specific cryptocurrencies. The robustness check is performed for the three methods simultaneously (TVP, LASSO, and Ridge VAR).
Table 3 presents the findings of LASSO-VAR for the period of the Russia-Ukraine war. Estimates through LASSO-VAR are almost in line with those of TVP-VAR, with some changes in specific cryptos. ETH again dominates the system with To-connectedness at the level of 103.82%. Small changes have occurred in TETH; To-connectedness falls to 22.04% while Net-connectedness reaches −22.52%. The decline in TETH’s connectedness in LASSO-VAR analyses suggests a complex role during market fluctuations. This result corroborates findings by Baur and Hoang (2020), Gandal et al. (2020), and Przyłuska-Schmitt et al. (2023) regarding the potential of stablecoins in reducing market volatility through their stabilizing effects. Another difference in LASSO-VAR estimations compared to TVP-VAR is that USDC stands as a possible diversifier. To-connectedness remains at 13%, while From-connectedness drops from 45.00% (TVP-VAR) to 23.91% (LASSO-VAR), indicating less influence from other cryptocurrencies on USDC. This reduced sensitivity to market fluctuations shows that USDC maintains stability in volatile conditions, reinforcing its role as a risk management tool in diversified crypto portfolios.
The return connectedness based on LASSO VAR estimations during Russia Ukraine War.

Source. Authors’ elaboration.
Note: This table indicates the LASSO-VAR estimations during the Russia-Ukraine war, standing on the fifteen diverse asset classes in the system. The series covers the period from January 1, 2022, to December 1, 2023, with daily logarithmic frequencies. The results were generated using one autoregressive lag (lag = 1), 200 rolling windows, and ten steps ahead (h=10). To-connectedness indicates volatility spillover that variable (i) transmits to others, while From-connectedness signifies spillover effects that variable (i) absorbs from the others in the system. The Net Connectedness shows the difference between To and From-connectedness.
Table A.1 in the Appendix contains the Ridge-VAR connectedness during the same period under investigation. Connectedness outcomes from Ridge-VAR confirm practically those of LASSO and TVP-VAR. In summary, three methods indicate that the crypto ecosystem is still highly interconnected.
Estimations During the COVID-19 Pandemic
This section highlights TVP-VAR, LASSO-VAR, and Ridge-VAR findings based on daily logarithmic returns. The series represents the outbreak of the COVID-19 pandemic from January 1, 2020, to December 1, 2021. Estimated models stand on one autoregressive lag (lag = 1), 200 rolling windows, and 10 steps ahead (h = 10). Although with different origins, the war in Ukraine and COVID-19 shocked the global financial system. The first resulted from a military invasion in an independent state, while the second was in response to the SARS-CoV-2 virus. The Russian invasion of Ukraine gained the media’s attention, while COVID-19 was no longer a priority. During these consecutive shocks, the narrative surrounding cryptocurrencies started to lose its influence.
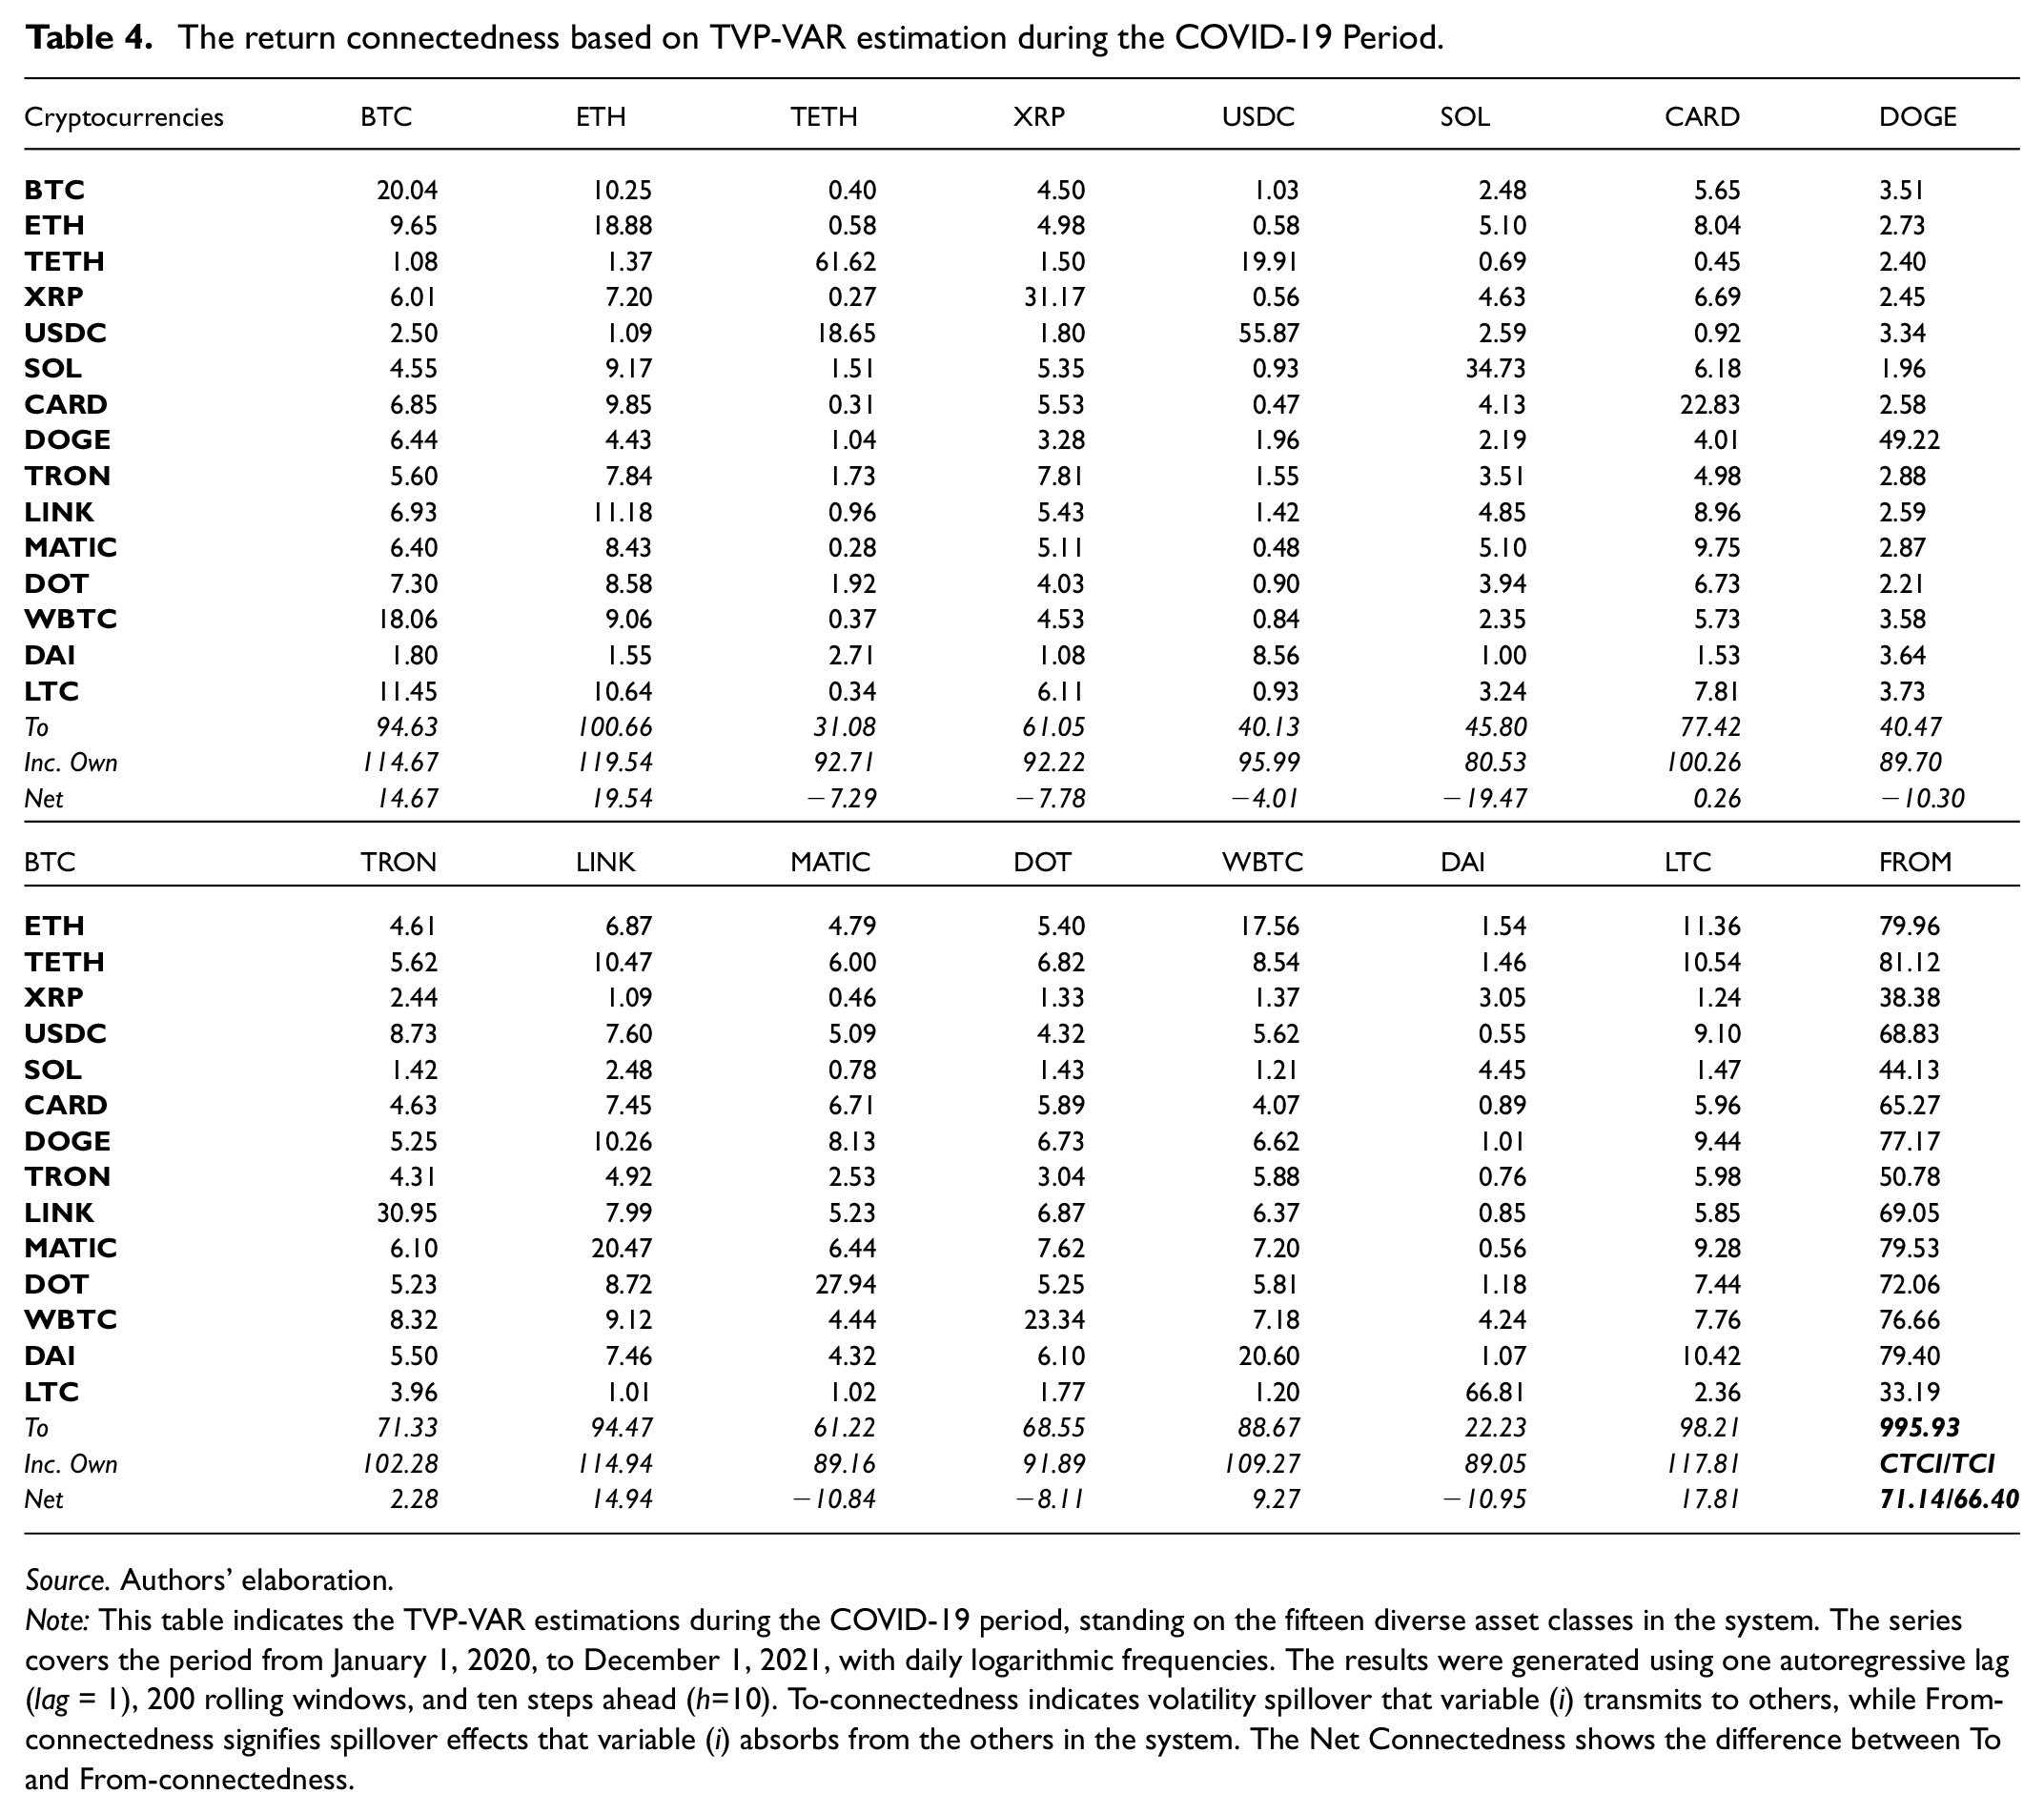
Table 4 presents TVP-VAR results during the COVID-19 pandemic. ETH again leads to connectedness with 100.66%, followed by BTC with 94.63%, LTC with 98.21%, and LINK with 94.47%. Cryptos with the least return spillover are DAI at 22.23%, TETH at 31.08%, and USDC at 40.13%. Compared to the Russia-Ukraine war, the spillover weight of USDC increased from 13.55% to 40.13%, while DAI decreased from 92.15% to 22.23%. These dynamics are further contextualized by the findings of Asiri et al. (2023) and Raza et al. (2022), which explore how different cryptocurrencies react to global shocks. Our findings emphasize Ethereum and Litecoin’s strong performance during the pandemic, which emphasizes their growing acceptance among investors seeking alternatives to traditional financial assets in times of market volatility. Connectedness with ETH justifies that its tokens reside on the ETH blockchain. The diversification effects of TETH and USDC are documented by the fact that their autoregressive lags affect 55.44% and 76.09% of price changes, respectively. The crypto instruments that generate the highest spillover among themselves are ETH, BTC, LINK, and WBTC (this applies to the two periods under study). Practitioners should consider that keeping them in a single portfolio could raise diversification risk.
The return connectedness based on TVP-VAR estimation during the COVID-19 Period.
Source. Authors’ elaboration.
Note: This table indicates the TVP-VAR estimations during the COVID-19 period, standing on the fifteen diverse asset classes in the system. The series covers the period from January 1, 2020, to December 1, 2021, with daily logarithmic frequencies. The results were generated using one autoregressive lag (lag = 1), 200 rolling windows, and ten steps ahead (h=10). To-connectedness indicates volatility spillover that variable (i) transmits to others, while From-connectedness signifies spillover effects that variable (i) absorbs from the others in the system. The Net Connectedness shows the difference between To and From-connectedness.
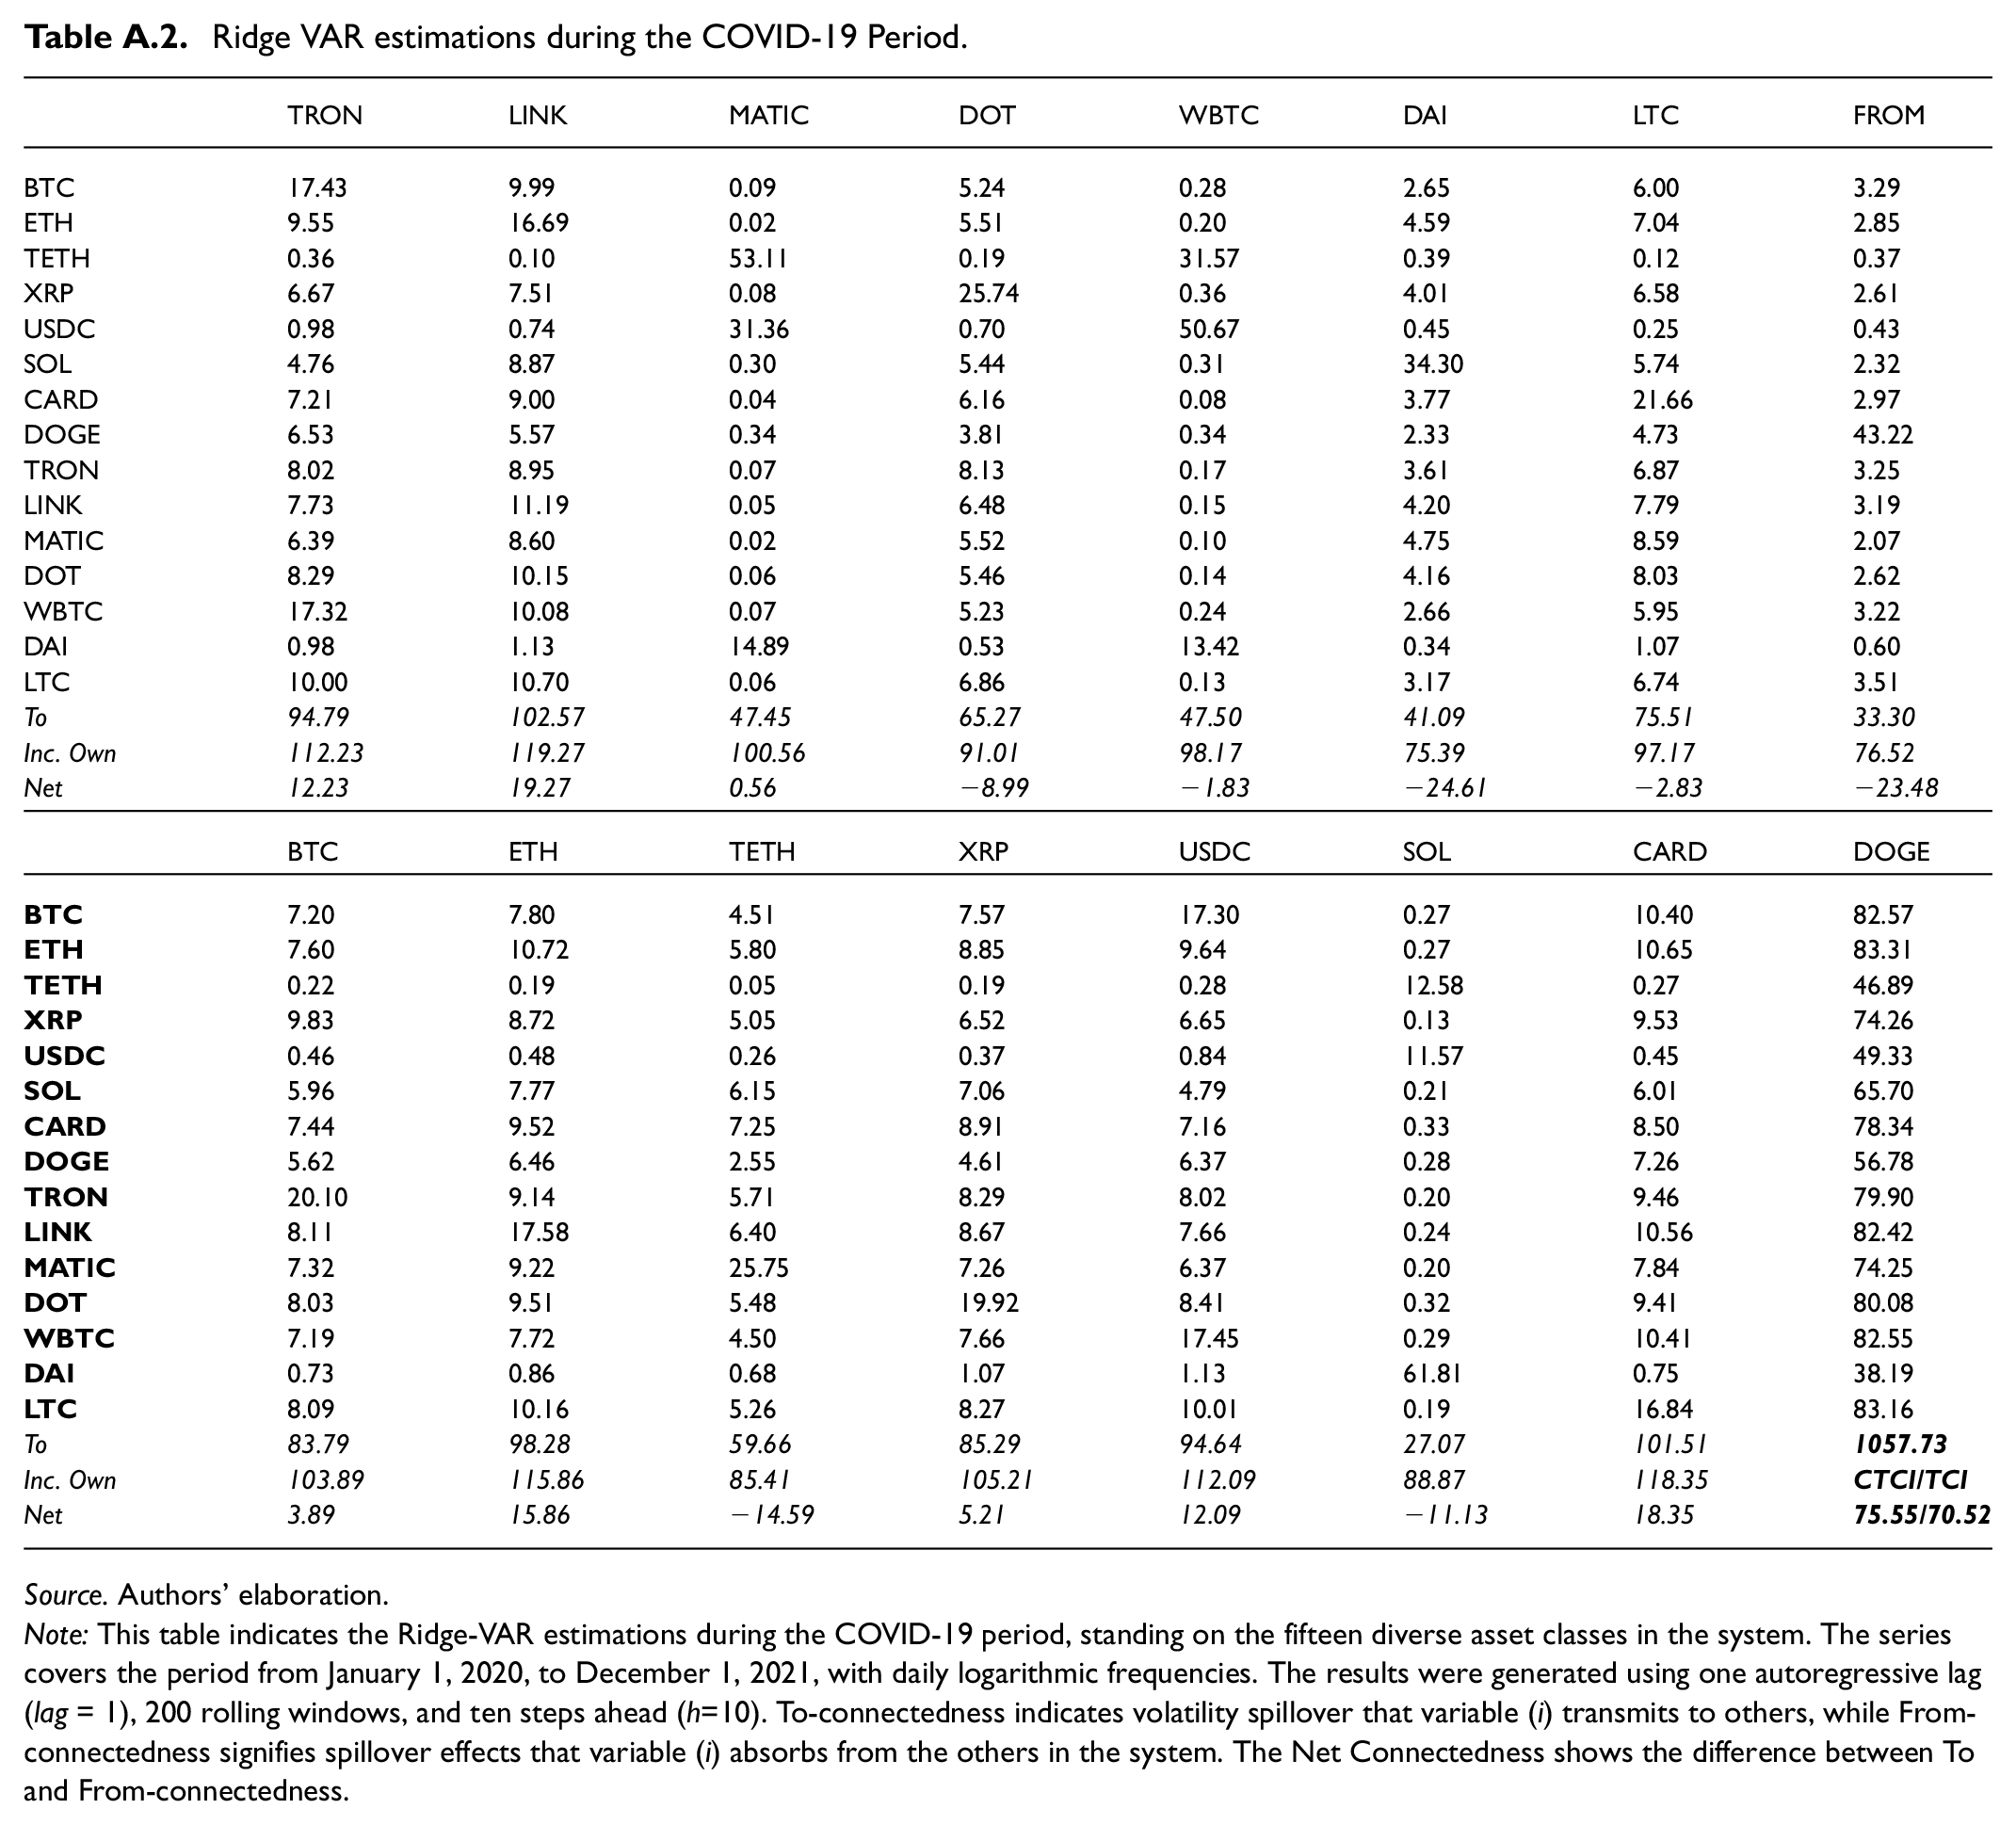
The LASSO-VAR findings covering the COVID-19 pandemic stand in Table 5. The differences between Table 5 (LASSO-VAR) and Table 4 (TVP-VAR) are minor regarding To-, From-, and Net-connectedness. The same applies to the Ridge-VAR estimation in Table A.2 in the Appendix. Thus, the results for the COVID-19 period are robust, confirmed via three diverse autoregressive models. Figures A.1 to A.3 in the Appendix show total dynamic connectedness based on TVP-VAR, LASSO-VAR, and Ridge-VAR. Time-varying total connectedness appears close in the three methods, with minor differences in the case of TVP-VAR. The outbreak of COVID-19 decreased the total connectedness in the system, which could be due to the following reasons. First, SARS-CoV-2 got the attention of the media and state authorities and put health institutions on high alert. Second, the decline in global economic activity caused investors to reduce their exposure to highly speculative instruments. The need for liquidity was expressed not only among businesses but also individuals.
To-, From-, and Net-connectedness based on LASSO-VAR estimations during the COVID-19 Period.

Source. Authors’ elaboration.
Note: This table indicates the LASSO-VAR estimations during the COVID-19 period, standing on the fifteen diverse asset classes in the system. The series covers the period from January 1, 2020, to December 1, 2021, with daily logarithmic frequencies. The results were generated using one autoregressive lag (lag = 1), 200 rolling windows, and ten steps ahead (h=10). To-connectedness indicates volatility spillover that variable (i) transmits to others, while From-connectedness signifies spillover effects that variable (i) absorbs from the others in the system. The Net Connectedness shows the difference between To and From-connectedness.
However, the system remains highly interconnected during the two periods under study, varying between 80% and 70%. The explanation is that crypto participants copy each other’s movements, known as herding behavior. The herd concept in the crypto industry has been widely addressed by authors where buying and selling positions are influenced by group movements (Bouri et al., 2019; Gurdgiev & O'Loughlin, 2020; King & Koutmos, 2021; Raimundo Júnior et al., 2022). The herding behaviors are justified because individual investors dominate the marketplace without experience in price mechanisms. Although crypto whales drive part of this industry, knowing if they are institutional or individual investors is still challenging. The anonymity within the blockchain makes it impossible to identify who stands behind the created wallets.
Net Pairwise Connectedness Plots
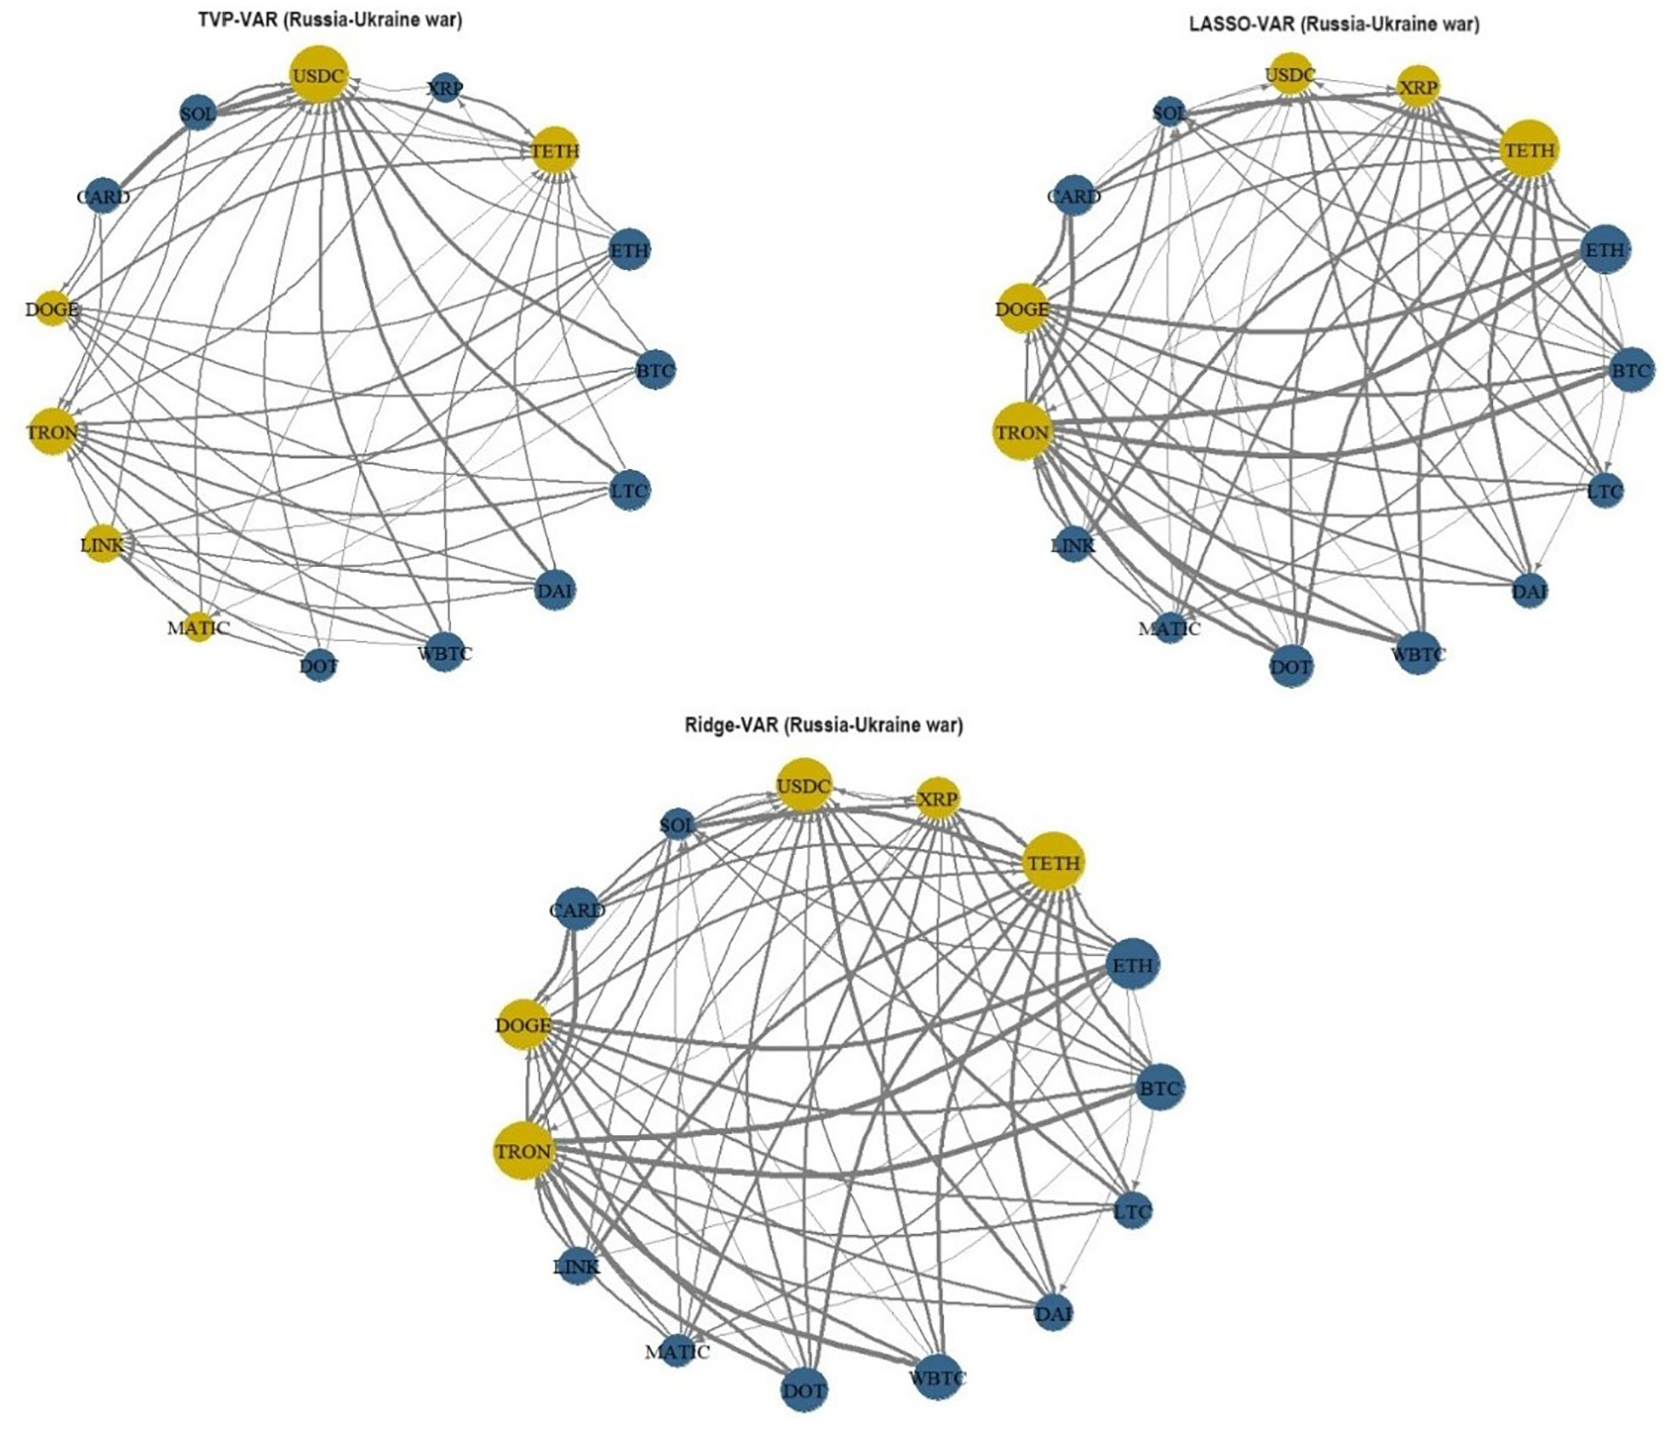
This section examines net pairwise connectedness for the two studied periods through a logarithmic return series. The blue nodes show that the particular asset gives more to the system than it absorbs. In contrast, the yellow ones indicate that the asset is a spillover receiver rather than an absorber. The arrows document the direction of the effect from one cryptocurrency to another. Figure 3 indicates the pairwise connectedness plots during the Russia-Ukraine war. The plots highlight the system’s net effect and directional spillover. Estimates through the three techniques are robust, with some specific differences. MATIC and LINK in TVP-VAR appear as net receivers, while the opposite is true in LASSO and Ridge-VAR. The XRP is the net transmitter in TVP-VAR, while the net receiver in LASSO and Ridge. These minor differences are attributed to the characteristics of TVP compared to LASSO and Ridge. The difference between being a net receiver and a net transmitter is minimal, documented by the node size. The system tends to be dominated by ETH, BTC, CARD, WBTC, LTC, and DOT as net transmitters. On the other hand, net absorbers remain TRON, USDC, TETH, and DOGE. The system appears almost balanced between net receivers and net absorbers.
Net pairwise network connectedness plots during the Russia-Ukraine war.
Figure 3 indicates the pairwise connectedness plots during the Russia-Ukraine war. The plots highlight the system’s net effect and directional spillover. Estimates through the three techniques are robust, with some specific differences. MATIC and LINK in TVP-VAR appear as net receivers, while the opposite is true in LASSO and Ridge-VAR. The XRP is the net transmitter in TVP-VAR, while the net receiver in LASSO and Ridge. These minor differences are attributed to the characteristics of TVP compared to LASSO and Ridge. The difference between being a net receiver and a net transmitter is minimal, documented by the node size. The system tends to be dominated by ETH, BTC, CARD, WBTC, LTC, and DOT as net transmitters. On the other hand, net absorbers remain TRON, USDC, TETH, and DOGE. The system appears almost balanced between net receivers and net absorbers.
The net connectedness plots during the COVID-19 pandemic appear in Figure 4. Estimates using three techniques show that BTC, ETH, LTC, WBT, and LINK increased their net spillover return (node size) during this period. Compared to the Russia-Ukraine war, the system tends to be less interconnected and dominated by net receivers during this period. It is worth mentioning that the strength of the spillover (thickness of the arrows and the node’s size) in the direction of net receivers comes mainly from ETH, BTC, and LTC.

Pairwise network connectedness plots during the COVID-19 pandemic.
During the war in Ukraine, the weight and strength of the influence was more widespread among other altcoins. The crypto market in itself is incomparably more interconnected than the capital market. First, the participants are primarily unprofessional, and their main motive is quick profits. Second, the positions are mainly affected by events related to the crypto industry. Third, the lack of intrinsic value of the crypto instruments makes this market highly unstable. Considering these facts and their interconnectedness, the space for diversification is very narrow. TETH, USDC, and DAI offer room for diversification but cannot stabilize the portfolio from external shocks.
Conclusions
This study examined the impact of two non-economic events—the Russia-Ukraine war and the COVID-19 pandemic—on return spillovers among the 15 most capitalized cryptocurrencies, finding comprehensive effects on both media attention and crypto market dynamics. By employing advanced autoregressive models such as TVP-VAR, LASSO VAR, and Ridge VAR to analyze return spillovers, the study provides a framework for understanding market dynamics under external shocks by documenting how major cryptocurrencies, such as Bitcoin and Ethereum, change their roles during geopolitical and health crises. The empirical results show a clear contrast in market behavior during these events, with a considerable decline in cryptocurrency values, emphasizing their vulnerability to global shocks. The Russian invasion of Ukraine, along with the outbreak of COVID-19 reduced media interest in cryptocurrencies. Despite their different origins, the two non-economic events considerably impacted the global financial system. The cryptocurrency market was in cardiac arrest for some time, and most of them went into free fall. In March 2023, BTC reached its downside peak of $17 k, underlining the market’s fragility and questioning the sustainability of such digital assets under crisis conditions. Considering the unique pressure on the crypto industry during this period, we explored opportunities for diversification and return connectedness. Their highly speculative nature and interdependence prevent adequate portfolio optimization. Two fundamental concepts explain this. First, the lack of intrinsic value makes it impossible for crypto investors to have reservation prices (such as equity stocks or the housing market). Second, the participants’ financial literacy determines their market positions in a flow with others, which makes the system highly fragile. The price fluctuations are affected not only by individual participants but also by crypto whales. However, anonymity in blockchain technology does not allow transparency on the demographic structure of the crypto participants. The results indicate that TETH and USDC are the only ones generating signals to diminish crypto portfolio risk. Apart from being negatively associated with each other, both maintain low return connectedness with other cryptocurrencies. Compared to the others, TETH transmits little spillover in the system, 31.1% and 47.3%, respectively, during the two respective periods. However, it absorbed between 50.3% and 44.6% during the war in Ukraine, while during COVID-19, it absorbed between 38.4% and 46.8%. Similarly, during the same periods, USDC transmits spillover into the system between 13.2% and 47.3% while receiving from the system between 23.9% and 49.3%. Conversely, stablecoin DAI appears as a potential diversifier only during COVID-19, not during the Russia-Ukraine war. DAI tokens reside on the ETH blockchain, which explains its high connectedness with ETH. It is worth noting that the ETH spillover dominated the crypto ecosystem during two consecutive shocks. The interesting fact is that the spillover strength of BTC has faded, especially during the Russia-Ukraine war.
Our findings contribute to the existing literature by shedding light on the intricate relationship between geopolitical and health crises and the crypto market dynamics. The study supports the theory of market sensitivity to external shocks and extends our understanding of the speculative nature of cryptocurrencies. The observed market behaviors consolidate the notion of cryptocurrencies’ lack of intrinsic value and their dependency on investor sentiment and media attention. From a practical perspective, our analysis suggests that investors should exercise caution when considering cryptocurrencies as part of a diversified portfolio, especially during times of global uncertainty. The limited diversification benefits and high interconnectedness observed in Tether (TETH) and USD Coin (USDC) indicate the need for a more strategic approach to crypto investment, emphasizing the importance of understanding fundamental market dynamics and investor behavior. This study is not without limitations. Firstly, its focus on the cryptocurrency market may only partially capture the dynamics of some digital assets. The analysis primarily centers on the most capitalized cryptocurrencies, which may overlook the broader spectrum of digital assets and their interconnectedness and spillover effects. Future research could enhance understanding by exploring the role of emerging digital assets and the impact of regulatory changes on market dynamics. Additionally, examining the demographic profiles of crypto investors might yield valuable insights into market behaviors and investment strategies, particularly during times of crisis. Furthermore, future studies should investigate the long-term effects of global crises on the cryptocurrency market and evaluate the role of emerging digital assets. A comparative analysis between cryptocurrency markets and traditional financial systems could provide deeper insights into their vulnerabilities and strengths in response to global shocks.
Footnotes
Appendix
Ridge VAR estimations during the COVID-19 Period.
| TRON | LINK | MATIC | DOT | WBTC | DAI | LTC | FROM | |
|---|---|---|---|---|---|---|---|---|
| BTC | 17.43 | 9.99 | 0.09 | 5.24 | 0.28 | 2.65 | 6.00 | 3.29 |
| ETH | 9.55 | 16.69 | 0.02 | 5.51 | 0.20 | 4.59 | 7.04 | 2.85 |
| TETH | 0.36 | 0.10 | 53.11 | 0.19 | 31.57 | 0.39 | 0.12 | 0.37 |
| XRP | 6.67 | 7.51 | 0.08 | 25.74 | 0.36 | 4.01 | 6.58 | 2.61 |
| USDC | 0.98 | 0.74 | 31.36 | 0.70 | 50.67 | 0.45 | 0.25 | 0.43 |
| SOL | 4.76 | 8.87 | 0.30 | 5.44 | 0.31 | 34.30 | 5.74 | 2.32 |
| CARD | 7.21 | 9.00 | 0.04 | 6.16 | 0.08 | 3.77 | 21.66 | 2.97 |
| DOGE | 6.53 | 5.57 | 0.34 | 3.81 | 0.34 | 2.33 | 4.73 | 43.22 |
| TRON | 8.02 | 8.95 | 0.07 | 8.13 | 0.17 | 3.61 | 6.87 | 3.25 |
| LINK | 7.73 | 11.19 | 0.05 | 6.48 | 0.15 | 4.20 | 7.79 | 3.19 |
| MATIC | 6.39 | 8.60 | 0.02 | 5.52 | 0.10 | 4.75 | 8.59 | 2.07 |
| DOT | 8.29 | 10.15 | 0.06 | 5.46 | 0.14 | 4.16 | 8.03 | 2.62 |
| WBTC | 17.32 | 10.08 | 0.07 | 5.23 | 0.24 | 2.66 | 5.95 | 3.22 |
| DAI | 0.98 | 1.13 | 14.89 | 0.53 | 13.42 | 0.34 | 1.07 | 0.60 |
| LTC | 10.00 | 10.70 | 0.06 | 6.86 | 0.13 | 3.17 | 6.74 | 3.51 |
| To | 94.79 | 102.57 | 47.45 | 65.27 | 47.50 | 41.09 | 75.51 | 33.30 |
| Inc. Own | 112.23 | 119.27 | 100.56 | 91.01 | 98.17 | 75.39 | 97.17 | 76.52 |
| Net | 12.23 | 19.27 | 0.56 | −8.99 | −1.83 | −24.61 | −2.83 | −23.48 |
| BTC | ETH | TETH | XRP | USDC | SOL | CARD | DOGE | |
|
|
7.20 | 7.80 | 4.51 | 7.57 | 17.30 | 0.27 | 10.40 | 82.57 |
|
|
7.60 | 10.72 | 5.80 | 8.85 | 9.64 | 0.27 | 10.65 | 83.31 |
|
|
0.22 | 0.19 | 0.05 | 0.19 | 0.28 | 12.58 | 0.27 | 46.89 |
|
|
9.83 | 8.72 | 5.05 | 6.52 | 6.65 | 0.13 | 9.53 | 74.26 |
|
|
0.46 | 0.48 | 0.26 | 0.37 | 0.84 | 11.57 | 0.45 | 49.33 |
|
|
5.96 | 7.77 | 6.15 | 7.06 | 4.79 | 0.21 | 6.01 | 65.70 |
|
|
7.44 | 9.52 | 7.25 | 8.91 | 7.16 | 0.33 | 8.50 | 78.34 |
|
|
5.62 | 6.46 | 2.55 | 4.61 | 6.37 | 0.28 | 7.26 | 56.78 |
|
|
20.10 | 9.14 | 5.71 | 8.29 | 8.02 | 0.20 | 9.46 | 79.90 |
|
|
8.11 | 17.58 | 6.40 | 8.67 | 7.66 | 0.24 | 10.56 | 82.42 |
|
|
7.32 | 9.22 | 25.75 | 7.26 | 6.37 | 0.20 | 7.84 | 74.25 |
|
|
8.03 | 9.51 | 5.48 | 19.92 | 8.41 | 0.32 | 9.41 | 80.08 |
|
|
7.19 | 7.72 | 4.50 | 7.66 | 17.45 | 0.29 | 10.41 | 82.55 |
|
|
0.73 | 0.86 | 0.68 | 1.07 | 1.13 | 61.81 | 0.75 | 38.19 |
|
|
8.09 | 10.16 | 5.26 | 8.27 | 10.01 | 0.19 | 16.84 | 83.16 |
| To | 83.79 | 98.28 | 59.66 | 85.29 | 94.64 | 27.07 | 101.51 |
|
| Inc. Own | 103.89 | 115.86 | 85.41 | 105.21 | 112.09 | 88.87 | 118.35 |
|
| Net | 3.89 | 15.86 | −14.59 | 5.21 | 12.09 | −11.13 | 18.35 |
|
Source. Authors’ elaboration.
Note: This table indicates the Ridge-VAR estimations during the COVID-19 period, standing on the fifteen diverse asset classes in the system. The series covers the period from January 1, 2020, to December 1, 2021, with daily logarithmic frequencies. The results were generated using one autoregressive lag (lag = 1), 200 rolling windows, and ten steps ahead (h=10). To-connectedness indicates volatility spillover that variable (i) transmits to others, while From-connectedness signifies spillover effects that variable (i) absorbs from the others in the system. The Net Connectedness shows the difference between To and From-connectedness.
Funding
The author(s) received no financial support for the research, authorship, and/or publication of this article.
Declaration of Conflicting Interests
The author(s) declared no potential conflicts of interest with respect to the research, authorship, and/or publication of this article.
Data Availability Statement
Data sharing not applicable to this article as no datasets were generated or analyzed during the current study.