
Abstract
External shocks have profound impacts on urban industrial sectors, influencing the resilience of urban economic networks. While traditional complex network approaches provide insights into industrial linkages, they often fall short of capturing the broader macroeconomic implications. To address this limitation, this study integrates input-output relationships within a Dynamic Stochastic General Equilibrium (DSGE) framework. Using Beijing’s 2020 input–output table and statistical yearbook for parameter calibration, the model simulates the effects of external supply price fluctuations on the urban economy. Furthermore, DSGE simulations highlight that sector-specific shocks produce varying impacts on macroeconomic variables, underscoring the necessity for tailored, industry-specific policies to enhance the resilience and adaptability of urban economies.
Plain Language Summary
Urban industrial network is important to economic resilience. Traditional assessments by industrial complex network methods only consider input-output relation. But residents may consider consumption, income and employment to be more important. A DSGE model with industrial network is developed to link industrial network with urban economy. This can assess urban economic resilience from different perspectives.
Introduction
Studying urban economic resilience is crucial for enhancing the ability of regional economies to withstand external shocks. Global emergencies (e.g., COVID-19 pandemic) have revealed the vulnerability of China’s urban industrial networks (Yuan & Hu, 2023). In this context, analyzing industrial resilience through the lens of complex network theory offers valuable insights into the adaptability and robustness of economic systems.
The analysis of economic resilience through complex industrial networks focuses solely on output, while ignoring impacts on consumption, employment, and other macroeconomic variables. However, the economy functions as a complex system where output, consumption, and employment collectively influence social welfare. From a social welfare perspective, how can the importance of various sectors be comprehensively assessed? Furthermore, is there an effective method to capture the impact of complex industrial networks on all aspects of the economy? In the context of the United States' industrial network, sectors such as manufacturing, services, and leisure and hospitality have been identified as key contributors to economic resilience (Barlow & Vodenska, 2021). At the county level, regions dominated by the real estate sector tend to experience more severe economic declines and exhibit lower resilience during recessions (Han & Goetz, 2019).
Similarly, in the study of China’s complex industrial network, wholesale trade, as well as goods and services, have been highlighted as critical sectors that play a central role in supporting industrial network stability (Feng et al., 2024). However, the economy functions as a complex system where output, consumption, and employment collectively influence social welfare. From a social welfare perspective, how can the importance of various sectors be comprehensively assessed? Furthermore, is there an effective method to capture the impact of complex industrial networks on all aspects of the economy?
The key to solving the problem lies in constructing systematic connections between the industrial network and various aspects of the economy. This paper embeds the industrial network into a DSGE model, achieving a unified framework that integrates the industrial network evaluation system with various aspects of the macroeconomy. Beijing was selected as the study area for three core reasons: first, it serves as China’s strategic political, cultural, and economic center, with a well-developed and diversified industrial structure encompassing high-tech, finance, advanced manufacturing, and modern services—these characteristics make its economic resilience under external shocks highly representative of China’s major urban economies. Second, exploring Beijing’s economic resilience holds practical significance for guiding policy-making in national key cities. Because, its industrial linkages and shock transmission mechanisms can provide reference for other large urban agglomerations. Third, the availability of comprehensive and high-quality 2020 input-output data and statistical yearbook data for Beijing ensures the reliability and accuracy of model parameter calibration.
Theoretically, this article bridges the gap between industrial network structures and the macroeconomic dynamics of resilience under external shocks, providing a novel perspective on the interrelations between key economic sectors and aggregate outcomes. While existing studies primarily focus on the impact of shocks on output, they often overlook the contributions of consumption and employment as equally important dimensions of economic resilience. This article advances the theoretical framework by embedding a 19-industry input–output network into a DSGE model, enabling a multidimensional assessment of resilience. In prior research, the contributions of different sectors to resilience have been treated as uniform across macroeconomic variables, implicitly assuming that sectors critical for output are equally critical for consumption and employment. However, this assumption does not universally hold. By integrating industrial network structures with macroeconomic modeling, this study provides a more comprehensive mechanism that accounts for the differentiated roles of industries in resilience. Furthermore, this framework highlights the significance of inter-industry linkages and elasticities, demonstrating that the stability and adaptability of an economy depend not only on sector-specific output but also on the interdependencies between industries. This approach aligns with and extends existing hypotheses in the literature, offering a unified framework to reconcile diverse findings. It also sets the stage for further theoretical exploration into how industrial networks shape macroeconomic stability under varying conditions of external shocks.
Empirically, this article provides robust evidence for the hypothesis that industry contributions to economic resilience differ significantly across macroeconomic variables under external shocks. Through a series of dynamic simulations and impulse response analyses, this study identifies a differentiated impact of shocks on aggregate output, consumption, and employment, offering new insights into the multidimensional nature of resilience.
Practically, the theoretical framework and empirical findings of this article demonstrate the importance of implementing targeted policy measures that address the diverse contributions of industries to output, consumption, and employment. Recognizing the interdependence within industrial networks and their role in economic resilience allows policymakers to devise more effective strategies for strengthening key sectors. Advancing manufacturing innovation, promoting sustainable agricultural practices, and enhancing intersectoral connections can collectively bolster regional economic stability and improve resilience to external shocks.
The remainder of this article is structured as follows. Section “Literature Review” reviews the relevant literature. Section “Model” introduces the DSGE model. Section “Simulation” introduces the impulse response diagram, and analyses the impacts on gross output, employment, and consumption of various industries when subjected to a shock. Section “Macroeconomic Variables Not Captured by the Industrial Network” introduce macroeconomic variables not captured by the industrial network. Section “Discussions” discuss the ranking of industries for other centrality indicators and the implications of our study. Finally, final section is conclusion.
Literature Review
A Single-Perspective Evaluation: Industrial Complex Network
The stability of complex industrial networks is heavily influenced by the role of key industries, particularly those with high centrality. These industries act as critical nodes within the network, maintaining overall stability through their input-output relationships (Cheng, 2024). Key nodes in complex industrial networks can be identified based on input-output relationships. There are many methods to identify key nodes in complex networks (Boundi Chraki, 2016) but they all focus solely on input-output effects. At the level of industry linkages, supply shocks, like productivity changes and natural disasters, ripple through the supply chain, affecting industries that depend on the impacted sectors (Acemoglu et al., 2012).
Degree Centrality
Degree centrality focuses on the number of direct connections a node has, highlighting its immediate influence in the network. Liu et al. (2023) examined the degree centrality of the agriculture, animal husbandry, and chemical industries, revealing that these sectors constitute a substantial proportion of global N2O emissions, thereby underscoring their significant environmental impact. Building on this, Liang et al. (2020) used in-degree and out-degree metrics to evaluate the influence of various sectors within global metals trade activities, elucidating the interconnected relationships and the pivotal roles of different industries within the trade network. Similarly, Ma et al. (2024) applied degree centrality to determine the hierarchical structure of urban streets in China, providing novel insights for enhancing urban resilience. Furthermore, Zheng et al. (2021) investigated the topology of global industry-driven networks, exploring the effect of degree centrality on energy intensity and highlighting the intrinsic link between industrial networks and energy consumption. Lastly, Cheng (2024) employed degree centrality analysis to identify key industrial sectors across various economic zones in China, pinpointing the essential industries that underpin regional economic development.
PageRank
PageRank emphasizes the importance of a node based on the significance of its connections, capturing both direct and indirect influence. Leonidov and Serebryannikova (2019) demonstrate the utility of PageRank centrality for determining the relative size of sectoral sales within a multisector macroeconomic competitive equilibrium, highlighting its relevance to economic modeling. Building on this, Sun et al. (2019) apply complex network theory and regression analysis to construct a railway freight transportation network based on provincial cargo exchange data in China, using PageRank to evaluate the importance of provincial nodes. Extending its application to environmental studies, Liu et al. (2024) analyze daily AQI data from 27 cities in the Yangtze River Delta (2017–2022), establishing a stable AQI-weighted directed network and identify key cities for air quality management.
Closeness Centrality
Closeness centrality measures how quickly a node can access other nodes, reflecting its efficiency in spreading information or resources. Zhou and Wang (2021) developed a network model based on industrial complex network theory to analyze energy flows, highlighting the critical role of key sectors in maintaining economic stability and driving growth. Similarly, Cao et al. (2019) modeled China’s railway network as a complex weighted network, utilizing closeness centrality to pinpoint essential nodes within the transportation infrastructure. In contrast, Dong and Yang (2016) explored inter-enterprise knowledge networks, revealing that higher closeness centrality negatively impacts subsequent new product development performance. These studies collectively demonstrate the utility of closeness centrality in uncovering critical nodes across diverse domains, providing insights into economic resilience, infrastructure optimization, and knowledge network dynamics.
Betweenness Centrality
Betweenness centrality identifies nodes that act as bridges in the network, emphasizing their role in controlling information or resource flow. Xun et al. (2021) analyzed the entertainment industry in China, highlighting its role as a demand-driven sector that stimulates consumption and economic growth. However, its limited direct network connections reduce its capacity to foster broader industrial development. Building on this, Li et al. (2022) examined mining-related industries, revealing their critical position within China’s industrial chain and their significant contribution to sustaining overall network functionality. Expanding the scope to international contexts, Zhu and Liu (2022) explored global tourism networks and demonstrated that intermediary metrics such as betweenness centrality enhance regional tourism arrivals and performance by improving interconnectivity.
Eigenvector Centrality
Eigenvector Centrality evaluates a node’s influence by considering the importance of its connected neighbors. Liu et al. (2018) applied centrality theory to power grids, using eigenvector centrality alongside net ability and vulnerability indices to identify key nodes and assess their susceptibility to cascading failures. Extending this approach to spatial networks, Deng et al. (2024) utilized directed weighted networks and social network analysis to identify key buildings and community structures within traditional villages, providing insights into their spatial order and hierarchical organization. In a different context, Sun et al. (2023) used an air transport network model to analyze U.S. domestic flight data (1995–2020), employing eigenvector centrality to detect anomalies in unweighted and undirected networks, which were resolved by incorporating link weights and directionality.
In addition, there are a variety of centrality indicators in complex industrial networks, and the ranking results of different indicators for each industry are often significantly different, which shows that the robustness of the method is insufficient. At the same time, the analysis of complex industrial networks mainly focuses on the output relationship between industries, ignoring key macroeconomic variables such as employment and consumption. These limitations suggest that complex industrial networks fail to fully capture the macroeconomic impact of each industry.
Multi-Dimensional Evaluation: Multi-Sector DSGE Model
Although complex industrial networks have significant advantages in identifying and ranking the centrality of various industries, their perspective is still relatively simple, focusing mainly on industry-level analysis, and it is difficult to fully capture the impact of individual sectors on macroeconomic variables such as total output, employment, and consumption under external supply price fluctuations. In related research, a DSGE model tailored for industrial analysis has been developed.
DSGE model clearly defines how economic agents make optimal decisions and interact, simplifying the analysis of their behavior. It carefully characterizes both the long-term equilibrium state (i.e., steady state) of the economy and the short-term dynamic adjustment process. By doing so, it effectively combines long-term and short-term analysis (Smets & Wouters, 2007).
Some scholars have employed multi-sector DSGE models to analyze various macroeconomic phenomena, with applications spanning different economies and research questions. For instance, Rees et al. (2016) introduced a multi-sector DSGE model developed by the Reserve Bank of Australia, which incorporates several productive sectors, such as the resources sector, to capture the dynamic characteristics of the Australian economy. Similarly, Górajski et al. (2023) applied a multi-sector DSGE model to polish data to examine the implications of targeting different measures of inflation aggregate inflation and core inflation in small open economies characterized by large supply fluctuations.
Besides this, multi-sector DSGE models can analyze the macroeconomic impact of shocks to specific industry sectors. For example, in a study of India, Ghate et al. (2018) constructed a three-sector NK-DSGE model and analyze the monetary policy response to cross-sectoral terms of trade shocks, with a special focus on the agricultural sector and food procurement. Their analysis shows that food procurement leads to higher inflation, inter-sectoral terms of trade changes and positive output gaps, which have important implications for monetary policy settings. Lee and Song (2015) analyzed the Korean real estate market’s impact on the business cycle. They used a DSGE model that includes the housing construction sector for this analysis. Permeh et al. (2017) construct a multi-sector DSGE model for the Iranian economy, this model covers the agricultural, non-agricultural, and oil sectors. They analyze the negative effects of rising oil prices on the agricultural sector.
Although there are many related studies using DSGE model to analyze industries, most of them study industrial structure and a specific industry. First, they rely on broad sector groupings (typically 2–5 categories; Awasthi & Shukla, 2025; de Koning et al., 2015) or single-industry (Lee & Song, 2015) focus without integrating fine-grained inter-industry linkages; second, they rarely track employment and consumption. We develop a DSGE model that incorporates the input–output relationships of a complex industrial network, differing from traditional frameworks in three core ways: (1) 19 disaggregated sectors; (2) inter-industry input-output coefficients as structural parameters to reflect real industrial dependencies; and (3) tracking sector-specific employment and consumption to meet holistic resilience evaluation needs. Using its measurement results and the model’s multi-dimensional simulation capabilities to identify key sectors influencing urban industrial resilience.
Model
Household
Household consumers derive utility from consumer goods to supply labor to different industrial sectors. Refer to previous literature (Christiano et al.,1997), the maximizing utility function under budget constraint is:


β is the discount factor for future utility of the household sector,
The construction of a Lagrangian function for the decision variables of the household sector in period t yields the first-order condition for optimality, the collation results is:

Equation 3 represents the labor factor supply function for the household sector. Subsequently, the Euler equation for consumption in the household sector can be calculated, as follows:

Manufacturer’s Department
The production function of the manufacturing sector is represented by a Cobb-Douglas production function with constant returns to scale (King et al., 1988):

where

The direct consumption coefficient,

This formula (7) relates capital and direct consumption coefficient, reflecting the dynamic impact of capital goods price changes on industrial capital supply. Through formulas (6) and (7), the capital construction method adopted in this study not only reflects the complexity of inter-industry capital flows, but also enhances the actual economic explanatory power of the model combined with input-output table data. This design provides a solid theoretical basis for the subsequent analysis of how shocks affect industry output through capital flows.
Consumption Structure


In this context, η represents the elasticity of substitution between commodities in different industrial sectors. Furthermore, in order to achieve the objective of maximizing effective consumption, the resulting domestic composite price level is calculated in accordance with the constraints set forth in Equation 11:

and

Trade in Intermediate Goods
The study of trade in intermediate goods represents a significant avenue for examining the influence of externally sourced products on the domestic economy (Gong et al., 2016). This model elucidates how trade in intermediate goods affects the domestic economy by differentiating between domestic and foreign intermediate goods. The effective supply quantity of intermediate goods encompasses both domestic and foreign intermediate goods, which are synthesized through a CES production function:
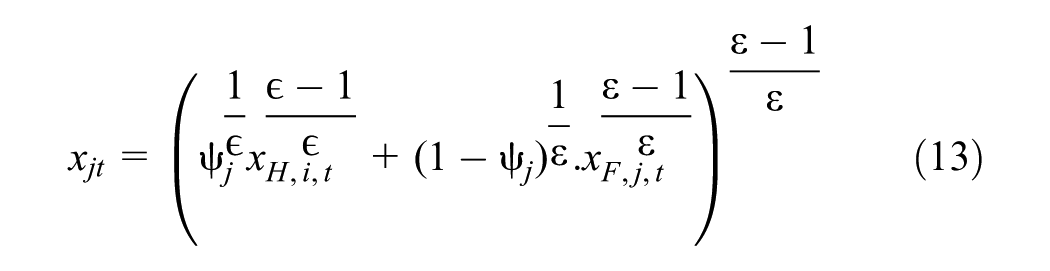

The weight parameter


The composite intermediate goods price index for sector j can be expressed as follows:

The price index is a weighted average of domestic and foreign intermediate goods prices, with the weights determined by
Equilibrium
Thus, the dynamic general stochastic equilibrium model of multi-sector dynamic economy is completed, which needs to satisfy the equilibrium condition of market clearing:
Clearing of the labor factor market:

The capital factor market clears:

The intermediate goods market clears:

The product market clears:

Simulation
Parameter Calibration
The data were sourced from the 2020 input–output table for 42 sectors in Beijing, provided by the Beijing Municipal Bureau of Statistics (BBS). Due to the unavailability of detailed data for certain sub-sectors in the Beijing Statistical Yearbook 2020. Therefore, according to the Industrial Classification for National Economic Activities published in 2017, we merged the 42 sectors into 19 sectors (de Koning et al., 2015). For modeling purposes, the 19 sectors were represented by Arabic numerals Appendix A. Some parameters of the model are used in the previous literature, as shown in Table 1.
Parametrization.

Parameter Calculation
Other parameters are calculated according to the 2020 Beijing input–output table. The preference parameter
Parameter Calculation.

Impulse Response
In the following impulse response functions, the abscissa (X-axis) indicates the period, and the ordinate (Y-axis) represents the response value to the pulse shock at each time. The top five sectors most impactful on total output are: Mining industry, Residential services, repairs and other services, Agriculture, forestry and fishing, Manufacturing industry, Research and services.
In the context of the 2020 pandemic, several industries in Beijing experienced negative impacts on aggregate output when subjected to external supply price shocks, driven by a combination of cost pressures and demand-side adjustments (Figure 1). Resource-dependent industries, such as agriculture, forestry, and fishing, along with the mining industry, were particularly vulnerable due to their reliance on upstream inputs and limited capacity to offset rising costs through price adjustments. Similarly, the electricity, heat, water, and gas production sector faced significant challenges in transferring increased costs to consumers, leading to reduced output contributions. Service-oriented industries, including accommodation and catering as well as culture, sports, and recreation, suffered severe demand contractions as a direct consequence of mobility restrictions and social distancing measures, further compounded by rising operational costs. The leasing and business services sector, along with the financial industry, was indirectly affected by diminished economic activity across other sectors, which constrained their output contributions. The health and social work sector, while essential during the pandemic, underwent structural shifts in demand toward pandemic-specific services, leaving other areas of social work underutilized. Public administration, social security, and social organizations also faced efficiency pressures as resources were reallocated toward pandemic mitigation efforts. Lastly, the education sector’s rapid transition to online modalities temporarily reduced its overall economic contribution. Collectively, these industries illustrate the intricate interplay between rising input costs, suppressed demand, and structural shifts in economic activity, which together exacerbated their negative impacts on Beijing’s aggregate output during the pandemic.

Sectors impacted by shocks negatively affecting gross output.
In the context of the 2020 pandemic, certain industries in Beijing demonstrated a positive impact on aggregate output despite being subjected to external supply price shocks (Figure 2). This phenomenon can be attributed primarily to the profound reshaping of demand structures and economic operation modes during the pandemic. First, the surge in demand for pandemic-related supplies drove rapid expansion in the manufacturing industry as well as research and services, particularly in the production of medical supplies, high-tech products, and vaccine development, which emerged as key drivers of economic growth. This shift in demand further activated the transport, storage, and postal services sectors, as the explosion in logistics and delivery needs not only sustained the flow of goods but also supported the wholesale and retail sectors, particularly through the rapid growth of online shopping and essential goods procurement. Meanwhile, the construction sector played a stabilizing role in the economy through government-led infrastructure investments, creating significant employment opportunities that enhanced household consumption capacity. This interacted closely with the real estate industry, where stable investment demand and market activity supported construction, while construction, in turn, reinforced upstream and downstream industrial linkages. Moreover, the pandemic-induced surge in online activity significantly boosted the value-added contributions of the information transmission, software, and information technology services sector, which became an efficient driver of economic growth. At the same time, the water, environment, and utilities management sector solidified its foundational role in urban operations, responding to heightened public health demands during the pandemic. Finally, the residential services, repairs, and other services sector supplemented economic vitality by catering to the increased demand for community and household needs.

Sectors impacted by shocks that have a positive effect on gross output.
Macroeconomic Variables Not Captured by the Industrial Network
Industry Complex Network
In this section, we will show the Centrality ranking results based on complex industrial network analysis in detail, including the ranking of betweenness centrality and PageRank indicators. Betweenness centrality is a metric used in network analysis to measure the extent to which a node lies on the shortest path between other nodes. Specifically, the betweenness centrality value of a node is equal to the proportion of the node in the shortest path between all pairs of nodes. Nodes with high betweenness centrality act as “bridges” in the network, connecting multiple different subnetworks or clusters. These nodes have a key mediating role in the process of information or resource flow.
PageRank is an algorithm based on link analysis that was originally used by Google to rank web pages. It iteratively calculates the importance of nodes, accounting for the number of nodes and the importance of nodes in the chain. PageRank considers not only the number of inbound nodes, but also the importance of these inbound nodes themselves. If a node is relied on by multiple important nodes (i.e., nodes with high PageRank values), its PageRank value will also be high. By considering both indicators, the importance of industries in the network can be more fully assessed. Betweenness centrality provides information about the role of the industry as a bridge in the network, while PageRank provides information about the overall influence of the industry on the degree of dependence (Appendix B).
Impulse Response Comparisons
In the following impulse response functions, the abscissa (X-axis) indicates the period, and the ordinate (Y-axis) represents the response value to the pulse shock at each time (Figures 3 and 4).
Shocks to consumption from the prices of external supplies in different sectors (Figure 3).

Sectoral supply price shocks impact on consumption.
By examining the impulse response graph of aggregate consumption in response to shocks in each sector, we identify the five most influential sectors: mining, real estate, transportation, storage, and postal services, manufacturing, and agriculture, forestry, and fishing.
2. Shocks to employment levels from the prices of external supplies in different sectors (Figure 4).

Sectoral supply price shocks impact on employment levels.
As can be seen from these figures, the five sectors that have the greatest impact on employment levels are: real estate industry, mining industry, transport, storage and postal services, information transmission, software, and information technology services, residential services, repairs, and other services.
Discussions
Inconsistencies in Centrality Measures
In the study of complex industrial networks, numerous centrality measures have been developed to rank the importance of industries based on their network positions, such as Eigenvector Centrality, Closeness Centrality, K-shell, and Degree Centrality. However, our analysis reveals significant inconsistencies among these methods in determining key industries. Different centrality measures often yield divergent rankings, leading to challenges in identifying which industries play the most critical roles in the network structure and economic dynamics (see Table 3).
Other Complex Network Centrality Indicators.
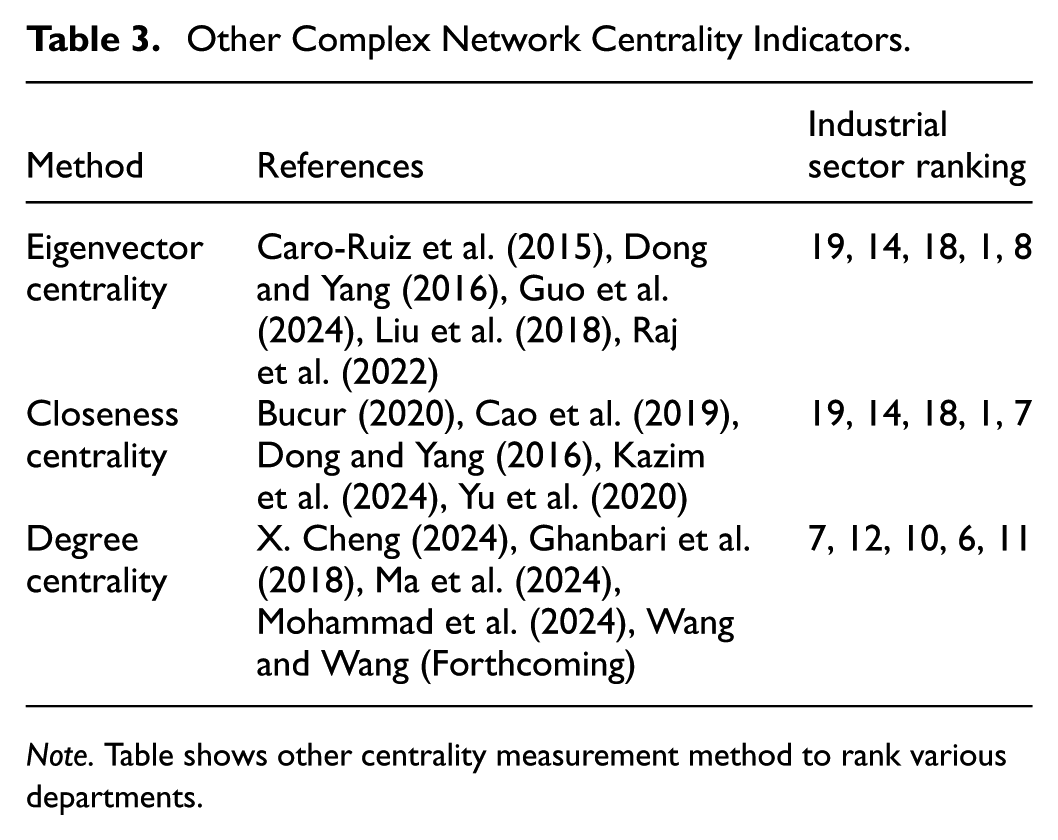
Note. Table shows other centrality measurement method to rank various departments.
This article demonstrates that both the industrial complex network and the DSGE model are useful for identifying key industries within an economy. However, they operate in fundamentally different ways. The complex industrial network analyzes a static economic system and is descriptive. This method can be used to identify which industries have important impacts on other industries from the perspective of industrial linkage. In contrast, the DSGE model offers a dynamic framework that allows for a more comprehensive understanding of how each sector impacts consumption, total output, and employment when subjected to external shocks. The ranking results of the two methods for important nodes in the economy are shown in Table 4.
Comparison of the Results of the Two Methods.

Note. Industry rankings derived from complex industrial network and DSGE model.
The complex industrial network method emphasizes static network relationships and centrality indicators, which often highlight industries with high centrality that may not contribute significantly to macroeconomic outcomes like output, consumption, and employment in response to external shocks. On the other hand, the DSGE model focuses on the dynamic response of industries to external shocks, emphasizing industries' contributions to total output, consumption, and employment. Therefore, the ranking discrepancies between the two methods reflect the different types of economic relationships they capture: one focuses on the static input-output relationships, while the other accounts for the dynamic impact of shocks on the economy. The combination of these methods provides a more comprehensive view of the economic resilience of industries.
Implication
Our study provides a novel framework that integrates industrial networks with macroeconomic dynamics by embedding the input-output network of 19 industries into a DSGE model. This methodological innovation addresses the limitations of prior research, which has predominantly focused on output while neglecting other macroeconomic variables such as consumption and employment. By simulating the effects of external shocks on aggregate output, consumption, and employment, the study offers a more comprehensive understanding of the economic resilience of industrial networks.
The findings reveal that the rankings of industries contributing to aggregate output, consumption, and employment vary significantly under external shocks. This highlights the multidimensional nature of economic resilience and emphasizes the necessity of considering multiple macroeconomic variables when evaluating the role of industries within complex economic systems.
Maximizing total output, enhancing total consumption, and boosting employment are critical for fostering Beijing’s economic resilience and growth. Key sectors such as manufacturing, mining, and agriculture play foundational roles in output generation, supported by investments in technology, sustainable practices, and intersectoral connectivity. Enhancing consumption is driven by real estate, transport, and manufacturing, which stimulate demand, facilitate distribution, and ensure the availability of consumer goods. Employment is bolstered by labor-intensive industries like manufacturing, mining, and transport, with opportunities to further expand through vocational training and modern technologies. These interlinked efforts collectively strengthen economic stability and adaptability.
Maximizing Total Output
Maximizing total output is critical for sustaining long-term economic growth, stabilizing supply chains, and consolidating Beijing’s role as a regional economic hub. Among the analyzed sectors, manufacturing, mining, and agriculture are dominant in output generation due to their systemic role in supplying goods and resources across the economy.
Policies should focus on: (1) enhancing manufacturing’s technological capabilities (e.g., adopting Industry 4.0 technologies) and expanding advanced production facilities; (2) promoting sustainable agricultural practices and investing in agricultural R&D to improve productivity and output stability; (3) strengthening intersectoral connectivity—particularly between manufacturing and upstream mining (for raw material supply) and downstream service sectors—to amplify aggregate output growth. These measures leverage the sectors’ interconnectedness, enabling ripple effects that boost collective output contributions.
Enhancing Total Consumption
Enhancing total consumption is key to stimulating economic vitality, driving employment, and supporting sectoral expansion. Real estate, transport, storage, and postal services, and manufacturing are most closely linked to consumption dynamics. For real estate, policies should leverage its role in stimulating household spending—housing investments drive demand for furniture, appliances, and renovations—with targeted measures such as moderate financial support for first-time homebuyers and standardized management of the rental market to sustain consumption spillover effects. For transport, storage, and postal services, given its vulnerability to external shocks, strengthening logistics resilience through actions like optimizing urban-rural e-commerce distribution networks and establishing emergency logistics reserves is essential to ensure efficient goods circulation. For manufacturing, enhancing domestic production capabilities via upgrading production lines for consumer durables and streamlining supply chains will improve the availability and affordability of consumer goods, further boosting household spending.
Maximizing Employment
Mining, manufacturing, and transport, storage, and postal services are pivotal for employment due to their labor-intensive nature and diverse job opportunities. Mining remains a key employer in resource-dependent areas within Beijing (even amid automation), providing jobs where alternative options are scarce—calling for policies such as intelligent equipment operation training for miners and linking redundant labor to downstream mineral processing roles to stabilize employment. Manufacturing, as one of Beijing’s largest employment sectors, offers roles across skill levels (from assembly-line work to engineering), with targeted measures including a vocational training-manufacturing demand-matching platform (aligning curricula with enterprise needs like robot programming) and subsidized apprenticeship programs for vocational graduates to expand its employment potential. Transport, storage, and postal services—particularly driven by e-commerce and generating jobs in logistics, warehousing, and last-mile delivery—can be supported through policies such as constructing peri-urban logistics hubs with rent subsidies and establishing a logistics worker skill certification system (with salary supplements) to tap into its expansion opportunities.
These sectors form an interconnected employment ecosystem: Mining supports upstream resource supply, manufacturing drives downstream production, and transport, storage, and postal services enable efficient goods movement—collectively underpinning a resilient and inclusive labor market (Appendices A and B).
Conclusion
This study advances the field by integrating industrial networks with macroeconomic dynamics using a DSGE model. By embedding a 19-industry input-output network, the framework provides a comprehensive analysis of how external shocks impact aggregate output, consumption, and employment. This approach not only identifies the varying contributions of different industries to key macroeconomic variables but also offers valuable insights into the adaptability and robustness of economic systems.
The limitations of this study can be summarized in three main areas. The DSGE model used relies on a simplified framework that emphasizes input-output relationships and external supply shocks, neglecting important macroeconomic factors such as monetary policy, price rigidities, and capital accumulation. This simplification reduces the model’s ability to represent complex economic dynamics. Additionally, the exclusion of government interventions, such as fiscal and monetary policies, restricts the analysis to direct effects of shocks without considering how policy responses might influence outcomes or bolster industrial resilience. Lastly, this study depends on a single regional data source (i.e., Beijing’s 2020 input–output table and statistical yearbook data), which may limit the generalizability of the model’s conclusions across different regional economic contexts.
Future research should enhance the DSGE model by incorporating monetary and fiscal policy mechanisms to better capture macroeconomic dynamics and industrial resilience under external shocks. Additionally, extending the model to a cross-country framework would allow for the analysis of international linkages, spillover effects, and coordinated policy responses. These improvements would pro-vide a more comprehensive and versatile tool for examining both domestic and global economic systems. Ultimately, subsequent studies will incorporate data from other regions, thereby enhancing the model's generalizability.
Footnotes
Appendix A
The Sector Number and Name of Industries.

| Industry number | Industrial sectors |
|---|---|
| 1 | Agriculture, forestry and fishing |
| 2 | Mining industry |
| 3 | Manufacturing industry |
| 4 | Electricity, heat, water, and gas production |
| 5 | Constructions |
| 6 | Wholesale and retail sales |
| 7 | Transport, storage, and postal services |
| 8 | Accommodation and catering |
| 9 | Data transfer and IT services |
| 10 | Financial industry |
| 11 | Real estate industry |
| 12 | Leasing and business services |
| 13 | Research and services |
| 14 | Water and utility management |
| 15 | Residential services and repairs |
| 16 | Educate |
| 17 | Health and social work |
| 18 | Culture, sports, and recreation |
| 19 | Public and social services |
Appendix B
In this article, the input-output model is used as the basis for modeling industrial complex networks. Nineteen industrial nodes are identified, and the matrix of direct consumption coefficients is calculated using data from input–output tables. The network diagram is constructed using the direct consumption coefficient matrix. To make the network diagram more intuitive, we set the threshold as .01. If elements in the matrix are less than .01, the connection between the corresponding sectors will not be demonstrated.
Ethical Considerations
No animal or human involved in this study.
Author Contributions
Liyuan Zhang conceived the study and were responsible for the design and development of the theoretical analysis. Chao Chen developed the DSGE model. Shujian Zhou conducted complex network analysis and wrote the original version of draft. Qingchen Fan collected datasets and analyzed impulse response function of DSGE model. Ziru Bao revised the first draft and confirmed the content of the entire article.
Funding
The authors disclosed receipt of the following financial support for the research, authorship, and/or publication of this article: Anhui Provincial Department of Education Project (Grand No. 2024AH052471). Anhui Business College Project (Grand No. 2023ZDG03).
Declaration of Conflicting Interests
The authors declared no potential conflicts of interest with respect to the research, authorship, and/or publication of this article.