
Abstract
While fruit juices are widely considered healthy, their high sugar contents are often masked by a “halo effect” created by the positive image of fruits. This study, taking orange juice as a focal product, explores the role online self-media plays in reducing consumers’ sugary drink consumption with the presence of a halo effect. A discrete choice experiment (with attributes including fruit juice concentration, sugar content, taste, and price) was conducted in Beijing, China, to measure changes in consumers’ choices induced by randomly provided sugar content information. Four treatments containing the same basic information on the sugar content of sugary drinks, with different presentation forms (three text messages and a short video) and specificity levels, were designed for the experiment. Estimated mixed-logit models indicate that all four treatments significantly reduced participants’ likelihood of choosing high-sugar orange juices, with the short-video treatment being the most effective. It is likely that the video helped consumers convert a vague concept (sugar content) into a concrete one (sugar cubes). It is also possible that, with videos, consumers can passively assimilate information with less effort than reading text instructions.
Introduction
Sugary foods and beverages, such as cookies, ice cream, carbonated beverages, and fruit juices, are popular among consumers of almost all ages. Yet excessive sugar intake may be health-threatening, acting as a risk factor for health problems such as cardiovascular disease (Chen et al., 2010; Jayalath et al., 2015; Malik et al., 2010), diabetes (F. B. Hu, 2013), and fatty liver (Assy et al., 2008), to name a few. Due to improvements in nutrition and health awareness among the general public, the proportion of carbonated and flavored drinks in one’s diet has declined in recent years, accompanied by increased consumption of compound fruit juices (Q. R. Zhang et al., 2021). However, as healthy as fruit juices can be, their high sugar content is often overlooked (Duffy et al., 2021). In particular, the healthy image of fruits may form a positive impression of fruit juices in consumer perception, masking their high sugar content through a “halo” effect (Shefferly et al., 2016), a cognitive bias that often arises when a favorable claim on the packaging influences consumers’ judgment of other product attributes not mentioned on the packaging (Centurión et al., 2019; Hall et al., 2020; Roe et al., 1999). Even products labeled with “fruit sugar” are deemed healthier than those labeled with just “sugar” (Sutterlin & Siegrist, 2015). Positively sounding nutrition claims printed on product packages, such as “natural” and “vitamins,” may further aggravate the halo effect (André et al., 2019).
Partly due to the halo effect, many consumers are reluctant to classify fruit juices, especially “100%” ones, as sugary beverages (Bolling et al., 2009). Many sugar-controlling initiatives also precluded fruit juices as their target product. In Mexico and England, for instance, most tax policies regulating the consumption of high-sugar foods do not apply to fruit juices (Sah et al., 2021). As such, the halo effect not only poses potential health risks to juice consumers but also complicates the formulation of related policies. With the presence of the halo effect, how to correct the general public’s misunderstanding of fruit juices’ nutritional (sugar) content is a question of great policy relevance.
The present study attempts to provide an answer, at least a partial one, by investigating how exogenously provided information on sugar content may affect consumers’ choice of orange juice, the most common juice product on the market. A discrete choice experiment (DCE) involving four attributes (fruit-juice concentration, sugar content, taste, and price) and four information treatments (in the form of text messages and short videos) was conducted in Beijing, the Capital City of China. China currently ranks No. 3 worldwide in sugar consumption, and per capita consumption has increased year by year due to rapid income growth (Liu et al., 2022). Although its per capita sugar intake is still low compared with most Western countries, China’s rapid increase in sugar consumption triggers concern about its potential contribution to the country’s overweight epidemic—from 1991 to 2011, overweight and obesity prevalence among children (6–17 years) increased from 4.3% and 2.4% to 11.5% and 10.5%, respectively; the corresponding figures for adults increased from 16.8% and 3.8% to 31% and 11.3%, respectively (Pan et al., 2021). Since juice consumers in China mainly come from large cities with vibrant food markets like Beijing, insights from a study on Beijing consumers’ behavior can inform future consumption trends in China and other countries with large and active sugary beverage markets.
Inspired by the widespread popularity of smartphones and mobile networks in China (China Internet Network Information Center, 2022), our experiment emphasizes the role of internet-based self-media (also called “We Media”), one of today’s essential channels for information dissemination, in steering consumer fruit juice choices. Specifically, we designed a short video treatment selected from a well- known We Media channel (Bilibili), along with three text-message treatments containing information on sugary drinks’ sugar content, and randomly sent one of these four treatments to each participant (N = 142–146 in each treatment group; another 147 participants in a randomly assigned control group received no such information). The video clip consists of a 5-min lecture delivered by a lab technician, which expresses the sugar content as the number of sugar-cube equivalents; the three text messages contain the same basic information but with different levels of specificity and detail.
Our analysis of data from the DCE and its companion survey yields three informative findings. First, the survey reveals a nontrivial halo effect. For example, even though over 92% of the participants were aware of the existence of sugar in fruit juices, more than half (56%) mistakenly believed that “drinking 100% fruit juices has the same effect as eating fresh fruits, which is completely good for one’s health.” Second, our mixed-logit models suggest that compared with the control group, a “treated” consumer’s likelihood of choosing “100% orange juice” is significantly lower in all treatment groups, suggesting an essential role of (exogenously-provided) sugar-content information in reducing sugary drinks consumption, even with the presence of a halo effect. Finally, while all four information treatments reduced consumers’ willingness to consume 100% orange juices, the video-clip treatment was the most effective, highlighting the potential role of online self-media in promoting nutrition literacy among beverage consumers.
Literature Review
Existing Approaches to Controlling Sugary Drink Consumption
As a major channel for many consumers’ sugar intake and consumption worldwide, sugary drinks have attracted considerable attention from researchers and policymakers (Zenone et al., 2021). One particular concern is that a typical sugary drink contains more sugar than the recommended daily intake level (WHO, 2015). As the general public’s nutrition and health awareness have improved in recent decades, attention has increased to strategies that may help reduce sugary beverage consumption (Popkin & Hawkes, 2016). Two approaches have been widely examined in the literature. The first is sugar taxes. Recent studies from the U.K. and the U.S. suggest that taxes on sugary drinks effectively reduce consumers' likelihood of choosing these drinks (Cawley et al., 2020; Cornelsen et al., 2020). The second approach concerns nutrition-content labels, which often include warnings, health stars, and nutrition levels. Compared with other types of labels, “high in X” labels (where X = sugar, fat, etc.) were found to be more effective at reducing the consumption of targeted nutrients (Acton & Hammond, 2018; Acton et al., 2019).
The labels used for sugary beverages mainly include traffic-light and sugar-teaspoon labels. The former uses three colors (red, yellow, and green) to signal different levels (high, medium, and low) of nutrients per 100 ml (100 g) of a drink. Recent experimental evidence suggests that consumers exposed to color-coded labels are more likely to avoid unhealthy food choices and seek healthier options (Defago et al., 2020; Thorndike et al., 2012). Compared with traffic-light labels, sugar-teaspoon labels provide more vivid and detailed visual representations of sugar content, i.e., the number of sugar cubes or sugar teaspoons per serving of a drink. It has been found that when presented with specific information about sugar content (compared with abstract or no information), consumers felt more negatively toward sugary drinks and were less willing to consume them (Adams et al., 2014; Miller et al., 2024).
The Role of Video Persuasion
Effectiveness of Video Persuasion Compared With Text Messages
In addition to the aforementioned labels, video persuasion and intervention have been widely employed to enhance health by inducing changes in health knowledge and perceptions, attitudes, intentions, and behaviors (Abu Abed et al., 2014; Amaro et al., 2017; Ito-Jaeger et al., 2023; Juhong et al., 2022; Zhu et al., 2023), offering a new perspective for reducing the consumption of sugary drinks. Regarding information content and dissemination format, health-related videos can be broadly divided into three types: didactic, practice, and narrative presentations (Tuong et al., 2014). Of course, in the Digital Age, especially with the popularity of short videos, video content is not limited to these types.
Regarding the effectiveness of video persuasion, the “dual coding” theory suggests that individuals process information through two systems: one for visual information and one for verbal information (Paivio, 2013). Both systems are functional when watching videos, but the visual information processing system is suppressed when reading text messages, which renders the information in videos easier to digest. However, there has been no consensus in the existing literature on the effectiveness of video persuasion compared to text messages. Although many studies have pointed out that videos are more effective than text messages (Cheung et al., 2017; Walthouwer et al., 2015), some recent studies have provided new evidence showing no significant difference between videos and text messages in inducing behavioral changes (Aref et al., 2024; Vandelanotte et al., 2021). Thus, how videos may be used to effectively induce healthy behavior remains to be explored.
The Role of Video Content
One factor to consider is the content of videos. The explosive growth of short videos on online self-media platforms such as Bilibili and TikTok provides new carriers of nutrition and health information. Through eye-catching expressions, short videos offer audiences greater immersion, intuitiveness, and authenticity than text messages and have become increasingly popular on online self-media (Eghtesadi & Florea, 2020). Along with other content, such as sports and education, health-related information is also popular, and the rapid development of online self-media greatly facilitates its dissemination (Bora et al., 2018; Song et al., 2021). How to utilize such short video platforms to improve public health has become a hotly debated topic among health researchers and practitioners (Eghtesadi & Florea, 2020). For example, animated videos, a popular type of media, have been explored for their role in promoting improvements in health behavior (Supady et al., 2023; Vandormael et al., 2021). However, compared with animated videos, videos featuring people as the main subjects are more prevalent and generally more preferred by video viewers, which is also a factor to consider in the present study.
The Role of Platforms
Platforms also play a role. By providing ample opportunities for information sharing, online self-media has become a low-cost and efficient platform with great potential for further development (Mehmet et al., 2020). Traditionally, video interventions have limited effectiveness due to a lack of customization (Tuong et al., 2014). Today’s media platforms can circumvent this problem by using users’ search and viewing history to recommend content relevant to their interests and needs. Yet the quick and widespread dissemination of information facilitated by online self-media presents both opportunities and challenges for public health awareness. While it helps promote public health awareness by spreading knowledge about new medical developments and health-policy updates (Li et al., 2022; Vandormael et al., 2021), the constant spread of misinformation and the heavy mental burden of processing new information also create cognitive barriers that undermine public health awareness (Syed-Abdul et al., 2013). These opportunities and challenges suggest that for self-media to be an effective channel for popularizing nutrition and health information, ensuring the authenticity and reliability of the information disseminated is key (Madathil et al., 2015).
Gaps in Knowledge
Despite increasing interest among scholars and policymakers in the role of online self-media in promoting healthy food consumption, little attention has been paid to the sugar content of fruit juices and possible self-media interventions to increase consumers’ awareness. In addition to the general lack of understanding of sugary drinks’ sugar content, the healthy image of fruit creates a halo effect for fruit juice, leading consumers to believe that the latter is equally healthy; partly because of this, much of the world population has been loyal fruit juice consumers (Luckow & Delahunty, 2004). Yet, despite the many healthy nutrients in fruit juices that are absent in sugar-sweetened beverages (Mullen et al., 2008; Pereira-Caro et al., 2014), the high sugar content of fruit juices is often overlooked by the public. Even though “100% not-from-concentrate” juices contain no added sugar, they usually contain 80% to 130% of the fructose content of sugar-sweetened beverages, the excessive consumption of which is harmful to health (Walker et al., 2014). For example, research has shown that fruit juice intake is associated with an increased risk of diabetes (Bazzano et al., 2008). Indeed, the WHO (2015) recommended reducing the intake of fructose and other free sugars to below 10% of one’s daily energy intake. It is, therefore, imperative to inform consumers about the sugar content of fruit juices and the health risks associated with consuming them.
However, relevant studies rarely exist. Most existing studies on fruit-juice consumption examined how packaging (Pal et al., 2017), labeling (Schouteten et al., 2019), claims (Sabbe et al., 2009; Vidigal et al., 2011), and juice-processing technologies (Lee et al., 2016) affect consumers’ juice choice. It is encouraging, however, to see that studies aimed at reducing the consumption of other sugary foods using treatments such as “sugar content” labels have been increasing (Jindahra & Phumpradab, 2023; Jürkenbeck et al., 2022; Stoltze et al., 2021). To contribute to this emerging literature, we examine how different ways of providing information on the sugar content of fruit juices may affect consumers’ choices through a DCE. Our experimental design builds on insights from the literature discussed above, especially regarding the selection of intervention approaches and information carriers.
Experimental Design
Basic Design
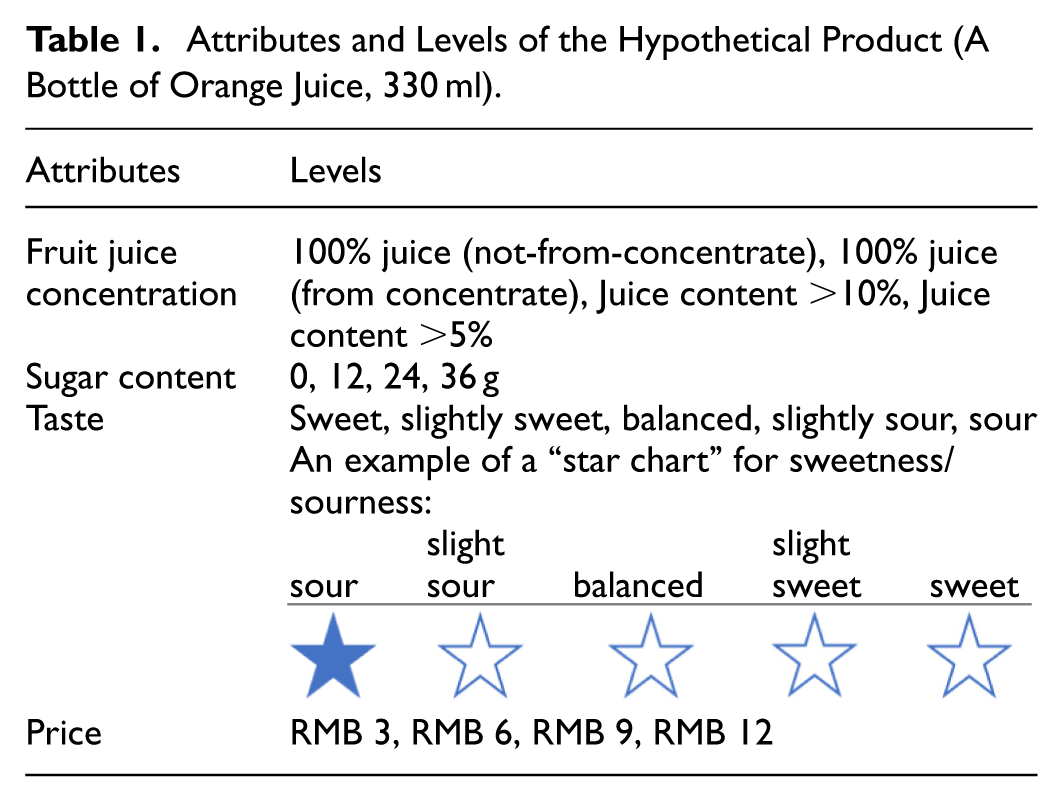
We chose orange juice, the most common juice product in the market, as the focal product in the DCE. To avoid biases stemming from consumers’ preferences for specific brands, we named the product “Orange Desired,” a hypothetical new brand with no connection with existing brands. Participants were informed that the products to choose from were bottles of orange juice (330 ml/bottle) stored at room temperature, characterized by four attributes, each with 4 to 5 levels (Table 1):
Attributes and Levels of the Hypothetical Product (A Bottle of Orange Juice, 330 ml).
Fruit-Juice Concentration
By the level of juice concentration, fruit juices can be divided into “100%” and “non-100% juice” products. The former includes “not-from-concentrate (NFC)” 100% fruit juices, which are processed directly from fresh fruits, and “from-concentrate (FC)” 100% fruit juices made from concentrated juices with fresh water. “Non-100%” juices are all “FC” but with different concentrations. Based on the classification method provided by China’s National Standard (GB/T31121-2014), four levels were set for this attribute: “100% juice (NFC),”“100% juice (FC),”“juice >10% (FC),” and “juice >5% (FC).”
Sugar Content
Sugary drinks can also be classified by based on sugar content: sugar-free, low-sugar, and ordinary. “Sugar-free” means that the beverage contains no more than 0.5 g of sugar per 100 ml (or 100 g). “Low-sugar” means that the sugar content does not exceed 5 g/100 ml (or 100 g). “Ordinary” drinks contain more than 5 g/100 ml (or 100 g) of sugar. To ensure that our experiment covered all three categories, we set four levels for a bottle of orange juice: 0 g (sugar-free), 12 g (low-sugar), 24 g (ordinary), and 36 g (ordinary). Currently, there are no completely sugar-free fruit juices on the market, but as food development moves forward, it is helpful to explore consumers’ preferences and attitudes towards such products.
Note also that the sugar content of juices in this study refers to the total sugar content without distinguishing between fructose, sucrose, and glucose. There are two reasons for this design. First, the distinction between sucrose, glucose, and fructose is difficult for most consumers to understand. Introducing specific types of sugars could complicate consumer choices and render our findings difficult to interpret. Second, existing food products usually present sugar content in the standard nutritional composition tables and food labels. As such, designing the sugar content attribute in our DCE as total sugar content more closely mirrors the real-life context in which consumers make food choices, thus helping to elicit more accurate consumer responses.
Taste
Naturally, taste matters for consumers’ beverage choices. Five levels were set to capture its role: sweet, slightly sweet, balanced, slightly sour, and sour. Following Acton et al. (2019), we use a “star chart” to characterize the degree of sourness/sweetness (Table 1) and help consumers understand these levels more easily.
Price
Price is an essential component in any demand analysis. Given the current price range (3–10 RMB/bottle, roughly 0.5–1.5 US dollars) of orange juices in China, we chose four price levels for a bottle within the 3-to-12 RMB (about 0.5–1.8 US dollars) range, with equal increments of 3 RMB (about 0.5 US dollars).
Product-Profile Creation
The above design yields 320(= 4×4×5×4) potential orange-juice profiles. Such a large number imposes a heavy mental burden on consumers when making choices. An orthogonal fractional factorial design (Louviere et al., 2000) was thus used to reduce the number of product profiles to 100. The resultant profiles were divided into 10 blocks, each containing 10 single-choice questions, using blocking techniques. Participants were randomly assigned to one of the 10 blocks in the DCE. Figure 1 illustrates an actual choice task used in the DCE.

An actual choice set used in the experiment.
Information Intervention
To better understand how consumers’ fruit juice choices respond to exogenously provided information on sugar content, we designed four treatments based on three lessons from the literature. The first concerns the choice of intervention approaches. Although China’s per capita sugar intake has been rising, it has not yet reached the level that triggered tax interventions in Western countries; thus, sugar taxes may not be a realistic option in the Chinese context. Our intervention, instead, is based on the idea of nutrition labels.
The second lesson concerns the choice of labels, particularly between traffic-light and sugar-teaspoon labels. The literature suggests that sugar-teaspoon labels tend to convey information more directly and clearly than traffic-light labels, thus being more effective at helping consumers make healthier choices (Mauri et al., 2021). Therefore, we tied our treatments to sugar-teaspoon labels: sugar content is presented as the number of sugar-cube equivalents in a sugary drink.
The third lesson regards the choice of information carriers. Existing studies seldom compare the effectiveness of different information carriers. To shed light on this issue, we designed four treatments in the form of text messages and short video clips (Table 2). The first, “basic information” treatment (T1), briefly notes that the sugar content of fruit juice is high (measured in sugar cube equivalents) and that excessive sugar intake may cause disease. The second treatment (T2), “basic information + authoritative source,” adds the WHO-recommended sugar intake level (WHO, 2015) to T1. The third treatment (T3), “information + authoritative source + specific figures,” further adds specific figures on the sugar contents of various drinks and their potential harm, again referencing WHO (2015). The last treatment (T4) delivers the same content as T3 but uses a short video as the information carrier.
Contents of Information Treatments.

Source. Author’s design.
Note. Figure 2 shows several screenshots of the video clip involved in T4.
Since the main characters in existing health information videos are mostly hospitals (rather than human characters), which do not align with those in the present-day mainstream self-media, we chose a short video featuring a lab technician frequently spotted on online self-media as the basis for our video treatment. To find a video suitable for this study, the research team browsed hundreds of videos on popular social media apps on the topic of “sugar in beverages” in China. After discussing with other experts, we excluded videos that were either considered “boring” (e.g., those focusing on the principle that “sugar is bad for health”), very subjective, or those promoting a specific product to avoid offending participants. Several screenshots of the chosen video clip are presented in Figure 2.
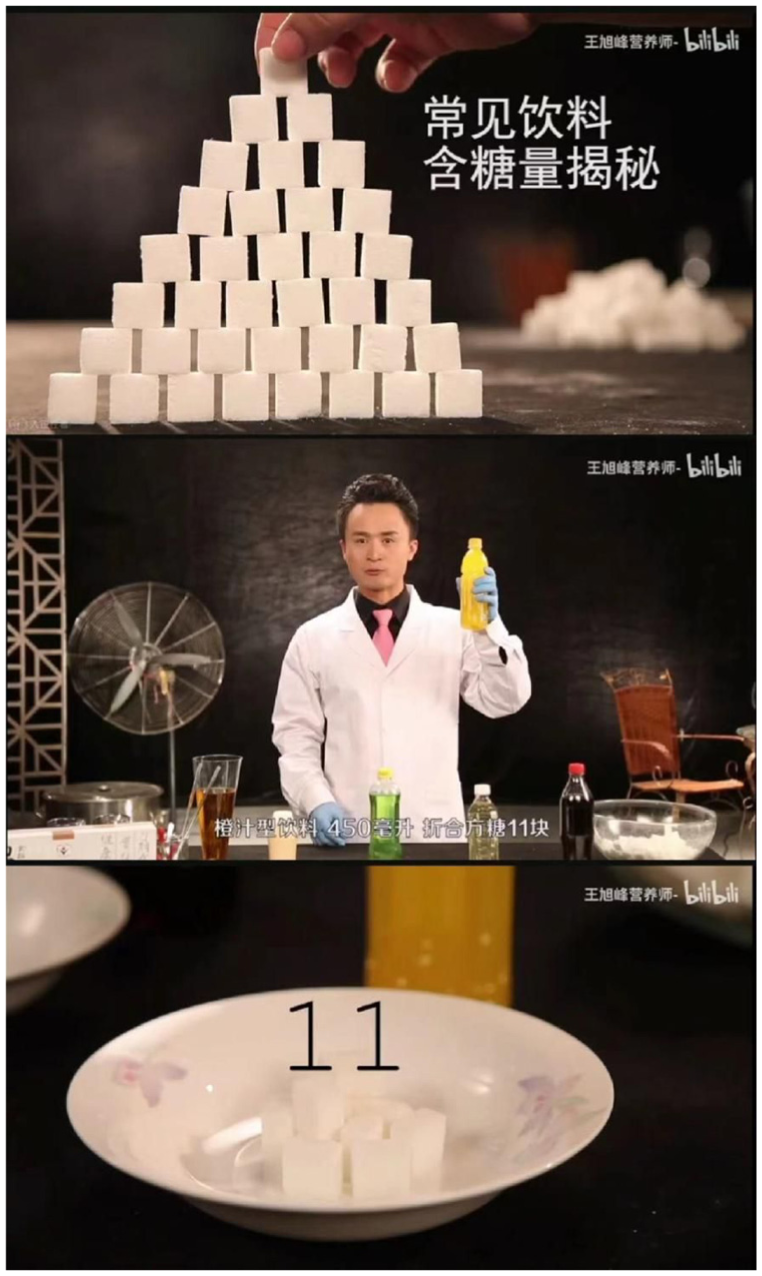
Screenshots of the video presented to DCE participants.
Quality Control
To urge the participants to make their choices carefully, we asked them to check the following statement before the choice tasks started: “I will provide honest answers throughout the experiment.” A note was also provided to remind them to read the instructions about the choice task carefully before making choices. We further included an example choice task in the questionnaire, with detailed explanations of the attributes of juice alternatives, to ensure participants understood how to make choices based on their preferences and budget constraints.
To make the choice scenario as realistic as possible, a cheap-talk script was included to remind participants to imagine facing various juice products in the market when making their choices. The cheap-talk script reads: “Similar surveys have found that people tend to overestimate how much they are willing to pay for a given product. Please behave as you would if you had to pay for the product and take it home. Next, suppose you are going to buy a bottle of orange juice at a supermarket that offers a range of juice products. Please choose the product you prefer the most from the options, subject to your daily budget.”
Survey and Data
The study was conducted in accordance with the Declaration of Helsinki and was approved by the Human Research Ethics Committee of China Agricultural University. A pilot survey involving 68 participants was conducted in April 2022 to test the validity of the experimental design and the questionnaire’s content. The formal survey, involving 725 participants from Beijing, was implemented in September 2022 through Questionnaire Star, the largest online survey platform in China. This platform, powered by Changsha Ranxing IT Ltd., provides functions equivalent to those of Amazon Mechanical Turk. With the ability to reach nearly 300 million users per month, the platform can filter out specific target groups and control data quality using techniques such as IP restrictions, trap questions, and similarity detection. Of particular importance to our study is that the platform allows us to incorporate videos in the questionnaire through a web link.
During the online survey, informed consent was obtained from all the participants (by choosing the “consent” option). They were informed about the purpose of the study and the minimal harm their participation may impose on them at the beginning of the survey. The participants were also informed that they could stop at any point during the study for any reason. The survey lasted 3 to 5 minutes per participant, depending on the information provided. Each participant received an allowance of 11 RMB (≈1.7 US dollars) for their participation; the payment was nearly twice the average wage that employed workers in Beijing would earn in 5 minutes in 2022—the average monthly wage in 2022 was 13,369 RMB (≈2,057 US dollars) in Beijing (https://www.beijing.gov.cn/ywdt/gzdt/202211/t20221121_2863122.html accessed: August 4, 2025). Thus, the participants were fully compensated for their time spent participating in our study. The health information they received during the study may lead to additional health benefits for them in the future.
We opted to conduct the DCE online for three reasons. First, online survey platforms provide a more convenient way to deliver video messages than in-person surveys. Second, an online intervention naturally takes advantage of consumers’ access to online self-media; by using cell phones or computers to complete the choice tasks, they can pause the video at any time desired. Moreover, due to the COVID-19 pandemic, online participants may have become much more representative of the food-/juice-shopper population than in the pre-pandemic period. In fact, given Beijing’s frequent lockdowns in the past few years and the rapid development of online shopping systems (e.g., Hema, Meituan, and Elema) during the pandemic, many food shoppers have chosen online shopping as the primary food-purchasing method (Beijing Municipal Bureau of Statistics, 2021; Ministry of Commerce, 2020). This shift in primary food-purchasing methods may continue in the years to come. Currently, consumers who mainly purchase foods at supermarkets and grocery stores tend to be older, less educated, and unfamiliar with digital technology; they may not represent the juice-consumer population of interest to our study.
Questionnaires with different choice tasks were randomly distributed to the participants through Questionnaire Star. The platform used two methods to ensure that each participant completed the questionnaire only once. First, it linked accounts in the user pool to users’ unique ID card numbers, WeChat verification, and facial recognition, allowing each account to have at most one completed questionnaire submission. Second, the link sent to the participants was specially programmed so that once the completed questionnaire had been submitted, the link became invalid and could not be reopened or forwarded to another participant. To assess the quality of randomization, a Chi-square test of the similarity in socio-demographic characteristics across subgroups (four treatment groups and one control group), collected after the DCE choice tasks were completed, was performed. The test detected no statistically significant between-group differences (Table 3).
Balance in Socio-Demographic Characteristics of Participants Across Groups.

Source. Author’s survey.
Admittedly, collecting data through a third-party platform has several drawbacks. In particular, respondents participating through online survey panels may answer questions differently from the general population. One may expect the participants to be more interested in juice consumption than non-participants. Nonetheless, many recent studies (Bartneck et al., 2015; Casler et al., 2013; Lindhjem and Navrud, 2011; Windle and Rolfe, 2011) have demonstrated the reliability of stated-preference studies conducted with online participants. Recent studies using data collected through Questionnaire Star have also yielded important findings (Ning et al., 2020; H. S. Wang et al., 2023; Zheng and Zheng, 2014). Even if the participants are more interested in juice consumption than non-participants, the former’s preferences for orange juices are likely tainted with a stronger halo effect. As such, they still serve as a relevant sample for studying potential approaches to reducing sugary drink consumption with the presence of a halo effect.
Analytical Framework
To assess how information provided on online self-media may help reduce the likelihood of choosing sugary fruit juices, we developed an analytical framework based on McFadden’s (1974) random utility theory. In this framework, the impacts of information treatments can be modeled as following certain distributions (rather than being fixed parameters) whose variations are potentially affected by those in the attributes discussed in “Experimental Design” section, such as sugar content and taste (Train, 2009). Specifically, assume that the utility (

where

where
Following the standard practice in the recent DCE literature, we estimated the parameters in Equation (2) using mixed-logit models (Train, 2009). Compared with conventional models, such as multinomial-logit and conditional-logit, mixed-logit is more flexible. By relaxing the “independence of irrelevant alternatives” restriction, mixed-logit allows for unobserved heterogeneity captured by random coefficients on the attribute-level combinations, which can be affected by our information treatments. Following Ortega et al. (2016), Revelt and Train (1998), and Tonsor et al. (2009), among others, we treated the coefficients of prices (
To further assess the effects of our information treatments, we further included interaction terms between the treatment-group dummies,
Results
Participant Profiles, Use of Online Media, and Cognition of Fruit Juices
Table 4 summarizes the participants’ socio-demographic characteristics. 61% are female. The largest group was 26 to 30 years old at the time of the survey, with a university degree and a monthly household income of 10,000-19,999 RMB (roughly 1,480–2,960 US dollars). While the participants were younger and better educated than the Beijing population, they shared a similar socio-demographic profile with beverage/juice consumers in China (Ye et al., 2005), the target population of our study.
Socio-Demographic Characteristics of Respondents.

Source. Author’s survey.
Table 5 reports participants’ use of online media, revealing the popularity of online media and the large amount of time participants spend watching short videos online. Eighty-one percent of participants often watch short videos online, far exceeding the proportion who often read text information (48.69%). Notably, the proportion of participants who watch short videos for over 2 hr/day is almost twice that of those who read text information for over 2 hr/day. Given the high frequency and long time spent watching short videos, the information they provide will likely impact consumers’ behavior in a notable way.
Respondents’ Use of Short Videos and Text Information.

Source. Author’s survey.
Table 6 shows participants’ cognition of fruit juices and their sugar content, assessed by seven questions, revealing a potentially nontrivial halo effect. For example, 56% of the participants mistakenly believed that “Drinking 100% fruit juices has the same effect as eating fresh fruits, which is completely good for one’s health” (Table 6, question 1), even though the vast majority (>92%) were aware of the existence of sugar in fruit juices (Table 6, questions 3 and 6). The existence of a halo effect was also evident when comparing answers from residents of different districts in Beijing. For example, Xicheng and Haidian, the two most affluent urban districts of Beijing, have the highest income and education levels among all Beijing districts. Still, their residents’ correct-answer rates are the lowest among all six inner-city districts in Beijing. In particular, even though Xicheng residents had the highest correct-answer rates for questions 5 (“The sugar content of 100% fruit juices is almost negligible”, 91.23%) and 7 (“Reducing sugar intake will benefit one’s health, e.g., by reducing the risk of some diseases,” 84.21%), nearly two-thirds Xicheng participants mistakenly answered question 1 (“Drinking 100% fruit juices has the same effect as eating fresh fruits, which is completely good for one’s health”).
Respondents of Cognition of Fruit Juice.

Source. Author’s survey.
To assess whether participants have a cognitive bias (in particular, underestimation) in estimating the sugar content of orange juice, we informed them that the total sugar content of a bottle of orange juice (330 ml) is equivalent to that of 8 sugar cubes (4.5 g) at the end of the survey. The results show that nearly three-quarters underestimated the sugar content of orange juice, reporting that 8 sugar cubes/bottle was “slightly” (38%) or “much” (35%) higher than they expected. Such underestimations provide further evidence of the halo effect of fruit juice drinks among Chinese consumers.
Estimation Results of Mixed-Logit Models
Roles of Product Attributes
Table 7 reports the results of estimating two mixed-logit models with 500 Halton draws using NLOGIT 5.0. Model 1 includes only the estimated random coefficients of juice attributes/levels. Model 2 further includes interactions between these attributes/levels and information-treatment dummies, allowing consumers’ preferences to differ across treatment groups. We opt to report findings of a large model with interaction terms rather than estimating the model separately for the five groups (four treatment groups and one control group) for two reasons. First, the former approach allows us to include more observations (from all five groups) in the model, thereby improving the precision of the estimates. Second, it allows us to test directly whether the between-group difference in the coefficients on the same explanatory variable (e.g., “100% NFC”), captured by the coefficient on the interaction term (e.g., “100% NFC × video (T4)”), is statistically significant, which is not feasible when the model is estimated separately for each group. Note that in a “full” interaction model in which all explanatory variables—even if their impacts are statistically insignificant—are fully interacted with group dummies (T1–T4), these two sets of estimates will be mathematically equivalent—one can recover coefficients in each group from between-group differences, and vice versa. For example, the coefficient on “100% NFC × video (T4)”, say,
Mixed-Logit Estimates.

Note. Mixed-logit estimates for each of the treatment groups are reported in Table A1. Standard errors in parentheses.
p < .01, **p < .05, *p < .1.
WTP Estimates for Different Groups (Unit: RMB).

Model 1 reveals three informative findings. First, in general, consumers prefer orange juices with higher juice concentrations to those with lower concentrations. Specifically, consumers prefer 100% orange juices (both FC and NFC), but not those with juice content >10%, to those with juice content >5% (the reference group). Corresponding to the positive coefficients of “100% FC” and “100% NFC” juices, consumers’ WTPs for these two attribute levels are 9.38 and 8.91 RMB, respectively (Table 8, column 1). Other things equal, the higher WTPs for 100% orange juices than for non-100% juices suggest a halo effect (Table 8).
Second, consumers prefer orange juices with relatively low sugar content to those with high sugar content. With reference to orange juice with 36 g sugar per bottle, consumers prefer sugar-free juice the most (
Finally, taste serves as an essential factor affecting consumers’ orange juice choices. Compared with orange juice with a sweet taste (the reference group), slightly sweet (
Effects of Sugar-Content Information
Model 2 further reveals the role of the exogenously provided sugar content information. Three findings are notable. First, all treatments reduced consumers’ likelihood of selecting NFC and FC juices. The WTPs for “100% orange juice” in all treatment groups are lower than those in the control group (Table 8, first and second rows). A possible explanation is that after receiving the treatments, consumers realized that fruit juices also pose potential health risks due to their high sugar content, thereby reducing their willingness to consume “100% orange juices.” It bears noting that the short-video treatment led to the largest reduction in the WTP for “100% NFC” juices, by 30.28% [=(10.93-7.62)/10.93], among all four treatments (Table 8, first row).
Second, the coefficients of “sugar × Tl” suggest that only the participants receiving the “basic information + authoritative source (T2)” and “video (T4)” treatments increased their likelihood of choosing lower-sugar orange juices significantly. Compared with the mean WTP for sugar-free juice in the control group (11.51 RMB), that in the video-treatment group (17 RMB), indicates a maximum increase of 47.70%. Presumably, the video helped consumers convert a vague concept (sugar content) into a concrete one (the number of sugar cubes) when making choices. Our survey after the DCE choice tasks showed that only 45% of the “control” participants converted sugar content into sugar cubes when making choices, compared to 67% in the video-treatment group.
Another possible reason is that, with videos, one can passively assimilate information with less effort than reading text instructions, which may require effort to engage (—we thank an anonymous reviewer for pointing this out). According to dual coding theory, individuals process information through two systems: one for visual information and one for verbal information (Paivio, 2013). Both systems are functional when watching videos, but the visual information processing system is suppressed when reading text messages, which renders the information in videos easier to understand. Additionally, processing visual stimuli involves a more automatic process, requiring minimal effort; in contrast, reading text often demands more active thought and engagement (Green & Brock, 2002). The “effort” effect is also supported by the insignificant impact of treatment T3, the “information + authoritative sources + specific figures.”T3 obviously contains more detailed information, but the many figures involved in the message may create information overload, inducing consumer anxiety and decision-making errors (H. F. Hu & Krishen, 2019).
Finally, only the video intervention has affected the choice of taste. The statistically positive coefficients of the “sour × video” interactions suggest that the video treatment significantly reduces consumers’ rejection of sour juices: they are willing to sacrifice taste for health.
Discussion and Conclusion
As public health awareness improves, consumers are paying closer attention to the nutritional content of foods and beverages. However, when it comes to fruit juices, their high sugar content is often overlooked, possibly masked by a halo effect generated by the positive image of fruits. Motivated by documented consumer misunderstanding of nutrition labels, this study explored the role of online self-media as an alternative means of conveying health and nutrition information to consumers. Based on a discrete choice experiment conducted in Beijing, China, we found that exogenously provided sugar content information reduced consumers’ likelihood of choosing high-sugar fruit juice. Among the four treatments, a short video treatment consisting of a 1.5-min lecture delivered by a lab technician expressing the sugar content as the number of sugar-cube equivalents had the most pronounced impact. It is likely that the video helped consumers convert a vague concept (sugar content) into a concrete one (the number of sugar cubes) when making choices. It is also possible that, with videos, consumers can passively assimilate information with less effort than reading text instructions. Echoing this “effort effect,” a text treatment with more details and figures had a less significant effect than a more concise text treatment containing the same basic information from authoritative sources. These findings suggest that while the government should encourage the dissemination of nutrition and health knowledge from authoritative sources through online self-media to induce healthy food choices among consumers, the specific content should be concise yet authoritative.
With these analyses and findings, our study makes two contributions to the literature. First, to our knowledge, this study is among the few that focus on the sugar content and halo effect of fruit (orange) juices, laying the groundwork for correcting misperceptions about the nutrient content of juice products. Second, regarding consumers’ juice choices, this study is among the first to assess the effectiveness of online self-media—short educational videos in particular—as an information carrier, helping inform policies on the use of social media to disseminate nutrition knowledge and correct public misperceptions.
From a policy perspective, several measures can be taken to facilitate the use of nutrition-education videos as a vehicle for health interventions. First, videos on the sugar content of popular fruit juices (e.g., apple, orange, and lemonade) on the market may be created, especially under the supervision of public health authorities. Second, user profiling may be performed to identify target fruit-juice consumer groups with specific demographic characteristics (e.g., age, gender, and education level) or health risks (e.g., young children, older adults, and patients with chronic diseases) (Romano et al., 2025; Harshbarger et al., 2021). Third, algorithms that help match specific consumer groups and suitable nutrition-education videos may be developed. Finally, effective influencers (e.g., public health institutions, celebrities, and renowned nutrition experts) may be hired to disseminate nutrition-education videos to their followers and, if appropriate, to a wider audience, thereby raising public health awareness and stimulating active information-seeking for health-related content.
Yet, while promoting nutrition-education videos through self-media is desirable as a means of health intervention, challenges remain. First, high production costs pose a challenge in tailoring video content to fit all major products and individual consumers’ specific needs. Due to the wide variety of fruit-juice products and their varying sugar content, it would be highly costly to create videos tailored to each product. A potential solution is to develop AI-customizable videos to achieve cost-effective personalized dissemination. While this investment requires additional cost, we believe it is worthwhile because self-media interventions may help reduce healthcare costs and generate health benefits at the societal level (Gentili et al., 2022; Stanczyk et al., 2014).
Second, platform dependency may constrain the dissemination and promotion of intervention videos, as they rely on specific platforms. Given the significant heterogeneity in user-group characteristics across different platforms, this dependence may create barriers for scaling up video-based interventions. A possible solution is to adopt a de-platformization strategy (e.g., using WeChat Mini Programs rather than apps) to eliminate platform dependency and cross-platform barriers in the dissemination of video-based health information.
The third challenge is the difficulty public health institutions face in ensuring consistent quality across educational videos produced by different content creators. Providing the public with health-knowledge training, setting qualification standards for content creators, and building a multi-partner collaboration system may help address this challenge. The WHO, for example, recently announced a partnership with TikTok to promote public health awareness (Daramola et al., 2025).
Finally, “algorithmic recommendation,” originally designed to provide personalized information sets tailored to individual interests, has evolved into “information cocoons,” a phenomenon characterized by narrowed user information intake (X. Zhang et al., 2023). This challenge might be addressed from the perspectives of content and technology, which is also worth exploring in future research. Regarding content, sensitive vocabulary should be avoided, and expressions should be used in line with spoken language and popular topics. It is also necessary to update the content and keywords of video interventions in a timely and regular manner (Kilb et al., 2022). Regarding technology, building a multi-channel dissemination system (e.g., via social networks and email) could help break “information cocoons.” For example, a characteristic-driven distribution algorithm based on multidimensional health data (e.g., body weight and exercise habits) associated with demographic data could be combined with interest-dependent recommendation algorithms.
Before closing, a note on the limitations of this study is in order. First of all, the reliance on a third-party online platform to conduct our experiment has inherent drawbacks, as discussed in the “Survey and Data” section. Even though a series of steps was taken to ensure survey quality, concerns remain. For example, as an anonymous reviewer pointed out, some participants who received different treatments may have discussed their answers before completing their choice tasks, especially when they come from the same household or office. By checking the responses’ IP addresses, we found that 126 participants share IP addresses with other participants, suggesting they may be employees working in the same office building. As a robustness check, we re-estimated our mixed-logit models, excluding these observations. The results (Table A2) are quite comparable to our estimates with the full sample (Table 7). Although these overlapping IP addresses did not pose a serious threat to our key findings, they raise concerns about the quality of the data collection (e.g., random sampling) conducted by the third-party platform.
Second, there are currently no completely sugar-free juice products on the market. Sugar-free drinks mainly use sweeteners to mimic the flavor of sugar. However, given its focus on the role of online self-media, our DCE did not consider additives, sweeteners, and other attributes. While our randomized treatment design ensures that omitting these attributes will not bias the estimated impacts of sugar content and information treatments, future research examining their impact will be fruitful.
Third, although video and text messages are used to design treatments, the information provided is still somewhat different from that encountered in real-life self-media. Future research that designs interventions closer to real-life self-media use shall yield more insights into the role online self-media can play. For example, consumers are often repeatedly exposed to messages with the same content (e.g., commercials) on online self-media, which may lead to further changes in consumer perceptions of sugary drinks compared to our one-shot interventions. To better mirror such real-life social media consumption patterns, future research could employ repeated exposure designs in the choice experiment. For example, the online survey platform can use IP tracking technology to follow consumers who have already participated in the one-shot intervention, resend them the educational video and survey questionnaires with choice tasks (perhaps with varying frequencies across individuals), and record their responses in the choice tasks. That way, the impact of one-shot interventions and that of repeated exposure can be distinguished.
Finally, while our experiment has shed some light on how to reduce consumers’ likelihood of choosing high-sugar fruit juices with the presence of a halo effect using information treatments, it lacks the power to assess the extent to which our treatments actually reduced the halo effect. Thus, future research should develop appropriate methods and indicators to measure the halo effect and quantify changes in the effect induced by well-designed treatments.
The literature has provided some useful guidance. For example, perceptions of nutrient content (Fernan et al., 2018; Stoltze et al., 2021; Z. Wang & Begho, 2024), increased perceived benefits, and reduced perceived risks (Choi & Reid, 2015; Choi et al., 2013; Lim et al., 2021) have been used to measure the halo effect of food products. In consumers’ minds, fruit juices are often associated with fresh fruits, which are considered rich in vitamins that can help improve health, vitality, and immune function, thereby contributing to their popularity. Given this cognitive association, future studies may be designed to capture the halo effect by asking consumers about the vitamin content in fruit juices, the health benefits it provides, and its ability to help avoid illness. Additionally, measuring and comparing respondents’ evaluations of fruit juices and fresh fruits regarding health benefits could also be a way to assess the halo effect. Finally, nutrition claims may also help. In the case of fruit juices, the positive image of vitamins may induce consumers to choose juices labeled “high in vitamins” and ignore their high sugar content. Thus, by designing juice products with nutrition labels such as “high in vitamins,”“high in vitamins and sugar,” and “high sugar,” the differences in consumer perceptions of the sugar content with these labels may serve as a measure of the halo effect.
Footnotes
Appendix
Mixed-Logit Estimates.

| Attributes/Levels | Model 1 | Model 2 | ||
|---|---|---|---|---|
| Mean of parameter | SD of parameter | Mean of parameter | SD of parameter | |
| 100% NFC | 1.045*** (0.079) | 1.162*** (0.076) | 1.452*** (0.167) | 1.134*** (0.077) |
| 100% FC | 0.944*** (0.076) | 1.058*** (0.079) | 1.394*** (0.176) | 1.067*** (0.803) |
| Juice content >10% (reference level: juice content >5%) |
−0.069 (0.085) | 1.114*** (0.095) | −0.192 (0.187) | 1.130*** (0.096) |
| Sugar 0 g | 1.307*** (0.093) | 1.634*** (0.090) | 1.105*** (0.171) | 1.629*** (0.091) |
| Sugar 12 g | 0.854*** (0.072) | 0.848*** (0.079) | 0.705*** (0.122) | 0.847*** (0.080) |
| Sugar 24 g (reference level: sugar 36 g) |
0.359*** (0.071) | 0.712*** (0.104) | 0.254*** (0.090) | 0.743*** (0.101) |
| Sour | −0.619*** (0.113) | 1.774*** (0.112) | −0.831*** (0.218) | 1.809*** (0.113) |
| Slightly-sour | −0.048 (0.081) | 0.954*** (0.097) | −0.134 (0.175) | 0.985*** (0.099) |
| Balanced | 0.366*** (0.075) | 0.832*** (0.093) | 0.237 (0.188) | 0.842*** (0.093) |
| Slightly-sweet (reference level: sweet) |
0.271*** (0.074) | 0.579*** (0.107) | 0.388** (0.170) | 0.587*** (0.104) |
| 100% NFC × basic information (T1) | −0.312 (0.221) | |||
| 100% NFC × basic information & authoritative source (T2) | −0.465** (0.234) | |||
| 100% NFC × information with specific figures & authoritative source (T3) | −0.493** (0.240) | |||
| 100% NFC × video (T4) | −1.144*** (0.238) | |||
| 100% FC × basic information (T1) | −0.559** (0.228) | |||
| 100% FC × basic information & authoritative source (T2) | −0.512** (0.233) | |||
| 100% FC × information with specific figures & authoritative source (T3) | −0.544** (0.235) | |||
| 100% FC × video (T4) | −0.868*** (0.239) | |||
| Juice content >10% × basic information (T1) | 0.174 (0.246) | |||
| Juice content >10% × basic information & authoritative source (T2) | 0.314 (0.256) | |||
| Juice content >10% × information with specific figures & authoritative source (T3) | 0.072 (0.244) | |||
| Juice content >10% × video (T4) | −0.115 (0.251) | |||
| Sugar × basic information (T1) | 0.006 (0.006) | |||
| Sugar × basic information & authoritative source (T2) | −0.015** (0.007) | |||
| Sugar × information with specific figures & authoritative source (T3) | 0.005 (0.007) | |||
| Sugar × video (T4) | −0.016** (0.007) | |||
| Sour × basic information (T1) | 0.215 (0.305) | |||
| Sour × basic information & authoritative source (T2) | 0.010 (0.325) | |||
| Sour × information with specific figures & authoritative source (T3) | 0.216 (0.331) | |||
| Sour × video (T4) | 0.797** (0.312) | |||
| Slightly-sour × basic information (T1) | 0.269 (0.236) | |||
| Slightly-sour × basic information & authoritative source (T2) | −0.291 (0.243) | |||
| Slightly-sour × information with specific figures & authoritative source (T3) | 0.130 (0.239) | |||
| Slightly-sour × video (T4) | 0.506* (0.265) | |||
| Balanced × basic information (T1) | −0.102 (0.247) | |||
| Balanced × basic information & authoritative source (T2) | 0.113 (0.239) | |||
| Balanced × information with specific figures & authoritative source (T3) | 0.009 (0.233) | |||
| Balanced × video (T4) | 0.373 (0.250) | |||
| Slightly-sweet × basic information (T1) | −0.061 (0.229) | |||
| Slightly-sweet × basic information & authoritative source (T2) | −0.164 (0.222) | |||
| Slightly-sweet × information with specific figures & authoritative source (T3) | −0.418 (0.229) | |||
| Slightly-sweet × video (T4) | 0.125 (0.228) | |||
| Price | −0.115*** (0.008) | −0.117*** (0.009) | ||
| ASC | −0.292* (0.102) | −0.335*** (0.106) | ||
| Log-likelihood | −8,303.903 | −6,668.148 | ||
| AIC | 13,456.8 | 13,444.3 | ||
| Mcfadden R2 | 0.192 | 0.197 | ||
| N | 599 | 599 | ||
Note. Standard errors in parentheses.
p < .01, **p < .05, *p < .1.
Acknowledgements
The authors thank Junfei Bai, Juerong Huang, Xiaoou Liu, Yanjun Ren, Tian Xu, Qiran Zhao, and Chen Zhu, as well as participants of the 2022 annual meeting of Beijing Agricultural Economists Association and the 2024 Chinese Conference on Agricultural and Foresty Economics and Management, for their helpful suggestions on several early versions of this paper.
Ethical Considerations
The study was conducted in accordance with the Declaration of Helsinki, and approved by the Human Research Ethics Committee of China Agricultural University (protocol code CAUHR-2020-05).
Consent to Participate
Informed consent was obtained from all subjects involved in the study.
Author Contributions
Jiale Bao and Qihui Chen—designed the study. Jiale Bao and Hongsha Wang—acquired the data, performed the research, and performed data analysis. Hongsha Wang and Qihui Chen—provided supervision and advice on data analysis and interpretation of findings. Jiale Bao, Qihui Chen, and Hongsha Wang—wrote and revised the manuscript. All authors have read and approved the final manuscript.
Funding
The authors disclosed receipt of the following financial support for the research, authorship, and/or publication of this article: This work was supported by the 2115 Talent Development Program of China Agricultural University. This research was funded by the National Natural Science Foundation, grant number 71973134. Support from the Beijing Food Safety Policy and Strategy Research Base is also gratefully acknowledged.
Declaration of Conflicting Interests
The authors declared no potential conflicts of interest with respect to the research, authorship, and/or publication of this article.
Data Availability Statement
Data analyzed in this study can be requested from the corresponding author.