
Abstract
While financial institutions grapple with mounting climate risks, their impact reverberates differently across the multifaceted dimensions of bank liquidity. Using a panel dataset of 166 countries (1999–2021) and employing two-stage instrumental variable least squares with Driscoll-Kraay standard errors, we examine how climate risk affects asset, funding, market, and systematic liquidity. Drawing upon precautionary liquidity hoarding and flight-to-safety theory, we find that climate risk adversely affects all liquidity dimensions except asset liquidity, as investors seek safer assets during environmental uncertainty. Our subsample analysis reveals that institutional characteristics significantly influence these effects: large and profitable banks benefit from flight-to-safety in funding liquidity despite systemic vulnerabilities, while smaller banks face heightened market and asset liquidity risks due to resource constraints. The impact varies across economic development levels, with low-income countries experiencing more severe systematic and funding liquidity challenges, while high-income countries show greater market liquidity vulnerability. This study advances the literature by providing the first comprehensive multi-dimensional analysis of climate risk-liquidity relationships, offering a nuanced theoretical framework that reconciles conflicting predictions across different liquidity types. Practically and policy-wise, our findings inform size-specific risk management strategies for financial institutions and underscore the necessity for differentiated regulatory approaches, including country-specific capital requirements and climate-adjusted stress testing that reflects heterogeneous impacts across bank sizes and economic development levels.
Plain Language Summary
Climate risk impacts bank liquidity differently across various dimensions. Our study shows that when climate risk increases, investors seek safer assets, affecting most liquidity types except asset liquidity. Bank characteristics matter: large, profitable banks actually gain funding liquidity during environmental uncertainty, while smaller banks face increased market and asset liquidity risks due to limited resources. Economic development also plays a role - low-income countries experience worse systematic and funding liquidity problems, while high-income countries see greater market liquidity vulnerability. These findings suggest that regulators need tailored approaches to address climate-related banking challenges rather than one-size-fits-all solutions.
Introduction
Climate change poses multifaceted threats not only to environmental quality (Conway et al., 2019) and social well-being (Onwutuebe, 2019; Owen, 2020), but also introduces complexity to economic and financial stability (Battiston et al., 2021; Monasterolo, 2020). Beyond its documented impact on macroeconomic indicators, climate risk significantly influences firm performance (Ferrat, 2021), costs (Kling et al., 2021), and decisions (Huang et al., 2018) through both physical and transition channels (C.-C. Lee, Wang, Thinh, & Xu, 2022). Consequently, financial advisers and central banks now guide institutional investors to assess their climate-related financial vulnerabilities and exposure (Battiston et al., 2021; Yahya, Lee, & Rashid, 2025; Zhai et al., 2024).
Extensive research has established climate risk’s impact on various firm outcomes including cost of debt (Fan et al., 2024; Kling et al., 2021), operating income (Pankratz et al., 2023), cash holding (Huynh et al., 2020), corporate risk-taking (Xu et al., 2022), and several other firm-level outcomes and activities (Ginglinger & Moreau, 2023; Huynh et al., 2020; Kanagaretnam et al., 2022; Lodh et al., 2024; Ozkan et al., 2023). However, empirical literature examining climate risk's effect across different liquidity dimensions remains notably scarce.
Existing studies investigating climate risk-liquidity relationships have primarily focused on single liquidity measures, consistently finding negative effects (Lang et al., 2023; C.-C. Lee, Wang, Thinh, & Xu, 2022). These studies suggest that climate risks impede liquidity through deposit withdrawals and loan portfolio deterioration, particularly when banks invest in climate-vulnerable sectors, resulting in heightened defaults and diminished asset values (Mirza et al., 2023; Su et al., 2022). However, this unidimensional approach overlooks the complex, potentially heterogeneous effects of climate risk across different liquidity types.
This study addresses this gap by examining climate risk’s differential impact on four distinct liquidity dimensions: asset, funding, market, and systematic liquidity. Disaggregating the liquidity into different types allows a focused evaluation of how climate risk affects the liquidity of a bank’s assets, ability to meet its short-term obligations, tradability of financial instruments in the markets, and simultaneous liquidity of the financial system. Asset liquidity ensures efficient buying and selling of individual assets (Loutzenhiser & Mann, 2021; Wagner, 2007), market liquidity fosters smooth overall market functioning (Haroon & Rizvi, 2020; Zaremba et al., 2021), funding liquidity facilitates access to short-term funding (Álvarez et al., 2019; Macchiavelli & Zhou, 2022), and systematic liquidity addresses interconnected risks in the financial system (Huberman & Halka, 2001; Macchiati et al., 2022; Qian et al., 2014), collectively contributing to financial stability. Thus, unlike previous studies by C.-C. Lee, Wang, Thinh, and Xu (2022) and Lang et al. (2023) that focus on only one class of liquidity—with C.-C. Lee, Wang, Thinh, and Xu (2022) employing bank liquidity creation and Lang et al. (2023) utilizing liquidity coverage ratio that are most directly tied to funding liquidity, as it involves banks’ ability to transform illiquid assets into liquid liabilities and maintain stable funding sources for their operations—our study explores the effect of climate risks on four different facets of liquidity.
From a flight-to-safety and precautionary liquidity hoarding perspective, our study argues that climate risk exhibits differential effects across underlying liquidity facets, challenging the uniform negative findings of previous single-dimension studies. When climate risks become more apparent, investors often seek safer and more liquid assets, leading to increased asset liquidity for certain securities, particularly government bonds and other safe-haven investments (Boutabba & Rannou, 2022; Mahanta et al., 2024). This flight-to-safety behavior results in investors moving their capital from riskier, climate-vulnerable assets to more secure options, enhancing the liquidity of these safer assets as trading volumes increase (F. Dong & Wen, 2025; Janus, 2023). Contrary to previous studies’ consistently negative findings, this theoretical perspective suggests that climate risk may positively affect asset liquidity through precautionary hoarding of liquid assets, while simultaneously creating negative effects on market, systematic, and funding liquidity.
Market liquidity suffers because the flight-to-safety response can lead to sudden and significant shifts in trading patterns, causing disruptions in price discovery and wider bid-ask spreads, particularly for assets perceived as climate-vulnerable (Z. Liu et al., 2024; J. Wu et al., 2024). Faced with climatic disruptions, investors may either demand a climate risk premium (Lemoine, 2021) or withdraw their investments (Huynh & Xia, 2023), leading to reduced market liquidity. The systematic liquidity of the overall financial system deteriorates as market participants become more risk-averse, reducing their willingness to provide liquidity across various asset classes and leading to potential market fragmentation. Additionally, climate-induced disruptions, such as supply chain interruptions (Ghadge et al., 2020) and escalated business costs (Fiedler et al., 2021; Ginglinger & Moreau, 2023), can trigger a cascading effect, impacting numerous financial institutions simultaneously (Monasterolo, 2020; Roncoroni et al., 2021). This interconnectedness amplifies the repercussions of liquidity challenges, ultimately contributing to a decline in systematic liquidity.
Funding liquidity faces particular challenges as climate risks intensify. Heightened levels of illiquid liabilities relative to liquid assets, exacerbated by climate-induced risks, directly impede funding liquidity, making it more arduous for institutions to secure stable short-term funding sources (Broeders et al., 2021). Financial institutions may become more cautious in their lending practices, especially to sectors or companies with high climate risk exposure (Battiston et al., 2021; Lamperti et al., 2021). This reluctance can lead to tighter lending conditions and higher funding costs, as lenders demand higher risk premiums or restrict access to credit altogether (Bechtel et al., 2023).
Given these theoretical considerations and empirical gaps in the literature, this study addresses the following research questions:
This study makes significant contributions to empirical research in four key aspects. Firstly, it pioneers the simultaneous examination of climate risk’s impact across four distinct liquidity dimensions, revealing heterogeneous effects that previous single-dimension studies with uniform negative findings have missed. Secondly, recognizing the absence of a comprehensive measure for systematic liquidity, this study introduces an index based on the financial cycle, interconnectedness between financial markets and institutions, and bank-level characteristics to assess concurrent liquidity in the financial system. Thirdly, in contrast to previous studies such as C.-C. Lee, Wang, Thinh, and Xu (2022) and Lang et al. (2023), which focused on samples of 56 and 23 countries, respectively, our study encompasses an initial sample of 166 countries spanning the period from 1999 to 2021. In addition, these studies ignored the issue of cross-sectional dependence (CD) which is vital for panel data analysis as it can lead to biased and inconsistent estimates if not properly addressed. To deal with the issue of CD and endogeneity simultaneously, we employ instrumental variable two-stage least square regression with Driscoll-Kraay estimator (IV-2SLS-DK). Lastly, our analysis demonstrates robustness across various subsamples, accounting for factors such as the bank profitability, bank size, and income level.
The subsequent sections of this paper are organized into distinct categories. The second section is dedicated to a comprehensive literature review and the establishment of the theoretical framework. The third section delves into the elucidation of the empirical model, measurement of the variables, and data description. Following this, the fourth section is devoted to the presentation of results, accompanied by pertinent discussions. Finally, the paper concludes with fifth section, summarizing the findings and presenting relevant implications, as well as suggesting potential avenues for future research.
Literature Review and Theoretical Framework
Climate change has emerged as a new financial risk due to its profound implications for the physical effects of climate change and the transition to a low-carbon economy across various sectors (Battiston et al., 2021). This relevance of climate risks extends to the financial stability of individual institutions (Roncoroni et al., 2021). Consequently, financial fragility, prompted by climate-related events, can result in liquidity challenges within the economy, thereby posing risks to both macroeconomic and microeconomic progress (Lang et al., 2023). The market microstructure theory posits that high liquidity risk may impede market participants in executing trades, resulting in wider bid-ask spreads and increased transaction costs (Schwartz, 2010). In addition, lower liquidity increases financial instability (Djebali & Zaghdoudi, 2020), market volatility (Qiao et al., 2020), and alter credit conditions (J. Wang, 2023; Wei et al., 2023). Nevertheless, climate risk manifests through diverse channels, exhibiting varying impacts on distinct types of liquidity owing to the unique characteristics inherent in each type of liquidity. The relevant literature on asset, funding, market, and systematic liquidity is illuminated in the subsequent sections.
Asset Liquidity
Fundamentally, asset liquidity refers to the ability of an asset to be easily converted into cash. The Basel III framework require banks to hold an adequate amount of liquid assets to cope with external shocks (Alaoui Mdaghri & Oubdi, 2022). Liquid assets can be swiftly exchanged for cash with minimal loss of value (Amihud & Mendelson, 1991). According to the valuation uncertainty hypothesis, firms with greater liquid assets typically experience lower valuation uncertainty compared to those with non-liquid assets (Charoenwong et al., 2014). Therefore, empirical studies associated asset volatility with higher stock liquidity (Gopalan et al., 2012), higher asset prices (Cui & Radde, 2020), less financial constraints (Gavazza, 2010), and optimal capital structures (Sibilkov, 2009). Liquid assets inherently exhibit a degree of resilience in the face of economic uncertainty.
The precautionary liquidity hoarding theory (V. V. Acharya & Merrouche, 2013) provides strong theoretical foundation for the positive relationship between climate risk and asset liquidity. During periods of uncertainty, banks exhibit a strong tendency to hoard liquid assets as a precautionary buffer against unexpected shocks and future losses (Berger et al., 2022). This precautionary motive for liquidity hoarding is well-documented in the banking literature, with empirical evidence showing that banks build up liquidity in anticipation of future expected losses and adverse market conditions (Berrospide, 2021). The precautionary hoarding behavior is particularly pronounced during periods of heightened uncertainty, where banks increase their liquid asset holdings to ensure they can meet unexpected funding needs and regulatory requirements.
Climate risk represents a unique form of systemic uncertainty that triggers this precautionary behavior. Unlike other forms of risk that may affect specific market segments, climate risk creates widespread uncertainty about future economic conditions, asset valuations, and regulatory responses, prompting banks to maintain higher liquidity buffers. Recent empirical evidence strongly supports this mechanism that firms choose less risky financing decisions during times of uncertainty. The study by Ashraf et al. (2022) based on 6,834 publicly listed US non-financial firms suggest that firms raise capital more frequently with a preference toward debt financing during times of elevated uncertainty. They argue that firms prefer debt financing over equity financing to avoid ownership dilution and high equity premia. Similarly, as evident from Indian banks, Bhatia (2024) demonstrates that banks choose to build up liquidity in anticipation of future expected losses, consistent with theoretical explanations for the precautionary motive of liquidity hoarding.
The flight-to-safety mechanism further reinforces this positive relationship. As climate risk increases, financial institutions anticipate potential market disruptions and losses from climate-related events, leading them to maintain higher levels of liquid assets as a precautionary measure (D’Orazio, 2021). S. Lee and Alam (2024) support this notion and found that elevated climate risk reduces bank profitability, with liquidity creation activities acting as the key transmission channel—reflecting that banks retain more liquid assets in response to climate uncertainty. This behavior aligns with flight-to-safety theory, where institutions shift their portfolios toward more liquid assets during periods of uncertainty to ensure they can quickly respond to sudden market changes or customer demands (F. Dong & Wen, 2025; Kekre & Lenel, 2024). The empirical evidence from Yang et al. (2024) based on China’s insurance industry provides direct support, showing elevated current asset ratios in regions facing greater climate risks.
Financial institutions typically respond by maintaining higher liquidity buffers to safeguard against potential asset devaluation, unexpected deposit withdrawals, and the need for rapid capital reallocation. This precautionary accumulation of liquid assets represents a rational response to climate-induced uncertainty, distinguishing asset liquidity from other liquidity dimensions that may face external market pressures. Building on this evidence and the underlying theoretical framework, we propose:
Funding Liquidity
Divergent perspectives exist regarding the role of funding liquidity in financial systems. One school of thought contends that funding liquidity, often measured through deposits financing, can incentivize excessive risk-taking and create moral hazard issues, ultimately contributing to financial fragility (Dahir et al., 2018; Khan et al., 2017; Smaoui et al., 2020). Conversely, another body of empirical evidence highlights the crucial role of funding liquidity in ensuring the smooth operation of financial markets and institutions. This facet enables financial institutions to promptly meet short-term obligations, instilling confidence among investors and counterparties. Beyond this, funding liquidity, akin to asset volatility, serves to mitigate market volatility (Kocaarslan & Soytas, 2021), bolster stock liquidity (Macchiavelli & Zhou, 2022), and proves pivotal in times of financial crises (Drehmann & Nikolaou, 2013). Moreover, funding liquidity is indispensable for the survival of domestic firms, the primary engines of economic growth (Berger et al., 2017), as it allows banks with ample funding liquidity to extend lending activities to these firms (V. Acharya & Naqvi, 2012), supporting their financial needs and averting exposure to liquidity constraints (V. V. Acharya & Merrouche, 2013).
In times of economic uncertainty, robust funding liquidity acts as a buffer, helping institutions weather shocks and maintain their essential role in supporting economic activities (Smaoui et al., 2020). Overall, funding liquidity is fundamental for sustaining financial resilience, fostering economic development, and ensuring the stability of the broader financial ecosystem (Aikman et al., 2019). On the other hand, the economic disruptions caused by climate events can impact the overall financial landscape, leading to a reduction in investor confidence (Christophers, 2019; Pankratz et al., 2023). This diminished confidence may result in a decreased willingness of depositors to keep funds within banks (Cubillas et al., 2021), potentially reducing the overall pool of bank deposits and, consequently, influencing funding liquidity. When faced with climate-related threats, depositors may exhibit heightened sensitivity to perceived risks, potentially leading to altered deposit patterns or withdrawals. This behavior can create challenges for banks in maintaining stable funding sources. Recent empirical evidence supports this theoretical framework, with both C.-C. Lee, Wang, Thinh, and Xu (2022) and Lang et al. (2023) documenting a significant negative relationship between climate risk exposure and financial institutions’ funding liquidity. Drawing from these theoretical arguments and empirical findings, we propose:
Market Liquidity
Not only does climate risk impact banking-level liquidity, but it also extends its influence to the liquidity of capital markets. Investors, anticipating a carbon risk premium amid heightened exposure to transition risk (Alessi et al., 2021; Bolton & Kacperczyk, 2021; Hsu et al., 2023), prioritize safeguarding their investments (Monasterolo & De Angelis, 2020). Consequently, during environmentally turbulent periods, investors tend to shift their portfolios from firms with high transition risk to those with lower transition risk, seeking higher returns (Reboredo & Ugolini, 2022). Lanfear et al. (2019), in their analysis of natural disaster risk on market anomalies, highlighted that extreme events contribute to stock illiquidity, particularly affecting small and growth firms. Similarly, Rehse et al. (2019) demonstrated the adverse effects of climate risk on market functioning, using Hurricane Sandy as a natural experiment. They observed widened bid-ask spreads and reduced trading activities during the occurrence of natural disasters in the market. Another empirical evidence by Z. Liu et al. (2024) found positive effect of climate change exposure on stock liquidity commonality. Based on the theoretical and empirical evidence, we propose the following:
Systematic Liquidity
Systematic or systemic liquidity, defined as “the risk of simultaneous liquidity difficulties at multiple financial institutions” by the International Monetary Fund (Macchiati et al., 2022), stands out as one of the most potent and financially contagious liquidity issues. Existing studies underscore that an initial shock impacting a single bank holds the potential to trigger a domino effect, leading to a systemic financial collapse due to the interconnectedness of financial institutions in the capital market (Bakoush et al., 2019; Qi et al., 2022). The repercussions of systematic liquidity risk or simultaneous liquidity shortfalls can extend to financial and sovereign debt crises (Macchiati et al., 2022). Given the susceptibility of systematic risks to economic uncertainties (Abuzayed et al., 2021; Fu et al., 2024; Rizwan et al., 2020; Sharif et al., 2020), extreme climate change events emerge as additional factors heightening the risk of systematic liquidity (Chenet, 2021; Monasterolo, 2020).
The systemic nature of climate change risk, influencing the broader context of societal processes (King et al., 2017; Renn, 2017) and financial stability (Battiston et al., 2021), further compounds the challenges. Climate shocks, amplified by financial interconnectedness, have the potential to escalate financial fragility and trigger simultaneous liquidity shortfalls in financial markets (Battiston et al., 2012). Consequently, following hypothesis is formulated:
Methodology
Measurement of the Variables
Types of Liquidity
Liquidity is the main dependent variable of this study. Four aspects of liquidity, that is, asset, funding, market, and systematic liquidity are employed.
Asset liquidity is measured using the ratio of liquid assets to deposits and short-term funding (%), as obtained from the Global Financial Development (GFD) database. This ratio indicates various components such as cash, receivables from banks, trading securities recorded at fair value through income, loans and advances provided to banks, reverse repurchase agreements, and cash collaterals. It can also help evaluate financial institutions’ ability to meet its short-term obligations and manage liquidity risk effectively (Agénor et al., 2004). This ratio is employed by previous studies to assess asset liquidity (Boussaada et al., 2022; Chiaramonte & Casu, 2017). A higher ratio indicates that a larger portion of the bank’s funding is backed by assets that can be quickly converted to cash without significant loss in value, reflecting stronger liquidity. This metric is widely used in prudential supervision to assess resilience against sudden withdrawals or funding stress.
Funding liquidity is measured with bank deposits to GDP (%), retrieved from the GFD database. Generally, funding liquidity is assessed with bank deposits proxies in the previous studies (Khan et al., 2017; Nguyen et al., 2017) as it is considered a stable and easily accessible source of funds for banks. Unlike other funding sources that may have longer maturity periods or require complex arrangements, deposits can be readily used to meet short-term obligations (Bagus & Howden, 2016). A higher ratio indicates that banks have greater access to deposit-based funding, enhancing their ability to finance loans and meet liquidity needs without relying on volatile or external funding sources.
Market liquidity is assessed with stocks traded, turnover ratio of domestic shares (%), which measures the total value of shares traded relative to the average market capitalization. A high turnover ratio implies that a significant portion of a company’s shares is being actively bought and sold in the market. This frequent trading activity is indicative of a liquid market where investors can easily enter or exit positions (Dey, 2005; Le & Gregoriou, 2020; Naik & Reddy, 2021). High turnover also enhances price discovery and market efficiency, as it indicates that information is rapidly incorporated into asset prices (Gupta et al., 2018). Conversely, a low turnover ratio may signal limited trading interest, wider bid-ask spreads, and higher transaction costs, which can deter investor participation and increase market risk. This data is also obtained from GFD database.
Systematic liquidity constitutes a crucial facet within the broader liquidity framework of the financial system. However, existing literature reveals that measures of systemic liquidity have been predominantly either micro-level or insufficiently quantified using dummy variables. To illustrate, Macchiati et al. (2022) employed bank-level data and utilized network analysis to assess systemic liquidity. Conversely, Bakoush et al. (2019) estimated systemic liquidity risk by quantifying systemic loss resulting from liquidity hoarding or the sale of less liquid assets, measured as a percentage of the initial interbank assets. Sensoy (2017) adopted an exchange liquidity measure to compute trading costs associated with position size and duration.
In another approach, Anastasiou et al. (2019) represented systemic liquidity as a binary variable, where 1 denoted the period after 2010 and 0 signified the period before 2010. Their indicator suggests that lending from the central bank increased with a decline in deposit volume, indicating a heightened level of systemic liquidity risk. Despite these insightful contributions, these indicators exhibit limitations, being either excessively intricate at the micro-level or insufficiently robust for a comprehensive assessment of systematic liquidity.
We have refined a macro-level indicator of systemic liquidity based on the general definition provided by the International Monetary Fund (IMF), emphasizing the role of interconnectedness within the financial sector and financial markets that can exacerbate liquidity deficits (Bonner et al., 2018). Our comprehensive index integrates multiple dimensions of systemic liquidity through a weighted composite approach that captures both structural and cyclical components of financial system liquidity.
To capture systemic interconnectedness, we estimate a 10-year moving-window correlation between financial institution development (FID) and financial market development (FMD). This is based on the sub-indicators of the main financial development indicator (FDI) as developed by the IMF. The 10-year window ensures sufficient temporal depth to capture long-term structural relationships while maintaining sensitivity to evolving market dynamics. The correlation coefficient ranges from −1 to +1, where higher positive correlations indicate greater systemic interconnectedness and potential contagion risk during liquidity stress periods.
Additionally, the financial cycle plays a pronounced role in explaining systemic liquidity (Akdi et al., 2020; Miranda-Agrippino & Rey, 2022). The financial cycle and systemic liquidity are often procyclical, meaning they tend to move in tandem with the economic cycle (Cincinelli et al., 2021). During the upswings of financial cycle, credit expands (F. Dong & Xu, 2020) and funds are readily available (Jeanne & Sandri, 2023), leading to more systemic liquidity. To assess the financial cycle, we use the cyclical component of the financial development indicator (FDI) employing the Hodrick-Prescott (HP) filter.
The HP filter decomposition separates the FDI into trend and cyclical components using a smoothing parameter of λ = 6.25 for annual data, following standard macroeconomic practice proposed by Ravn and Uhlig (2002). The cyclical component captures deviations from the long-term trend, with positive values indicating above-trend financial development (typically associated with higher systemic liquidity) and negative values suggesting below-trend conditions (associated with liquidity constraints). The data of financial development index and its subcomponents is retrieved from IMF economic database.
In addition to examining FID-FMD interconnectedness and the financial cycle, we incorporate various bank-level variables (sourced from the GFD database) to enhance our measurement of systemic liquidity. Souza (2016) suggests that higher shock amplification to the financial system and non-performing loans (NPL) can increase systemic losses, contributing to systemic liquidity risk. Other factors that elevate systemic liquidity risk include cost inefficiency (Duan et al., 2021) and market volatility (Chung & Chuwonganant, 2018; Drechsler et al., 2020).
Cost-inefficient banks may encounter challenges in allocating resources efficiently, impacting their capacity to extend loans. This limitation on lending can reduce the overall availability of credit in the system, thereby affecting systemic liquidity. In times of increased demand for funds, a lack of lending capacity may exacerbate liquidity shortages. Cost inefficiency is measured by the bank overhead costs to total assets, as indicated by previous studies (Dietrich et al., 2014; Duan et al., 2021). Similarly, high market volatility tends to dry up liquidity as market participants become more cautious, leading to reduced trading volumes and wider bid-ask spreads (Bazzana & Collini, 2020; Karolyi et al., 2012; G. H. Wang & Yau, 2000).
Lastly, we consider profitability and financial stability in developing the index of systemic liquidity. Banks with higher profitability ratios, measured by return on assets (ROA) and return on equity (ROE)—where ROA provides insights into how efficiently a financial institution uses its total assets to generate profits regardless of financing sources, while ROE specifically measures profitability from shareholders’ perspective and can mask financial risks when institutions rely heavily on leverage—possess a greater capacity to absorb losses without compromising their capital adequacy (Brogi & Langone, 2016). Considering both metrics together provides a more comprehensive view of systemic liquidity risk, as ROA helps identify underlying operational efficiency issues while ROE captures potential leverage-induced vulnerabilities that could amplify liquidity shocks throughout the financial system. This ability to absorb losses enhances the resilience of the banking system, reducing the likelihood of systemic disruptions stemming from individual bank failures (Ince, 2022; Isshaq & Faff, 2016; Moshirian et al., 2017). Both ROA and ROE have been widely used in previous studies as complementary indicators to assess business performance and overall profitability (Lei et al., 2024). In a similar vein, financially stable institutions are better equipped to withstand economic shocks, thus reducing the risk of sudden disruptions to liquidity (Diamond & Kashyap, 2016; Sundaresan & Xiao, 2024). Financial stability is assessed using banks’Z-score. All the aforementioned variables undergo min-max normalization to standardize them onto a common scale. The calculation follows the formula:

where,

where SYSLIQ represents systematic liquidity,
The derivation of Equation 2 follows a systematic approach grounded in the IMF’s conceptual framework for systemic liquidity, which posits that system-wide liquidity conditions emerge from the complex interplay between financial institution resilience, market functioning, and macroeconomic stability (Ding et al., 2024). Beginning with the IMF’s emphasis on interconnectedness as a primary driver of systemic liquidity risk, we operationalize this concept through the correlation coefficient ρ(FID, FMD), where higher correlations indicate greater systemic interconnectedness and potential contagion effects. This approach aligns with established literature on financial connectedness, where correlation-based measures effectively capture systemic risk transmission mechanisms (Billio et al., 2012; Diebold & Yılmaz, 2014). However, since high correlation represents increased systemic risk rather than liquidity availability, we employ (1 − ρ(FID, FMD)) to ensure that the component contributes positively to systemic liquidity when interconnectedness risk is low. The financial cycle component (FIC) enters directly into the equation as procyclical liquidity conditions align with the IMF’s recognition that systemic liquidity expands during financial upswings and contracts during downturns (Claessens et al., 2012). The remaining components address specific vulnerabilities identified in the IMF framework: non-performing loans, cost inefficiency, and market volatility are transformed using (1 − variable) formulations because these factors represent impediments to systemic liquidity—higher NPL ratios, greater cost inefficiency, and elevated market volatility all constrain system-wide liquidity availability (Adrian & Shin, 2010; Brunnermeier et al., 2020). Conversely, profitability metrics (ROA and ROE) and financial stability (ZSCORE) enter directly as positive contributors, reflecting the IMF’s emphasis that financially sound institutions enhance systemic liquidity through their capacity to intermediate funds effectively and withstand shocks without triggering liquidity hoarding behaviors (Diamond & Rajan, 2011). This additive structure assumes that each component contributes independently to systemic liquidity while maintaining equal weights, consistent with the IMF’s holistic approach that views systemic liquidity as emerging from multiple, interconnected dimensions of financial system health.
Climate Risk
Climate risk is the main explanatory variable of the study. The Notre Dame Global Adaptation Initiative (ND-GAIN) index is employed. The ND-GAIN index represents one of the most comprehensive and widely recognized global measures of climate risk, providing annual assessments for 182 countries since 1995. This index is constructed through a rigorous methodology that combines 74 variables from various international databases, including the World Bank, United Nations, and other authoritative sources.
This index predominantly encompasses two crucial components of adaptation, namely readiness and vulnerability. To assess climate risk, existing literature has frequently utilized a country’s vulnerability to climate change, further dissected into exposure, sensitivity, and capacity, as observed in studies by C.-C. Lee, Wang, Thinh, and Xu (2022) and Kling et al. (2021). This tripartite framework aligns with the Intergovernmental Panel on Climate Change (IPCC) conceptual approach and provides a structured methodology for quantifying multidimensional climate risks across different economic sectors and geographical regions.
Exposure is the degree to which an economy is exposed to climate disruptions. Sensitivity explains the economic sector and population’s susceptibility to a climate change. Capacity reflects the availability of social resources for sector-specific adaptation. In some cases, these capacities reflect sustainable adaptation solutions. In other cases, they reflect capacities to put newer, more sustainable adaptations into place. Owing to the high correlation among these three sub-indexes of vulnerability, we operationalize capacity as a lack of adaptive capacity to climate shocks. The data is obtained from the University of Notre Dame’s website.
Control Variables
Control variables of the study include a set of bank-level and macroeconomic factors. The bank-level indicators include banks’ asset to GDP (BASS), bank credit to bank deposits (BCR_DEP), commercial bank branches (CBB), and bank crisis dummy (BCD). A higher BASS indicates the banking sector size. A well-capitalized BASS can contribute to a stable source of funds for various economic activities (Singh & Sharma, 2016). On the other hand, BCR_DEP indicates a higher reliance on credit compared to deposits which can lead to liquidity shortages during economic downturns or in times of increased demand for withdrawals (Hassan et al., 2019). A higher CBB reflects geographical proximity and financial inclusion which can facilitate more efficient fund mobilization and distribution (T.-H. Chen & Lee, 2020). Bank crisis (measured by 1 = bank crisis, 0 = otherwise) suggests higher uncertainty, reduced investor confidence and contraction in lending activity, making it challenging for banks to meet liquidity demands (W.-D. Chen et al., 2021). The data of these bank-level variables is retrieved from GFD database.
The macro-level control variables include remittance inflows to GDP (REM), inflation (INF), government quality (GOQ), and GDP growth (GDPG). When individuals receive remittances, they often deposit the funds into banks, increasing the overall pool of deposits (Basnet et al., 2021). Inflation erodes the purchasing power of money, reducing the real value of financial assets (Reynard, 2023). As a result, individuals and businesses may seek to convert their liquid assets into non-monetary assets or invest in inflation-hedging instruments (C.-C. Lee, Wang, Thinh, & Xu, 2022). However, government quality (measure by the mean of rule of law and absence of violence) is associated with sound economic policies, which can foster investor confidence and attract foreign investment (C.-W. Wang et al., 2022). Additionally, government quality can reduce the detrimental effect of climate change vulnerability (Abdelzaher et al., 2020) and help economies in their development stages (R. Y. M. Li et al., 2019). Lastly, GDPG is also associated with higher liquidity. Growing economies tend to have higher levels of employment, income, and investment, leading to increased transactions and demand for financial services (Ghenimi et al., 2021). The data for REM, INF, and GDPG are obtained from the World Development Indicators (WDI), while the data for GOQ are sourced from the Worldwide Governance Indicators (WGI). Further details on the data description and sources are given in Table 1.
Data Description and Sources.

Source. Authors’ illustrations.
Note. This table provide the variable names, their acronyms, description, and source.
Sample and Data Description
Following the exclusion of insufficient data points, a final dataset comprising 166 countries over the period from 1999 to 2021 is retained for the analysis. A comprehensive list of the countries included in the analysis is presented in Appendix 1. Before analysis, we transform the variables using inverse hyperbolic sine (IHS) function. The IHS transformation is superior to traditional log transformation because it can handle zero and negative values while maintaining similar interpretation to logarithms for large positive values (Aihounton & Henningsen, 2021). Additionally, unlike other transformations like Box-Cox, IHS has the advantage of being symmetric around zero and provides a more stable transformation when dealing with extreme values or highly skewed data (Friedline et al., 2015; Yahya, Ali, & Rashid, 2025). Table 2 presents the descriptive statistics of all variables alongside CD test results using the method of Pesaran (2015). The test strongly rejects the null hypothesis of weak CD for all variables, indicating substantial cross-sectional correlation in our panel data. This finding underscores the importance of employing estimation methods that account for CD, as conventional ordinary least square (OLS) estimation would yield biased and inconsistent results.
Summary Statistics.
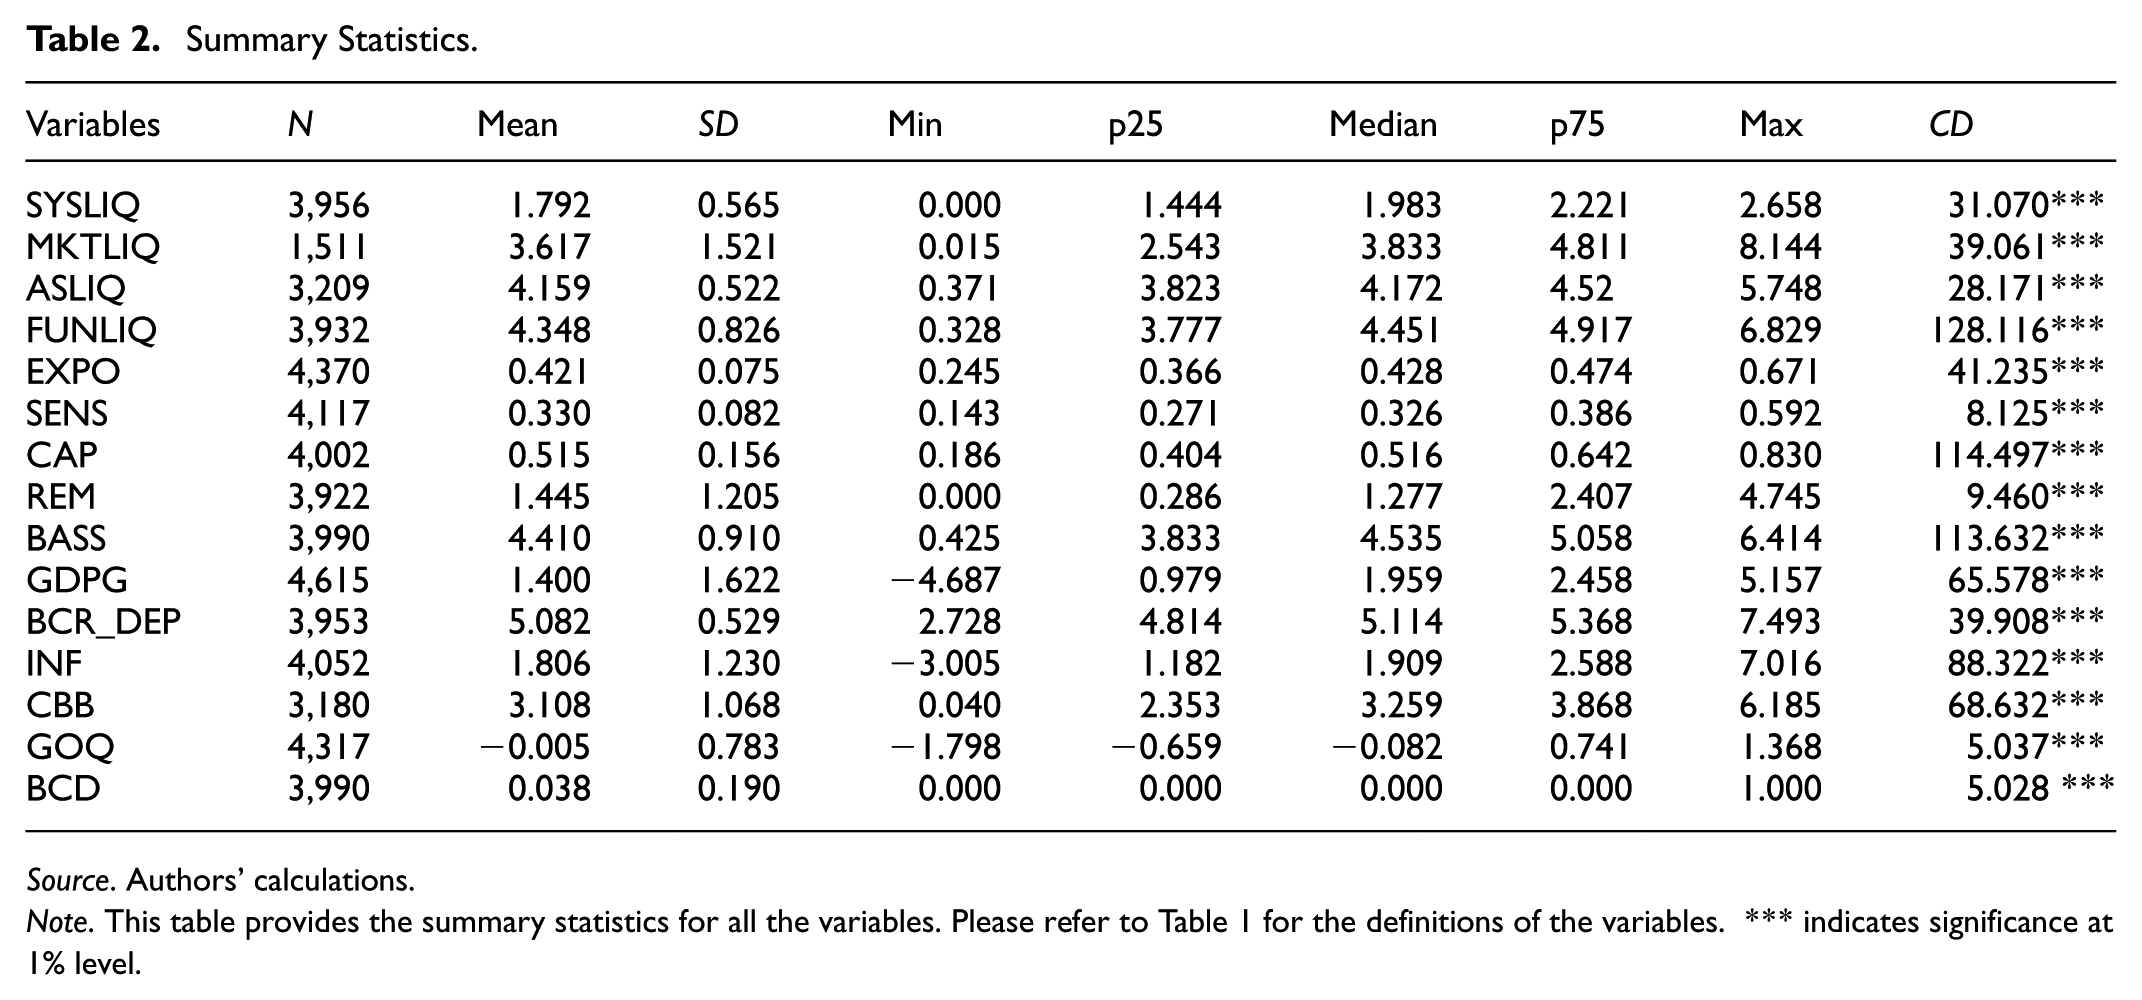
Source. Authors’ calculations.
Note. This table provides the summary statistics for all the variables. Please refer to Table 1 for the definitions of the variables. *** indicates significance at 1% level.
Baseline Model and Econometric Techniques
The OLS estimator assumes that the explanatory variables are not correlated with the error term. In panel data, this assumption is often violated due to unobserved heterogeneity and potential endogeneity issues (Lu & Wooldridge, 2020). OLS does not account for these factors, leading to biased and inconsistent estimates (Shang, 2020; Yahya et al., 2022). In addition, OLS treats individual effects as fixed over time, neglecting potential time-varying effects (Plümper & Troeger, 2019; Yahya & Rafiq, 2019). This can be problematic when dealing with panel data where individual units (e.g., countries) may experience changes in characteristics over time (Yahya & Lee, 2023; Yahya, Pham, & Waqas, 2020). Furthermore, OLS does not address potential serial correlation in the error term, which may be present in panel data. Ignoring serial correlation can lead to inefficient parameter estimates and incorrect inference (Brauneis et al., 2021; Yahya, Abbas, et al., 2020). Beyond addressing traditional panel data challenges like serial correlation, heteroscedasticity, and endogeneity, CD arising from unobserved common factors (such as economic shocks or policy changes) requires careful treatment to prevent biased estimates and invalid statistical inferences.
To deal with these issues, we employ IV-2SLS with DK standard errors. It handles serial correlation by allowing for up to two or three lags in the error terms, ensuring robust standard errors against time series dependence, while simultaneously addresses heteroscedasticity by adjusting for unequal error variance across observations (Mamba, 2021; Yahya & Lee, 2025). Importantly, DK standard errors are specifically engineered to manage CD by accounting for both spatial and temporal correlation patterns in the error terms, making them particularly valuable for panel data analysis where units might be influenced by common unobserved factors (C.-C. Lee et al., 2024; J. Li et al., 2025). Additionally, we made small-sample adjustment which is important for finite sample and enhance the reliability of statistical inference in smaller datasets (Acheampong & Tetteh, 2024). Furthermore, IV-2SLS can address endogeneity issues using valid instruments, making the estimations more robust in the presence of correlated regressors and endogenous variables (C.-C. Lee, Wang, & Pan, 2022; B. Liu et al., 2022). Consequently, we estimate the following baseline model with IV-2SLS-DK estimator:

The baseline regression model in Equation 3 examines the relationship between bank liquidity and climate risk, controlling for bank-specific and macroeconomic factors. Based on precautionary liquidity hoarding theory, we hypothesize that β > 0 for asset liquidity, as banks increase liquid asset holdings as a buffer against climate-related uncertainties (Berger & Bouwman, 2009; Distinguin et al., 2013). This flight-to-safety behavior reflects banks' defensive strategy of maintaining higher cash and government securities to mitigate potential climate-induced losses (Batten et al., 2016; Huang et al., 2022).
Conversely, we expect β < 0 for funding, market, and systematic liquidity. Climate risk exposure constrains banks’ ability to attract stable funding sources as depositors and creditors demand higher risk premiums (Lang et al., 2023; C.-C. Lee, Wang, Thinh, & Xu, 2022). Market liquidity deteriorates as climate uncertainties reduce trading activity and increase bid-ask spreads in financial markets (Sahu & Debata, 2025). Similarly, systematic liquidity decreases as climate risks create correlated exposures across the banking system, reducing overall market liquidity provision capacity (Akhtaruzzaman & Rahman, 2024; Z. Liu et al., 2024).
In the model specifications, LIQ encompasses various liquidity indicators, namely asset liquidity (ASLIQ), funding liquidity (FUNLIQ), market liquidity (MKTLIQ), and systematic liquidity (SYSLIQ). Climate risks are represented by CRISK, measured through the exposure index (EXPO), sensitivity index (SENS), and capacity index (CAP). The vector of control variables, denoted by X, includes BASS, BCR_DEP, CBB, BCD, REM, GOQ, and GDPG. The notation
Subsample Analysis Framework and Classification
To examine the heterogeneous effects of climate risk on bank liquidity across different institutional characteristics, we conduct subsample analysis rather than moderation analysis. This approach allows us to investigate how the relationship between climate risk and bank liquidity varies across distinct groups of financial institutions with different structural characteristics. Subsample analysis is particularly appropriate for this study because we aim to understand how institutional characteristics fundamentally alter the climate risk-liquidity relationship rather than examining these characteristics as continuous moderating variables. This approach recognizes that banks with different structural features (size, profitability, and operating environments) may exhibit qualitatively different responses to climate risks due to their distinct risk management capabilities, market positions, and resource constraints.
Bank Size Classification
We classify banks into large and small categories based on the median value of total assets within each country-year observation. This approach ensures that size classifications remain relevant within each economic context while capturing meaningful differences in institutional capacity and market position.
Bank Profitability Classification
Banks are categorized into high-profitability and low-profitability groups using the median return on assets (ROA) as the threshold within each country-year. This classification captures differences in operational efficiency and financial strength that may influence liquidity management strategies during climate stress periods.
Income Level Classification
Following World Bank classifications, we divide countries into high-income and low-income groups based on GDP per capita. This classification captures differences in institutional development, regulatory frameworks, and market sophistication that may affect how banks respond to climate risks.
Empirical Findings
Baseline Estimations
This section discusses the empirical findings for the relationship between climate risk measured by three different proxies (exposure, sensitivity, and capacity) and different types of liquidity including: systematic liquidity, stocks liquidity, bank’s asset liquidity, and funding liquidity. Table 3 reports the findings for the effect of climate risk on asset liquidity based on IV-2SLS-DK. Consistent with flight-to-safety theory and study’s first hypothesis, our findings reveal that all three proxies of climate risk (exposure, sensitivity, and capacity) exhibit positive and significant effects on asset liquidity. This positive relationship can be explained through two complementary theoretical mechanisms: flight-to-safety behavior and precautionary liquidity hoarding.
The Impact of Climate Risk on Asset Liquidity Based on Full Sample Using IV-2SLS-DK Analysis.

Source. Authors’ calculations.
Note. This table provides the results for the impact of climate risk on asset liquidity. Climate risk is represented by EXPO, CAP, and SENS measures Notre-Dame University’s components of ND-GAIN index. The asset liquidity is measured by the liquid assets to deposits and short-term funding ratio. Standard errors are in parentheses and *, **, and *** denotes significance at 10%, 5%, and 1% level respectively. For the definition of variables please refer to Table 1.
From a flight-to-safety perspective, the positive coefficients suggest that investors tend to shift their portfolios toward more liquid assets when faced with heightened climate risks, aligning with the fundamental premise where investors seek safer and more liquid investments during periods of increased uncertainty (Ben-Rephael, 2017; Costantini & Sousa, 2022). This behavior is particularly pronounced during climate-related stress events, where investors rapidly reallocate capital from climate-vulnerable assets to safe-haven securities such as government bonds and highly liquid financial instruments (Boutabba & Rannou, 2022; Mahanta et al., 2024).
More importantly, our findings strongly support the precautionary liquidity hoarding theory, which provides a robust theoretical foundation for understanding why financial institutions increase their asset liquidity in response to climate risks. According to this theory, when faced with heightened uncertainty and potential future cash flow disruptions from climate events, rational financial institutions proactively accumulate liquid assets as a precautionary buffer (V. V. Acharya & Merrouche, 2013; V. Acharya & Naqvi, 2012; W, Zhang et al., 2023). This precautionary behavior is driven by institutions’ desire to maintain adequate liquidity buffers to withstand potential climate-induced shocks, including sudden deposit withdrawals, increased loan loss provisions, and reduced access to funding markets (V. V. Acharya et al., 2011; Berger & Bouwman, 2009).
The precautionary motive is further reinforced by regulatory and prudential considerations, as financial institutions recognize that climate risks may lead to tighter regulatory scrutiny and higher capital requirements (Battiston et al., 2021). Consequently, banks proactively build liquidity cushions by increasing their holdings of cash, government securities, and other highly liquid assets to demonstrate financial resilience and regulatory compliance (Bonner et al., 2015; Drehmann & Nikolaou, 2013).
Our results are consistent with recent empirical evidence suggesting that financial institutions engage in precautionary liquidity management during periods of heightened environmental uncertainty (Ashraf et al., 2022; Bhatia, 2024; Kanagaretnam et al., 2022). This behavior reflects a rational response to the potential for climate-related disruptions to affect both the asset and liability sides of bank balance sheets, necessitating higher liquidity buffers to maintain operational stability and stakeholder confidence (S. Lee & Alam, 2024; Yang et al., 2024).
The magnitude and consistency of the positive coefficients across all three climate risk dimensions (exposure, sensitivity, and capacity) provide strong empirical support for the precautionary liquidity hoarding hypothesis, demonstrating that this behavioral response is not limited to specific types of climate risks but represents a comprehensive institutional strategy for managing climate-related financial uncertainties.
The empirical findings for the impact of climate risk on funding liquidity of banks are provided in Table 4. The results show that climate risk hampers the funding liquidity of the banks which support the findings of existing studies by C.-C. Lee, Wang, Thinh, and Xu (2022) and Lang et al. (2023). The negative relationship stems from heightened uncertainty about asset values and potential losses, making other financial institutions more hesitant to provide interbank loans or short-term funding (Xu et al., 2024). Banks exposed to higher climate risks face increased funding costs and stricter collateral requirements (Huang et al., 2022), while also potentially experiencing reduced deposits from climate-conscious stakeholders (Roncoroni et al., 2021), all of which constrain their ability to maintain adequate funding liquidity.
The Impact of Climate Risk on Funding Liquidity Based on Full Sample Using IV-2SLS-DK Analysis.

Source. Authors’ calculations.
Note. This table provides the results for the impact of climate risk on funding liquidity. Climate risk is represented by EXPO, CAP, and SENS measures Notre-Dame University’s components of ND-GAIN index. The funding liquidity is measured by the bank deposits to GDP ratio. Standard errors are in parentheses and *, **, and *** denotes significance at 10%, 5%, and 1% level respectively. For the definition of variables please refer to Table 1.
The third category of liquidity examined in the study is stock liquidity. Table 5 provides the empirical findings for the impact of climate risk on stock market liquidity based on complete sample. The results of IV-2SLS-DK analysis show that higher climate risk is associated with lower stock market turnover that measures the liquidity of stock markets. It reflects investors’ increased uncertainty and divergent opinions about the firm’s exposure to climate-related risks, leading to wider bid-ask spreads and reduced trading activity (X. Dong & Liu, 2023). This effect is exacerbated as higher climate risks can result in greater information asymmetry between market participants, making market makers more cautious and demanding higher compensation for providing liquidity (Z. Liu et al., 2024; Vestrelli et al., 2024). This evidence is consistent with the study by S. Y. Zhang (2022) that stock markets and investors are sensitive to climate-related physical and transition risks. Climatological hazards induce extreme market reactions, leading to a lower level of stock liquidity (Pagnottoni et al., 2022) and higher level of commonality (Z. Liu et al., 2024).
The Impact of Climate Risk on Market Liquidity Based on Full Sample Using IV-2SLS-DK Analysis.

Source. Authors’ calculations.
Note. This table provides the results for the impact of climate risk on market liquidity. Climate risk is represented by EXPO, CAP, and SENS measures Notre-Dame University’s components of ND-GAIN index. The stock market liquidity is measured by the stock turnover ratio. Standard errors are in parentheses and *, **, and *** denotes significance at 10%, 5%, and 1% level respectively. For the definition of variables please refer to Table 1.
Table 6 presents the results for the impact of climate risk on systematic liquidity based on IV-2SLS-DK analysis. The results show that all measures of climate risk have an adverse impact on the systematic liquidity that is, the climate risk hampers the systematic liquidity. Although our study is the first attempt to examine the effect of climate risk on systemic liquidity, the results can find a partial support from some existing studies (Lang et al., 2023; C.-C. Lee, Wang, Thinh, & Xu, 2022). The magnitude of adverse impact of climate risk exposure on systematic liquidity is the highest followed by sensitivity and capacity which partially supports the findings of C.-C. Lee, Wang, Thinh, and Xu (2022). The financial interconnectedness followed by simultaneous liquidity shocks are highly susceptible to climate shocks (Battiston et al., 2012, 2021).
The Impact of Climate Risk on Systematic Liquidity Based on Full Sample Using IV-2SLS-DK Analysis.

Source. Authors’ calculations.
Note. This table provides the results for the impact of climate risk on systematic bank liquidity. Climate risk is represented by EXPO, CAP, and SENS measures Notre-Dame University’s components of ND-GAIN index. The systematic liquidity is measured based on components mentioned in Table 1. Standard errors are in parentheses and *, **, and *** denotes significance at 10%, 5%, and 1% level respectively. For the definition of variables please refer to Table 1.
Subsample Analysis Based on Bank Size
Following the literature convention, our analysis of bank size subsamples (Table 7) reveals heterogeneous effects of climate risk on bank liquidity. Large banks experience more pronounced negative effects on systemic liquidity, aligning with C.-C. Lee, Wang, Thinh, and Xu (2022), due to their deep integration within the financial system. Their extensive networks mean climate-related disruptions can rapidly cascade through the financial system (B. Wu et al., 2024). However, these institutions benefit from improved funding liquidity during climate risk periods, as their perceived stability and robust risk management systems attract depositors and investors seeking safety (Jiang et al., 2023). This phenomenon is in line with “flight-to-safety” theory, as depositors and investors shift their assets toward larger, more established institutions perceived as better equipped to weather environmental challenges.
Subsample Analysis Based on Bank Size.

Source. Authors’ calculations.
Note. This table provides the results for the impact of climate risk on four types of liquidity based on bank size. Climate risk is represented by EXPO, CAP, and SENS measures of Notre-Dame University’s components of ND-GAIN index. The sample is divided based on median value of bank size. Standard errors are in parentheses and *, **, and *** denotes significance at 10%, 5%, and 1% level respectively. Constant, control variables, time fixed effects, and country fixed are included in all models. The validity of instruments was also verified by KPrk LM and Cragg-Donald F-statistics. Full estimation results can be requested from authors upon reasonable demand. For the definition of variables please refer to Table 1.
In contrast, small banks experience greater vulnerability in their market and asset liquidity when facing climate risks. This susceptibility stems from their less diversified portfolios, regional concentrations, and limited risk management resources (Shabir et al., 2024; Song et al., 2024). Their concentrated exposures and smaller scale restrict their ability to adjust portfolio composition or access alternative funding sources during climate-stressed periods (X. Liu et al., 2024). The flight to safety dynamics exacerbates these challenges, as depositors’ preference for larger institutions during periods of climate uncertainty can lead to funding instability for smaller banks, despite their potentially sound underlying fundamentals. These contrasting effects highlight how banks’ structural characteristics—including market position, resource availability, and risk management capabilities—shape their resilience to climate risks.
Subsample Analysis Based on Bank Profitability
The second subsample analysis is based on bank profitability and the results are reported in Table 8. There is a varying impact of climate risk on different types of bank liquidity across profitability levels which can be explained through the lens of flight-to-safety behavior in financial markets. More profitable banks experience negative effects on systemic liquidity during periods of elevated climate risk because their typically aggressive investment strategies and significant exposure to climate-sensitive sectors make them vulnerable to systemic shocks (Caby et al., 2022; Reghezza et al., 2022). This heightened risk exposure can trigger broader market concerns, leading to a systemic liquidity drain as investors and counterparties seek safer positions (Carnevali et al., 2021). The divergent effects on market liquidity between more and less profitable banks further illustrate this flight-to-safety phenomenon. More profitable banks, which often hold sophisticated and complex portfolios, face deteriorating market liquidity as these assets become harder to trade during climate stress periods (Goodell et al., 2024; Roncoroni et al., 2021).
Subsample Analysis Based on Bank Profitability.

Source. Authors’ calculations.
Note. This table provides the results for the impact of climate risk on four types of liquidity based on bank profitability. Climate risk is represented by EXPO, CAP, and SENS measures of Notre-Dame University’s components of ND-GAIN index. The sample is divided based on median value of return on assets (ROA). Standard errors are in parentheses and *, **, and *** denotes significance at 10%, 5%, and 1% level respectively. Constant, control variables, time fixed effects, and country fixed are included in all models. The validity of instruments was also verified by KPrk LM and Cragg-Donald F-statistics. Full estimation results can be requested from authors upon reasonable demand. For the definition of variables please refer to Table 1.
In contrast, less profitable banks, which typically maintain more conservative and easily liquidated assets, actually experience improved market liquidity as investors seek refuge in simpler, more transparent financial instruments (Z. Liu et al., 2024). Interestingly, the positive effect on asset and funding liquidity for more profitable banks demonstrates their fundamental strength and resilience. Despite systemic pressures, these banks benefit from their strong balance sheets, established market relationships, and superior risk management capabilities, which make them attractive destinations for deposits and funding even during climate stress periods (Ongsakul et al., 2024; Yang et al., 2024). This pattern suggests that while more profitable banks might face initial market disruptions from climate risks, their robust financial positions ultimately help them maintain critical aspects of their liquidity management (Conlon et al., 2024; Jiang et al., 2023), particularly in terms of asset quality and funding stability.
Subsample Analysis Based on Income Levels
Finally, we divide the sample based on income level (GDP). The results reported in Table 9 shows a heterogeneous impact of climate risk across income groups, revealing distinct patterns in different dimensions of bank liquidity. Low-income countries experience more severe negative effects on both systematic and funding liquidity when faced with climate risks, likely due to their limited institutional capacity and less developed financial markets (Dunz et al., 2021; S. Lee & Alam, 2024). Interestingly, the relationship between climate risk and liquidity measures shows contrasting patterns across other dimensions: high-income countries exhibit greater vulnerability in market liquidity, possibly reflecting their more complex and interconnected financial markets (de Bandt et al., 2023; Gao, 2024), while low-income countries show a positive relationship between climate risk and asset liquidity, suggesting these institutions may adopt more conservative asset management strategies in response to environmental threats (Dunz et al., 2021; Monsod et al., 2023). These findings underscore how economic development levels fundamentally shape financial institutions’ responses and vulnerabilities to climate-related challenges.
Subsample Analysis Based on Income Level.

Source. Authors’ calculations.
Note. This table provides the results for the impact of climate risk on four types of liquidity based on countries’ income levels. Climate risk is represented by EXPO, CAP, and SENS measures of Notre-Dame University’s components of ND-GAIN index. The sample is divided based on median value of GDP growth. Standard errors are in parentheses and *, **, and *** denotes significance at 10%, 5%, and 1% level respectively. Constant, control variables, time fixed effects, and country fixed are included in all models. The validity of instruments was also verified by KPrk LM and Cragg-Donald F-statistics. Full estimation results can be requested from authors upon reasonable demand. For the definition of variables please refer to Table 1.
Robustness Checks
To validate the reliability of our findings, we conducted two comprehensive robustness checks addressing both methodological concerns and measurement considerations. Our first robustness check employs an alternative estimation technique—the two-step system Generalized Method of Moments (GMM). This approach is particularly well-suited for dynamic panel data analysis as it effectively addresses three key econometric challenges: endogeneity, unobserved heterogeneity, and autocorrelation (Roodman, 2009; Yahya, Abbas, et al., 2020). The system GMM estimator leverages internal instruments derived from lagged variables, addressing endogeneity concerns by instrumenting potentially endogenous regressors with their own past values (X. Li & Tian, 2024). This technique operates under the assumption that these lagged instruments are correlated with the regressors while remaining uncorrelated with the error term (Bun & Windmeijer, 2010). The results presented in Appendices 3 and 4 demonstrate striking similarity to those obtained using the IV-2SLS-DK estimator, providing strong evidence for the robustness of our primary findings.
Our second robustness check involves employing an alternative proxy for asset liquidity (ASLIQ2). Specifically, we utilize the bank liquid reserves to bank assets ratio (%), which measures the proportion of a bank’s total assets maintained in highly liquid forms, including cash and reserves held with the central bank. A higher ratio indicates superior asset liquidity, positioning the bank more favorably to meet short-term obligations without necessitating the sale of illiquid assets or incurring associated losses. We analyzed the results using both the two-step system GMM and IV-2SLS-DK estimators with this alternative liquidity measure (see Appendix 5). The findings consistently confirm that climate risk maintains a positive association with asset liquidity, thereby reinforcing the precautionary liquidity hoarding perspective underlying our theoretical framework.
Conclusion
This study aimed to examine the effects of climate risk on different dimensions of bank liquidity across various institutional characteristics and developmental contexts. Our research advances the understanding of climate risk’s impact on bank liquidity by decomposing liquidity into its distinct components: asset, funding, market, and systematic dimensions. This disaggregated approach reveals nuanced dynamics that previous research, focusing on aggregate liquidity measures, failed to capture. We contribute methodologically by introducing a macro-level systematic liquidity index and employing IV-2SLS with Driscoll-Kraay standard errors to address both endogeneity and cross-sectional dependence. Our comprehensive sample of 166 countries enables robust insights into how climate risk affects bank liquidity across different institutional characteristics and developmental contexts.
Our main findings reveal that climate risks generally exert adverse effects on funding, market, and systematic liquidity, while asset liquidity shows a contrasting positive relationship. This pattern aligns with flight-to-safety theory, suggesting that during periods of climate-related uncertainty, investors gravitate toward safer, more liquid assets. The subsample analyses further illuminate these dynamics, revealing that bank size, profitability, and country income levels significantly influence the relationship between climate risk and liquidity. Large and profitable banks, despite experiencing negative effects on systemic liquidity due to their deep market integration, benefit from improved funding liquidity through flight-to-safety dynamics. Conversely, smaller banks show greater vulnerability in market and asset liquidity, constrained by their limited resources and regional concentrations.
The profitability analysis reveals that more profitable banks, while facing deteriorating market liquidity during climate stress periods due to their complex portfolios, maintain robust asset and funding liquidity positions through superior risk management capabilities. The income-level analysis further demonstrates that low-income countries face more severe systematic and funding liquidity challenges, while high-income countries exhibit greater market liquidity vulnerability, underscoring how economic development shapes institutional resilience to climate risks.
Theoretical and Managerial Implications
From a theoretical perspective, our findings extend flight-to-safety theory by demonstrating that climate risks create differential liquidity effects across bank characteristics and developmental contexts. The positive relationship between climate risk and asset liquidity supports precautionary liquidity hoarding theory, while the negative effects on other liquidity dimensions align with liquidity risk theory under uncertainty. Our systematic liquidity index contributes to the literature by providing a comprehensive macro-level measure that captures the interconnected nature of financial system liquidity during climate stress periods.
The heterogeneous effects across bank size, profitability, and income levels provide empirical support for the institutional theory of banking, suggesting that structural characteristics fundamentally shape how financial institutions respond to environmental shocks. The findings also contribute to the climate finance literature by demonstrating that the climate risk-liquidity relationship is not uniform but varies systematically across institutional contexts.
For managerial implications, our findings suggest that bank managers should adopt differentiated liquidity management strategies based on their institutional characteristics. Large and profitable banks should focus on managing systemic liquidity risks while leveraging their funding advantages during climate stress periods. Smaller banks need to strengthen their market liquidity management capabilities and diversify their funding sources to reduce vulnerability to climate-induced liquidity shocks. Banks in low-income countries should prioritize building institutional capacity for systematic and funding liquidity management, while those in high-income countries should enhance market liquidity resilience.
Financial institutions should also develop climate-specific stress testing frameworks that account for the differential effects on various liquidity dimensions. This approach would enable more accurate risk assessment and improve the effectiveness of liquidity management strategies during climate-related disruptions.
Regulators should implement a tiered regulatory framework that accounts for bank size and market position when setting climate-related liquidity requirements. While larger banks may need enhanced systematic risk oversight due to their interconnectedness, smaller banks require targeted support to strengthen their market and asset liquidity management capabilities. This could include providing smaller institutions with preferential access to liquidity support facilities or developing specialized risk management tools tailored to their resource constraints.
International financial organizations should develop differentiated climate risk mitigation strategies for high- and low-income countries. For low-income countries, policy priorities should focus on strengthening institutional capacity for liquidity management and developing more robust funding mechanisms to address systematic liquidity vulnerabilities. Meanwhile, high-income countries would benefit from policies that enhance market liquidity resilience during climate stress periods, potentially through the development of specialized green financial instruments and climate-risk hedging tools. Finally, policymakers should implement policies that foster resilience in financial markets and systems, acknowledging the spillover and connectedness between financial institutions and financial markets in the face of climate shocks.
Limitations and Future Directions
Despite the comprehensive nature of our analysis, several limitations should be acknowledged. First, our study relies on country-level data for climate risk measurement, which may not fully capture regional or local variations in climate exposure that could affect individual banks differently within the same country. Second, while our systematic liquidity index represents a methodological advancement, it is constructed using available macro-level indicators and may not capture all dimensions of systemic interconnectedness, particularly at the micro-level between individual financial institutions.
Third, our analysis focuses on the direct effects of climate risk on bank liquidity and does not fully explore the dynamic feedback effects between different liquidity dimensions during climate stress periods. Fourth, our subsample analysis, while revealing heterogeneous effects, is based on median splits which may not capture non-linear relationships or threshold effects in the climate risk-liquidity relationship. Additionally, the study does not distinguish between different types of climate risks (physical vs. transition risks) which may have varying effects on bank liquidity.
Future research directions should address these limitations and extend our findings in several ways. First, researchers should develop bank-level climate risk measures that capture institution-specific exposures to climate hazards, enabling more granular analysis of climate risk effects on individual bank liquidity. Second, future studies could employ network analysis to better understand the systemic liquidity implications of climate risks by examining direct interconnections between financial institutions.
Third, researchers should investigate the dynamic interactions between different liquidity dimensions during climate stress periods, potentially using vector autoregression (VAR) or dynamic panel models to capture temporal spillover effects. Fourth, future research could distinguish between physical and transition climate risks to understand their differential impacts on various liquidity measures.
Fifth, threshold regression or regime-switching models could be employed to identify critical climate risk levels at which liquidity effects become particularly pronounced, providing more nuanced policy guidance. Sixth, researchers should explore the role of financial innovation, such as green bonds and climate derivatives, in mitigating climate-related liquidity risks.
Finally, future studies could examine the effectiveness of various policy interventions and regulatory frameworks in enhancing bank liquidity resilience to climate risks, providing empirical evidence for optimal regulatory design. Longitudinal studies tracking the evolution of climate risk effects on bank liquidity over longer time horizons would also provide valuable insights into adaptation mechanisms and long-term resilience building in the financial sector.
Footnotes
Appendix 1
Funding
The authors received no financial support for the research, authorship, and/or publication of this article.
Declaration of Conflicting Interests
The authors declared no potential conflicts of interest with respect to the research, authorship, and/or publication of this article.
Data Availability Statement
The dataset generated during the current study is available from the corresponding author upon reasonable request.