
Abstract
Predictors of employment have been studied extensively previously. However, even small beneficial changes in readiness for work life are relevant, regardless of whether the person has yet gained employment. This study explored how the unemployed individuals’ readiness for work life could be assessed by using a self-report measure and whether certain factors of work ability and functioning were predictors of a beneficial change in this measure. The study utilised questionnaire data from 3,686 individuals participating in training and development activities that aim to support work ability and work participation in Finland in 2017 to 2022. The data were collected using the Abilitator, a self-report instrument for measuring work ability and functioning, and readiness for work life was measured by asking ‘How do you feel in relation to work life at the moment?’ on a scale of 0 to 10. We used logistic regression analysis and bootstrap-enhanced lasso methods in this study. The results showed that especially the feeling of having skills that can be used in work life and experiencing less impediments to potential work due to illnesses were associated with feeling closer to work life. In addition, positive changes in feeling part of society and in feeling useful were associated with feeling closer to work life. The research findings could be useful in planning training and development activities aimed at supporting work participation.
Plain Language Summary
Many studies have examined the differences between unemployed persons who get a job and those who do not, and the factors that affect the prospects of getting a job. In our study, we were interested in whether unemployed persons were moving closer to work life, even if they had not yet got a job. For this purpose, we examined unemployed persons’ own assessment of their readiness for work life: how they felt about work life and their possibilities of getting a job. We followed how persons’ readiness for work life changed over time, and we studied if we could find any factors of work ability and functioning that were predictors of improved readiness. Our study used the Abilitator, which is a self-report instrument for measuring work ability and functioning. The Abilitator was used in services and activities that aim to support work ability and work participation. Readiness for work life was evaluated by asking ‘How do you feel in relation to work life at the moment?’. The scale of the response options was 0–10: a lower score indicated that the respondent was unemployed, poorly equipped for work life and needed a great deal of support – a higher score indicated that the respondent was employed, well equipped for work life and needed little or no support. We had data with 3686 unemployed persons who had responded to the Abilitator in Finland in 2017–2022. We used statistical methods to evaluate the predictive power of the different factors of work ability and functioning. According to the results, there were especially two predictors of improved readiness for work life: the unemployed person has feeling that they have skills that they could use in work life and the unemployed person has feeling that they have no illnesses that could be impediment to potential work. The research findings could be useful when organisations plan training and development activities that aim to support work participation.
Introduction
The transition from unemployment to employment is not always straightforward or quick. According to Eurostat statistics on labour market transitions, all those persons in the EU region who were unemployed in 2021, 37.1% remained unemployed in 2022, while 38.5% moved into employment and 24.4% left the labour force (Eurostat, 2025a). Long-term unemployment is common. The share of those unemployed for 24 months or more in the total unemployed population was 23.2% in the EU region in 2022 (Eurostat, 2025b). The share of those unemployed for 12 to 23 months was 15.3% (Eurostat, 2025b). The trend in hirings from non-employment has declined in most OECD countries in the long run, from the year 2000 to the year 2019 (Causa et al., 2021).
Especially in the case of the population in a weak labour market position, such as the unemployed with challenges in work ability and functioning, the path from unemployment to full-time employment in the open labour market might be long and have many different stages. Long-term unemployment has been associated with poor physical and mental health (Backhans & Hemmingsson, 2012; Hult et al., 2018; Janlert et al., 2015). Therefore, unemployed individuals might have diseases or symptoms that must be treated before they can begin actually searching for a job. Kerätär et al. (2016) found that a fifth of the unemployed in Paltamo, a municipality in Finland, needed care or rehabilitation to enable their return to work. Alcohol-related and psychiatric conditions in particular reduce the prospects of finding employment (Junna et al., 2022). In the case of the population in a weak labour market position, initial employment following a period of unemployment often involves workshop work, rehabilitative work or work trials, and only after one or more of these may work in the open labour market be possible. However, the study conducted in Paltamo, Finland, found that approximately a quarter of the unemployed remain unable to secure employment in the open labour market (Kerätär et al., 2016).
It is crucial to study the differences between the unemployed who gain employment in the open labour market and those who do not, as well as the factors affecting their employment prospects (e.g., Matty, 2013; Nielsen Arendt et al., 2020). However, in the case of the population in a weak labour market position, it is important to observe even small beneficial changes in relation to work life, and not only the final result of gaining employment in the open labour market. These small changes may be a sign that the person is moving in the right direction, in other words, is more ready for work life.
In this quantitative, explorative, data-driven study, we focused on the unemployed individuals’ own assessment of their readiness for work life: how their feelings towards work life and about the possibility of gaining employment could be assessed by using self-report measure and whether certain factors of work ability and functioning were predictors of a beneficial change in this measure. While numerous previous studies (e.g., Andersson, 2015; Brouwer et al., 2015; Matty, 2013; Nielsen Arendt et al., 2020) have explored the transition from unemployment to employment, we were particularly interested in the less studied period when an unemployed individual is approaching work life but has not yet transitioned to employment. In research addressing this period, the concept of employability (see a review by Guilbert et al., 2016) has traditionally been used (e.g., Koen et al., 2013). However, the concept we introduced, readiness for work life, places greater emphasis on the individual’s perspective than the concept of employability does.
Our research focused on Finland. We utilised questionnaire data gathered in Finland in 2017 to 2022 using the Abilitator, a method for self-assessing work ability and functioning (Wikström et al., 2020). The Abilitator was used in a wide range of training and development activities that aim to support work ability and work participation.
The Abilitator – a self-report questionnaire on work ability and functioning
The Abilitator is a self-report instrument for measuring work ability and functioning. It is suitable for all people of working age, but especially those in a weak labour market position. The Abilitator was developed by the Finnish Institute of Occupational Health in 2014 to 2017 and it was funded by the European Social Fund (ESF). The development process is described in the article by Wikström et al. (2020).
The Abilitator is based on the multi-dimensional work ability model called the House of Work Ability (Ilmarinen et al., 2008) and the International Classification of Functioning, Disability and Health (ICF; WHO, 2001). In the model of the House of Work Ability (Ilmarinen et al., 2008), the dimensions of work ability are depicted in the form of a work ability house, its floors, and the surrounding environment. The first three floors of the work ability house describe individual human resources, such as health and functional capacity, knowledge and skills, values, attitudes, and motivation. The fourth floor describes work, consisting of work conditions, work content and demands, work community and organisation, and supervisory work and management. These floors form the work ability house which means balance between human resources and work. The work ability house is surrounded and influenced by family and close communities, such as friends and relatives, and, on a broader level, by society as a whole. The Abilitator does not cover the fourth floor of the work ability house, the floor of work, because those in a weak labour market position are largely without employment (Wikström et al., 2020).
The ICF biopsychosocial model of functioning (WHO, 2001) conceptualises functioning as a dynamic interaction between a person’s health condition, environmental factors and personal factors (WHO, 2013). The model sees operational constraints as a mismatch between the health of a person and the requirements of their life situation, and to minimise this disparity, the impact of environmental and individual factors must be considered in addition to the person’s health-related factors (Wikström et al., 2020).
Further, Wikström et al. (2020) describe the construct of the Abilitator using a framework of four concepts: work ability, health and functioning, inclusion, and employability. The concepts are partly overlapping. The factors of each concept that are relevant to the population in a weak labour market position are included in the Abilitator. In the case of the concept of work ability, the factors defined in the Abilitator include basic abilities, skills, competence and motivation, overall health and functioning, and experiences of one’s ability to work. The factors of work organisation and work community and individual work-related attitudes and specific skills are not defined in the Abilitator. As for the concept of health and functioning, the factors in the Abilitator encompass overall health and functioning, as seen also in the concept of work ability, as well as mental well-being, coping with everyday life, amount of social activity, feelings of loneliness, and work participation. Specific health-related symptoms and health history are excluded from the Abilitator. In the case of the concept of inclusion, the factors in the Abilitator include social inclusion with others and in society, feelings of autonomy and experiences of success, availability of help and support, and personal financial and social resources. The factors of work life inclusion, trusting in others, and societal resources are not defined in the Abilitator. Finally, in the case of the concept of the employability, the factors defined in the Abilitator include individual employability in terms of educational background and duration of employment, elements hindering employment, and beliefs about gaining employment or starting education. The factors of individual specific skills and work history are excluded from the Abilitator as well as the factors of employment politics, societal actions and global situation.
The content validity analysis (Wikström et al., 2020) showed that the Abilitator sufficiently comprehensively covers the relevant aspects to enable the assessment of the overall work ability and functioning of the population in a weak labour market position. The concurrent validity (Savinainen et al., 2022), intrarater reliability (Wikström et al., 2021) and structural validity (Wikström et al., 2024) of the Abilitator have also been demonstrated previously.
The Abilitator has 84 questions, divided into 9 sections (see the questionnaire in Wikström et al., 2020). The themes of the sections and the questions in each section are listed below:
A. Personal details (gender, age)
B. Well-being (satisfaction with life, overall functioning, perceived work ability and health, feeling in relation to work life; Questions B1–B5)
C. Inclusion (social functioning and social interaction; Questions C1–C17)
D. Mind (psychological functioning; Questions D1–D9)
E. Everyday life (coping with everyday life and caring for oneself; Questions E1–E11)
F. Skills (cognitive functioning, competence, attitude towards the future; Questions F1–F10)
G. Body (physical functioning; Questions G1–G12)
H. Background information (household status, economic situation, educational background; Questions H1–H4)
I. Work and the future (employment situation, faith in finding employment, wishes for changes in one’s life; Questions I1–I14)
The Abilitator is used in services and activities that aim to support work ability and work participation. For example, employment offices, municipal social services and rehabilitation service providers utilise the Abilitator in their activities. However, there are no restrictions which companies or organisations are allowed to use the Abilitator.
Readiness for work life
Readiness for work life is not a strictly defined concept. Broadly speaking, it means how the person is able to participate in work or potential work. Since the concept is ambiguous, there is neither established practice for measuring readiness for work life.
In this study, readiness for work life was measured by one self-report question of the Abilitator, which asks about the individual’s feelings in relation to work life. The response options for this question take into account three elements: whether the person is employed or not, how well the person is equipped for work life, and how much support the person needs. It is worth noting that the type of work is not defined or limited in any way within the response options. By covering three elements, the question of the feeling in relation to work life aggregates the respondent’s situation quite comprehensively. According to the Abilitator handbook, this question can be used for quick identifying of service and support needs (Wikström et al., 2023). The exact wording and scoring of the question are detailed in the Data and methods section.
The concept of employability is one of the four concepts in the construct of the Abilitator, as mentioned in the previous subsection. Particularly, the concept of readiness for work life, and the question that measures it – how the person feels in relation to work life – share similarities with the concept of employability. However, the definitions of the concept of employability also vary. McQuaid and Lindsay (2005) presented a broad employability framework built around individual factors (employability skills and attributes, demographic characteristics, health and well-being, job seeking, and adaptability and mobility), personal circumstances (household circumstances, work culture, and access to resources) and external factors (demand factors and enabling support factors). The concept of readiness for work life encompasses, at least in part, employability skills and attributes, health and well-being, and job seeking in individual factors, access to resources in personal circumstances and enabling support factors in external factors. Later Guilbert et al. (2016) made a review of the concept of employability and presented that three main non-exclusive perspectives can be identified: educational and governmental, organisational, and individual. They suggested to use the multidimensional concept of employability that takes all three perspectives into account, as for example Fugate et al. (2004) or Rothwell and Arnold (2007) have presented. According to Fugate et al. (2004), employability is a multidimensional aggregate of career identity, personal adaptability, and social and human capital. To some extent, the concept of readiness for work life covers similar elements: employment situation involves in career identity, work life equipment involves in personal adaptability as well as in social and human capital, and the need for support involves in social and human capital. The studies by McArdle et al. (2007) and Koen et al. (2013) on employability among the unemployed were based on the definition by Fugate et al. (2004), and these studies provided results that we could compare with our own findings.
Although the concepts of readiness for work life and employability share similar elements, their perspectives differ. The concept of employability adopts an external perspective, aiming to describe employment opportunities as objectively as possible. The concept of readiness for work life is more individually oriented, focusing on the person’s self-assessment of how strong they feel in the labour market. In other words, since the Abilitator is used in services aimed at supporting work participation, the client’s perspective on readiness for work life is of central importance. In addition, readiness for work life can be considered a largely neutral concept in relation to work life.
Data and methods
In this quantitative study, we explored the associations between improved readiness for work life and the factors of work ability and functioning, using longitudinal questionnaire data collected by the Abilitator in Finland from 2017 to 2022. We studied respondents who were unemployed at the time of their first response to the Abilitator. Readiness for work life was measured using the Abilitator’s question about the respondent’s feeling in relation to work life, and the final outcome variable in our analysis, ‘feeling closer to work life’, represented the change in this measure over time and was classified dichotomously. Other questions of the Abilitator were used as predictor variables in our analyses. Our study was data-driven and did not employ a causal framework, so we used explorative methods to identify associations.
Study sample
The data used in this study consisted of the responses to the Abilitator collected from April 2017 to April 2022. The data covered all the responses to the Abilitator that the companies and the organisations had supplied to the Finnish Institute of Occupational Health by early May 2022. Consequently, the data covered the entire population of the respondents to the Abilitator in this particular period.
Only respondents who indicated their gender as man or woman every time they responded were included in the analyses (Abilitator question of gender in the section A; there was also an ‘Other’ response option in addition to man and woman). The age-related criterion was an age of between 18 and 64 at each response time (Abilitator question of age in the section A). In addition to Finnish, the Abilitator has many other language versions, for example, Swedish and English. The analyses included responses in all languages.
As we were interested in changes in the responses, we only included respondents who had responded at least twice. Their first and final responses were selected for the analyses and all other responses were excluded. If, however, the time between the first and the final response was less than 14 days, the respondent was excluded.
Measure of readiness for work life – outcome variable
Readiness for work life was measured by asking about the respondent’s feeling in relation to work life – How do you feel in relation to work life at the moment? (Abilitator Question B5). It was measured on a self-reported scale of 0 to 10, as follows:
0 – Work life or employment does not currently apply to me.
1–3 – I don’t have a job. I’m poorly equipped for work life. I need support in order to obtain employment.
4–5 – I don’t have a job, but I am equipped for work life. I may need support in order to obtain employment.
6–8 – I have a job. I am equipped for work life. I may however need support in order to stay in employment.
9–10 – I have a job. I am well-equipped to continue in employment.
The final outcome variable we used in our analyses was ‘feeling closer to work life’. The variable was dichotomised as follows: if the respondents felt closer to work life (Abilitator Question B5) in their final responses than in their first responses, the variable value was 1; and if they felt more distant from work life or felt the same, the variable value was 0. The respondents were using services that aimed to support their work ability and work participation, and thus we focused on feeling closer to work life and considered it unreasonable to separate feeling more distant from work life and feeling the same.
Predictor variables
When Abilitator Question B5 was the outcome variable, most of the other Abilitator questions were used as predictor variables. Our initial plan was to use all Abilitator questions except for Question B5 as predictor variables, but this was not possible. Some questions were left out because our data were anonymous, requiring the exclusion of certain questions for data protection reasons, due to the small number of respondents in different answer option categories (Questions H1, H3, H4, I1, I2, and I10). Some other questions were omitted by us because these questions were contextually close to the outcome variable and/or were causing multicollinearity problems (Questions B1–B4, D1, F4–F6, I3–I9, and I11–I14). In addition, some questions were omitted by us because they were directed at only a small, limited subset of respondents (Questions G3, G5, and G7).
We used both summary variables and individual questions as predictor variables. The summary variables were:
Summary of Inclusion (sum of Questions C1–C8 and C14–C17 on a scale of 0% to 100%)
Summary of Mind (sum of Questions D1–D9 on a scale of 0% to 100%)
Summary of Everyday life (sum of Questions E1–E11 on a scale of 0% to 100%)
Summary of Skills (sum of Questions F1–F3, F5–F10, and E4 on a scale of 0% to 100%)
Summary of Body (sum of Question G1 and either Questions G4 and G6 (if G3 = ‘No’) or Questions G5 and G7 (if G3 = ‘Yes’) on a scale of 0% to 100%)
The scale of 0% to 100% means that the numerical values of the responses to the questions were summed up and the sum was proportioned to its maximum. For example, the responses to the Inclusion questions (C1–C8 and C14–C17) were between 1 and 5 (1 – Completely disagree, 5 – Completely agree) and the sum of the responses was proportioned to the value of 60.
The individual questions were:
Personal details: gender, age group (classified into categories 18–29, 30–49, and 50–64 years)
Inclusion: C1–C17
Mind: D2–D9
Everyday life: E1–E11
Skills: F1–F3, F7–F10
Body: G1–G2, G4, G6, G8–G12
Background information: H2
Except for five questions, all the individual questions that were included in the summary variables were also included in the models analysing the individual questions. The questions ‘I’ve been feeling optimistic about the future’ (D1), ‘I feel positive about the future’ (F5) and ‘I have dreams and hopes for the future’ (F6) were excluded because they were contextually close to the outcome variable, feeling closer to work life, and Questions D1, F5 and F6 were also close to each other, causing multicollinearity problems. We also excluded Questions G5 and G7. These questions were responded only by the respondents who regularly used some aid or equipment for moving around, for example, a wheelchair or a walking stick (G3 = ‘Yes’).
If the response to the question ‘Do you suffer from one or more prolonged physical or psychological illness, symptom or injury?’ (G8) was ‘No’, the respondent did not answer the questions about how much of an impediment these illnesses, symptoms and injuries were to leisure-time activities (G9), housework (G10), work or possible work (G11) and personal relationships (G12) on a scale 0 to 10 (0 – no impediment, 10 – worst possible impediment or huge impediment). When the response to Question G8 was ‘No’, the missing responses to Questions G9–G12 were replaced by a value of 0 in the analyses.
Final sample for analyses
Before conducting the analyses, we made additional preparations to the study sample. Since we were interested in the respondents who were unemployed at the time of their first response and needed help with gaining employment, we included only the respondents who scored 5 or less on Abilitator Question B5 in their first response. As we were especially interested in the respondents who could get closer to work life even though they did not necessarily obtain employment, we further excluded those who scored exactly 5 on Question B5 in their first response, to allow improvement by the time they gave their final response. Using this restriction, we could also partially avoid any selection bias that may possibly have followed if we had considered only gaining employment as an improvement. If the respondents had gained employment after the first response, it is likely that they would have stopped using the services and therefore not responded to the follow-up questionnaire. Some individuals responded after gaining employment and were thus included in our data, but their selection may not have been random.
After editing and applying the restrictions mentioned above, the final study sample consisted of 3,686 respondents. This sample served as the data for analysing associations between the outcome variable and the summary variables. When examining associations between the outcome variable and the individual questions, respondents who regularly used some aid or equipment for moving around, for example, a wheelchair or a walking stick (G3 = ‘Yes’), were excluded from the data due to the small number of respondents (N = 120).
Statistical methods
Before conducting the primary analyses, we computed descriptive statistics from the first responses. We did this for all respondents as well as for the respondent groups stratified by the feelings in relation to work life in the final response. Stratification was conducted according to whether the respondents had reported being unemployed (B5 < 6) or employed (B5 ≥ 6) in their final responses.
The primary goal of our analyses was two-fold. First, we examined which summary variables and individual questions in the first response were associated with the respondents feeling closer to work life (first response model). Second, we examined the changes, that is, which changes in the summary variables and in the individual questions were associated with the respondents feeling closer to work life (change model).
When analysing the first responses, we used logistic regression analysis for the summary variables and included them all as independent variables. For the individual questions, we used group lasso regularisation together with bootstrapping to reduce the number of independent variables. Group lasso allows categorical variables to be entered into the model as dummy variables which can then be excluded or retained as groups referring to the original categorical variables. As lasso can select variables inconsistently when correlation between the independent variables is strong, we used bootstrapping with 100 repetitions together with the group lasso. In each repetition we used cross validation to find the optimal lambda value and defined a lasso model using a lambda value that was one standard error from the optimal value to minimise the number of variables retained in the model. After bootstrapping, we retained only the variables that presented in at least 90% of the repetitions. We then fit a logistic regression model using the variables indicated as most important in the group lasso models.
When analysing the changes, we used the same approach for the summary variables as we had used when we analysed the first responses. To analyse the individual questions, some modifications were needed. We were not interested in changes in terms of gender or age groups between the first and final response, and often no such changes occurred, so we excluded those variables from the analyses. Thus, we used bootstrap-enhanced lasso instead of group lasso to analyse the individual questions.
The models were fitted in two groups: only the respondents who were unemployed at the time of their final response (B5 < 6 in final response) and all respondents (no limit in B5 in final response). This enabled us to see whether the results changed when the analysis was extended to also cover the employed respondents. However, it is worth remembering that the first group, unemployed respondents, was not affected by the previously mentioned selection bias concerning employed respondents; but the second group, all respondents, might have been affected by possible effects of selection bias.
Lastly, as the results could potentially be different depending on gender or age group, we also ran an analysis of the individual questions, both the first responses and the changes, stratified by gender and age group.
All analyses were done on R version 4.3.0 using packages gglasso (1.5), bolasso (0.2.0), and glmnet (4.1-7).
Results
The descriptive statistics of the first responses are shown in Table 1. Most of the respondents, over 80%, were unemployed at the time of their final response. The distribution of men and women did not differ among the unemployed and the employed respondents. As for age, the respondents whose feelings had become so much closer to work life that they were employed at the time of their final response tended to be somewhat younger than those who were unemployed. As we expected, the employed respondents felt closer to work life already in their first response. They also scored higher on all the summary variables in their first response.
Descriptive Statistics of First Responses Stratified by Feelings in Relation to Work Life in Final Response.

Original scale of Question B5 is 0 to 10. Our analysis included only respondents who scored 0 to 4 in their first response.
The results showing the associations between the summary variables and individual questions in the first response and feeling closer to work life are presented in Table 2. The odds ratios (OR), the 95% confidence intervals for the odds ratios, and the p-values for the significance of the odds ratios are reported. The results are shown for only the respondents who were unemployed at the time of their final response (B5 < 6 in final response) and separately for all respondents (no limit in B5 in final response). In both cases, analysis of the summary variables revealed that a higher summary of Skills (OR = 1.01 for unemployed, OR = 1.01 for all) and a higher summary of Body (OR = 1.01 for unemployed, OR = 1.01 for all) were statistically significantly associated with feeling closer to work life. For the individual questions, only the questions ‘I have skills that I can use in work life’ (F8) and ‘If you suffer from one or more prolonged physical or psychological illness, symptom or injury, assess how much of an impediment these illnesses, symptoms or injuries are to work or possible work’ (G11) were retained in the model after group lasso. The results were similar in both cases – only the unemployed respondents and all respondents. A higher score in skills that can be used in work life (OR = 1.17 for unemployed, OR = 1.25 for all) and a lower score in an impediment to potential work due to illnesses (OR = 0.92 for unemployed, OR = 0.91 for all) were statistically significantly associated with feeling closer to work life.
First Response Models: Associations Between Summary Variables of first Responses and first Responses to Individual Questions and Feeling Closer to Work Life.
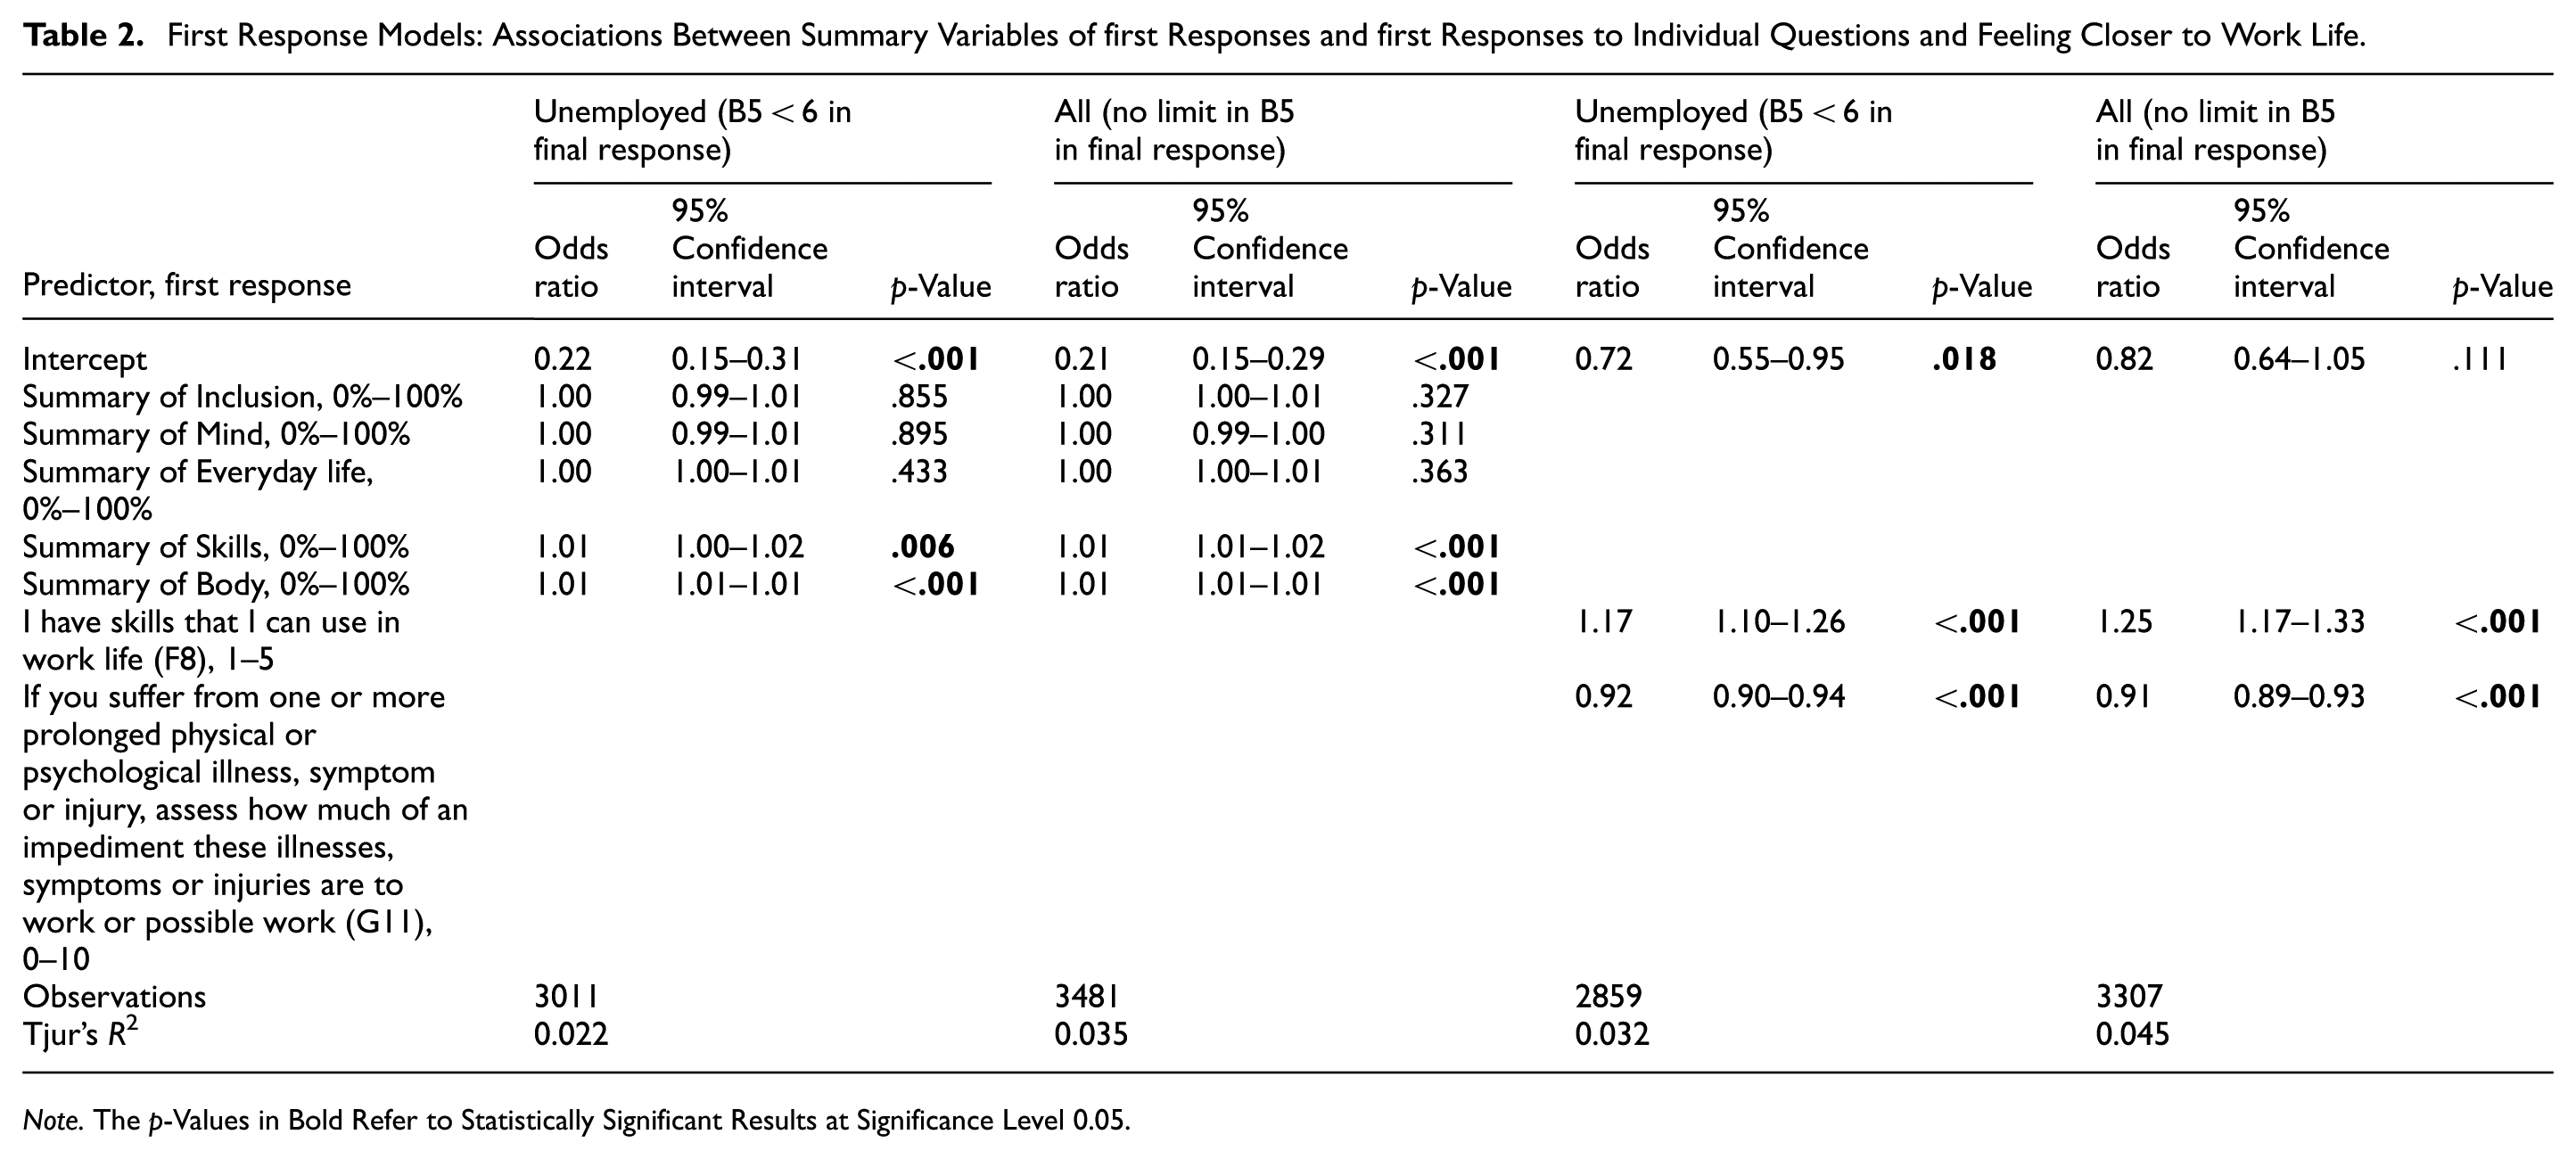
Note. The p-Values in Bold Refer to Statistically Significant Results at Significance Level 0.05.
The odds ratios for the summaries of Skills and Body were statistically significant but were quite close to 1. The scale of the summaries ranged from 0% to 100% and the odds ratio was 1.01 for both summaries in both groups. Therefore, a one percentage point positive difference in the summary was expected to show as 1% positive difference in the odds of feeling closer to work life. On the other hand, the statistically significant odds ratios for the individual questions F8 and G11 were further from 1. For the question F8, the scale was 1 to 5. For the unemployed, an odds ratio of 1.17 meant that a one-unit positive difference in the score was expected to show as 17% positive difference in the odds of feeling closer to work life. For all respondents, the odds ratio was 1.25, indicating 25% positive difference in the odds of feeling closer to work life. The situation for the question G11 was the opposite. The scale for the question was 0 to 10, and for the unemployed, the odds ratio was 0.92, which meant that a one-unit positive difference in the score was expected to show as 8% negative difference in the odds of feeling closer to work life. For all respondents, an odds ratio of 0.91 meant 9% negative difference in the odds of feeling closer to work life. If only the plain odds ratios had been observed, the odds ratios for the summaries would have appeared quite modest compared to those of the individual questions. However, the interpretation changed when the scales of the summaries and the individual questions were taken into account: one percentage point in a 0% to 100% scale represents a much smaller proportion of the total scale than one unit in a 1 to 5 or 0 to 10 scale.
The results regarding the changes in the summary variables and in the individual questions that were associated with feeling closer to work life are shown in Table 3. Increases in the summaries of Inclusion (OR = 1.01), Skills (OR = 1.02) and Body (OR = 1.01) were associated with feeling closer to work life among the unemployed respondents. When all the respondents were included, an increase in the summary of Mind was also associated with feeling closer to work life (OR = 1.02 for Inclusion, OR = 1.01 for Mind, OR = 1.02 for Skills, OR = 1.01 for Body). For the individual questions and the unemployed respondents, the questions ‘I feel part of society’ (C7), ‘I’ve been feeling useful’ (D2), ‘How well do you cope with housework’ (E1), ‘I have skills that I can use in work life’ (F8) and ‘I am able to express myself in different situations in writing’ (F10) were retained in the model after lasso and an increased score in these questions was associated with feeling closer to work life (OR = 1.18 for C7, OR = 1.22 for D2, OR = 1.17 for E1, OR = 1.19 for F8, OR = 1.14 for F10). In addition, the question ‘If you suffer from one or more prolonged physical or psychological illness, symptom or injury, assess how much of an impediment these illnesses, symptoms or injuries are to work or possible work’ (G11) was retained in the model and a decreased score in this question was associated with feeling closer to work life (OR = 0.95). When all the respondents were analysed, the questions about feeling part of society (C7), feeling useful (D2), feeling of having skills that can be used in work life (F8) and feeling of having an impediment to potential work due to illnesses (G11) were retained in the model and the associations were similar to those reported above (OR = 1.21 for C7, OR = 1.30 for D2, OR = 1.26 for F8, OR = 0.95 for G11). In addition to these questions, ‘I’ve been thinking clearly’ (D5), ‘In your opinion, is your level of physical fitness: poor–good’ (G1) and ‘Does the total income of your household cover your costs: very poorly–very easily’ (H2) were retained in the model and an increase in these questions was associated with feeling closer to work life (OR = 1.15 for D5, OR = 1.20 for G1, OR = 1.12 for H2).
Change Models: Associations Between Changes in Summary Variables and in Responses to Individual Questions and Feeling Closer to Work Life.

Note. The p-Values in Bold Refer to Statistically Significant Results at Significance Level 0.05.
The results stratified by gender and age group are shown in Tables 4 to 11 in Appendix. Examination of the first response models revealed that a lower score in feeling of having an impediment to potential work due to illnesses (G11) was associated with feeling closer to work life among both genders. The same association was found for the 18 to 29 and 30 to 49 age groups. When only the unemployed respondents were analysed, the association also held for the oldest age group, 50 to 64 years. When we analysed only the unemployed respondents, we found no associations between feeling of having skills that could be used in work life (F8) and feeling closer to work life, but when the analyses were extended to all the respondents, a higher score in skills that could be used in work life was associated with feeling closer to work life among women and in the 30 to 49 and 50 to 64 age groups.
The results concerning the change models were more inconsistent among the different genders and age groups than those concerning the first response models. However, we obtained some fairly clear findings. Among men, an increased score in the question ‘Do you exercise? I don’t exercise – I exercise at least three times a week’ (G2) was associated with feeling closer to work life. This association was not found among women. On the other hand, among women, a decreased score in feeling of having an impediment to potential work due to illnesses (G11) was associated with feeling closer to work life, but this association was not found among men. An increase in the question about feeling useful (D2) was associated with feeling closer to work life in the 30 to 49 and 50 to 64 age groups but the question was insignificant in the youngest age group, 18 to 29 years. In the oldest age group, an increase in feeling of coping well with housework (E1) was associated with feeling closer to work life, and for the 30 to 49 age group, an increase in the question ‘How well do you cope with taking care of personal hygiene’ (E8) was associated with feeling closer to work life. In the youngest age group, an increase in the question ‘How would you currently rate your memory? Is it: very poor–very good’ (F3) was statistically significantly associated with feeling closer to work life. Surprisingly, in the oldest age group, a decrease in memory rating was associated with feeling closer to work life, though the statistical significance was not very strong. Only in the youngest age group was an increase in feeling of having income that easily covered costs (H2) associated with feeling closer to work life. The questions about feeling that one was able to think clearly (D5) and able to express oneself in different situations in writing (F10) were not included in the change models stratified by gender or age group, even though these questions were included in the change models when no stratifications were made.
Discussion
In this study we explored how the unemployed individuals’ readiness for work life could be assessed by using self-report measure and whether certain factors of work ability and functioning were predictors of a beneficial change in this measure. We used longitudinal questionnaire data gathered in Finland in 2017 to 2022. The data were collected using the Abilitator, which is an instrument for self-assessing work ability and functioning. The Abilitator was used in training and development activities that aim to support work ability and work participation. The respondents were unemployed the first time they responded to the Abilitator. Many of them were in a weak labour market position and had work ability challenges. Each respondent completed the Abilitator at least twice and the first and the final responses were used in the analyses.
The Abilitator measured readiness for work life by asking ‘How do you feel in relation to work life at the moment?’. The scale of the response options was 0 to 10: a lower score indicated that the respondent was unemployed, poorly equipped for work life and needed a great deal of support – a higher score indicated that the respondent was employed, well equipped for work life and needed little or no support. The final outcome variable, ‘feeling closer to work life’, was dichotomous and derived from the change between the first and final responses regarding feeling in relation to work life. As predictor variables we used both the Abilitator’s summary variables – Inclusion, Mind, Everyday life, Skills, and Body – and its individual questions. We explored the predictor variables in two ways: first, by examining which variables in the first response were associated with feeling closer to work life (first response model), and second, by examining which changes in these variables were associated with feeling closer to work life (change model).
According to the results of the first response model, a higher summary of Skills and a higher summary of Body at the time of the first response were associated with feeling closer to work life later. Two individual questions within these summaries were significant on their own: the stronger feeling of having skills that can be used in work life was associated with feeling closer to work life, and the less the unemployed individual felt they had an impediment to potential work due to illnesses at the time of the first response, the better chance they had of feeling closer to work life later. Analysis of the changes revealed that the same factors were essential: increases in the summaries of Skills and Boby as well as an increase in feeling of having skills and a decrease in feeling that one had an impediment were associated with feeling closer to work life. Furthermore, an increase in the summary of Inclusion and positive changes in feeling part of society and in feeling useful between the first and the final response were associated with feeling closer to work life.
The results are reasonable. If a person feels that they have learned some of the new skills mentioned in, for example, job advertisements, it is natural that they feel they have better opportunities to find a job. This further boosts their feelings of being part of society and being useful in general, and these feelings grow even stronger if the respondent gains employment. As regards feeling that one has an impediment to potential work due to illnesses, if the illnesses were cured or the symptoms relieved as a result of treatment, the impediment may also be reduced and the respondent may feel they need less support.
The stratified analyses by gender and age provided valuable insights into the sensitivity of the results. According to the first response model of the individual questions, less impediments to potential work due to illnesses at the time of first response were associated with feeling closer to work life among both genders. This association was also widely observed across all age groups. The association between a stronger feeling of having skills that can be used in work life and feeling closer to work life was found among women and individuals aged 30 years or older when analysing all respondents, including those already employed at the time of their final response. In conclusion, the stratified analyses of the first response model did not identify any individual questions that had not already been highlighted by the non-stratified analysis. Therefore, we can say that our first response model was very robust across different genders and age groups.
As regards to the change model of the individual questions, the stratified results were more varying than in the case of the first response model. Decreased feeling of having an impediment to potential work due to illnesses was associated with feeling closer to work life among women but not at all among men. An increase in feeling useful was associated with feeling closer to work life in the 30 to 49 and 50 to 64 age groups but not in the youngest age group, 18 to 29 years. Among men, an increase in exercising was associated with feeling closer to work life. It is possible that the distribution of occupations by gender plays a role here, with men potentially working more often than women in jobs that require good physical fitness. In Finland, the most common occupational groups for men in 2020 were heavy truck and lorry drivers, shop sales assistants, and house builders, while for women, the most common groups were health care assistants, nurses, and shop sales assistants (Statistics Finland, 2022). In the oldest age group, 50 to 64 years, an increase in feeling of coping well with housework was associated with feeling closer to work life, as well as in the 30 to 49 age group, an increase in taking care of personal hygiene had a similar association. Previous studies have found a positive association between doing housework and better health among older adults, aged 65 years and above (Adjei & Brand, 2018; Chu et al., 2023). In the youngest age group, better self-rated memory and an increase in feeling of having income that easily covered costs were associated with feeling closer to work life.
It is essential to remember that our study did not have a causal framework, which meant we could examine associations between improved readiness for work life and the predictors, but the direction of these associations remained uncertain. Typically, the effect could be bidirectional, at least to some extent. For example, in the case of feeling of having skills that can be used in work life, a person might first learn a new skill which increases their perception of having useful skills. This, in turn, strengthens their self-confidence in succeeding in working life, leading them to feel closer to work life. Furthermore, the increased feeling of being closer to work life might encourage them to learn another new skill, which in turn strengthens their feeling of having skills that can be used in work life. Occasionally, the effect is likely only one-way. For example, in the youngest age group, an increase in feeling of having income that easily covered costs was associated with feeling closer to work life. In that case, it is very possible that the individual first became employed or engaged in rehabilitative work with some earnings, leading them to feel closer to work life. With increased earnings, their perception of having income that easily covered costs also improved.
Because we used a novel question to assess feeling in relation to work life, there are no other studies with an identical outcome measure with which to compare the results. However, the results might be compared to those of studies in which the outcome measure is whether or not the person gains employment. Our results are fairly consistent with those of a Danish study of the long-term unemployed: a higher value in an index composed of the unemployed individual’s own assessment of their health, daily energy and self-efficacy predicted short-term employment (Nielsen Arendt et al., 2020). In a study of Swedish workers who had been made redundant, work-related self-efficacy was also one of the factors that predicted re-employment (Andersson, 2015). Among the newly unemployed in the Netherlands, feeling too ill to work and experiencing health problems negatively affected re-employment success, and re-employment expectations and better general work ability positively affected it (Brouwer et al., 2015).
As mentioned in the introduction, the concept of employability is similar to the concept of readiness for work life and the question of how the person feels in relation to work life, at least in some respects. Our results are not in conflict with results concerning the relationship between employability, defined according to Fugate et al. (2004), and gaining employment. When the construct of employability was applied to a sample of unemployed Australians, employability was significantly related to re-employment, and adaptability and career identity were particularly important in obtaining re-employment (McArdle et al., 2007). Also, among long-term unemployed individuals in the Netherlands, employability fostered job-searching and the likelihood of finding employment: adaptability and career identity fostered job-searching, and social and human capital – and again also career identity – predicted re-employment success (Koen et al., 2013).
We used a single question to measure readiness for work life. Clearly, this question is not the only way to conceptualise readiness for work life, so validation of our question is necessary. For this, cross-checking responses with simultaneous employment register data on whether or not the person is employed could be useful. Also, for example, a parallel examination of self-assessment responses alongside officials’ observations of the unemployed person’s readiness for work life might be effective. There is currently an ongoing study examining the responsiveness of the Abilitator, which aims to contribute to its validation. This study compares changes in the Abilitator responses during rehabilitation to changes in the attainment of vocational rehabilitation goals set using the Goal Attainment Scaling (GAS) method. For more information on GAS, see Kiresuk et al., 1994.
While register data on employment status is certainly useful for cross-checking against our question of measuring readiness for work life, it is important to remember that being employed or not is only one of the three elements in our question. Measuring readiness for work life instead of measuring only gaining employment enables us to observe even small moves towards work life even if the person is not employed yet. Measuring readiness for work life might also be a more robust method than measuring employment. Gaining employment depends on many factors, some of which are partially random, for example, whether there are open vacancies in the area in which the jobseeker lives or economic conditions in general.
Compared to the concept of employability, the concept of readiness for work life is neutral and focuses on the individual’s perspective. This approach allows us to capture the respondent’s thoughts as authentically as possible, meaning the respondent answers based on their own perception of their situation, rather than how they believe outsiders perceive their situation. The client’s own perspective on their readiness for work life serves as a valuable starting point for activities in services aimed at supporting work participation.
It is worth noting that there are obstacles to improving readiness for work life that our question does not consider. The obstacles may arise from the personal situation of the respondent, or from workplace or societal perspectives. One example of such obstacles is caring responsibilities. Previous studies have shown that informal caregiving for parents negatively affects labour force participation (Ciccarelli & Van Soest, 2018; Kolodziej et al., 2018). Another example of obstacles is ageism which can act in a plurality of aspects, such as obstacles in the hiring process, employability and performance evaluation of older workers (Cebola et al., 2023).
The Abilitator question of self-reported feeling in relation to work life was already from the beginning projected for quick identifying of service and support needs (Wikström et al., 2023). Our study reinforced the fact that the question works well in quick identifying of a respondent’s situation. The Abilitator as a whole, in turn, provides a more comprehensive indication of the respondent’s situation. A similar relation between the instrument as a whole and a quick identifying question has been found between the Work Ability Index (WAI) and the single-item question addressing the WAI item ‘current work ability compared with the lifetime best’, which is known as the Work Ability Score (WAS) (Ahlstrom et al., 2010).
The predictors we found revealed – unsurprisingly – that treating all illnesses, symptoms, and injuries is crucial for enhancing readiness for work life. The information on predictors should be utilised in planning training and development activities aimed at supporting work participation. It is profitable to design training content that develops useful skills for work life. In addition, the activities that strengthen the feeling of being part of society and the feeling of being useful are advantageous.
Strengths, limitations, and future research directions
The data we used in our analyses consisted of nearly 4,000 questionnaire respondents. Our data covered the entire population of the respondents to the Abilitator in April 2017 – April 2022. The data were a non-probability sample of the population in a weak labour market position. However, because we explored the associations between variables, the non-probability sample was usable. It is noteworthy that as those in a weak labour market position might be difficult to reach and persuade to respond to surveys, our data of about 4,000 respondents are valuable.
We carried out our analyses in two groups: only the respondents who were unemployed at the time of their final response and all respondents, that is, employed respondents included. The analyses of the unemployed respondents showed what happens during the period when an unemployed individual is approaching work life but has not yet gained employment. This period has not very often been the subject of research, and thus our study fills this research gap.
As we analysed the respondents who were unemployed at the time of their final response as a separate group, we avoided the possible consequences of selection bias. However, selection bias might have affected the results concerning the ‘all respondents’ group, because those who were in employment when they responded to the questionnaire follow-up might not have been randomly selected.
We conducted analyses stratified by gender and age, which provided information on how sensitive the results were. Analyses stratified by educational or occupational background would also have been useful for examining sensitivity, as educational and vocational background may influence how a person perceives the demands of work life. For example, respondents with a background in physical occupations might view physical functioning as more essential compared to those with office work experience. Unfortunately, such analyses were not possible because, although information on educational background was gathered in the Abilitator questionnaire, we did not have access to this data due to data protection reasons. In addition, we lacked information on the type of their new job or the profession the job required for the respondents who reported being employed in their final responses. Consequently, we could not assess the extent of underemployment. Underemployment, which occurs when a worker is employed in a job that is inferior by some standard, has generally been found to have negative impacts on workers (McKee-Ryan & Harvey, 2011).
We examined whether the unemployed individuals’ readiness for work life had improved. We did not differentiate between unchanged readiness and reduced readiness. In the future, this type of analysis of reduced readiness for work life could be valuable. Analysing reduced readiness, in addition to cross-checking the Abilitator responses with simultaneous employment register data and officials’ observations, as previously mentioned, would contribute to validating the method of measuring readiness for work life.
Conclusions
The purpose of this study was to examine how the unemployed individuals’ readiness for work life could be assessed by using a self-report measure and which factors of work ability and functioning were predictors of a beneficial change in this measure. The method we used to measure the readiness for work life – self-reported feeling in relation to work life – seemed to be suitable for unemployed individuals who were in a weak labour market position. The results showed that especially the feeling that one has skills that can be used in work life and less impediments to potential work due to illnesses were associated with feeling closer to work life. The research findings can be utilised in planning training and development activities aimed at supporting work participation.
Footnotes
Appendix: Result tables for first response and change models stratified by gender and age group
Change Models Stratified by Age Group: Associations Between Changes in Responses to Individual Questions and Feeling Closer to Work Life. All Respondents (No Limit in B5 in Final Response).

| Predictor, change (final response–first response) | 18–29 years | 30–49 years | 50–64 years | ||||||
|---|---|---|---|---|---|---|---|---|---|
| Odds ratio | 95% Confidence interval | p-Value | Odds ratio | 95% Confidence interval | p-Value | Odds ratio | 95% Confidence interval | p-Value | |
| Intercept | 1.15 | 1.01–1.30 |
|
0.90 | 0.79–1.02 | .114 | 0.72 | 0.63–0.83 |
|
| I get help when I need it (C1), 1–5 | 1.23 | 1.06–1.43 |
|
||||||
| I am needed by others (C2), 1–5 | 1.28 | 1.09–1.50 |
|
||||||
| I am in charge of the course of my life (C6), 1–5 | 1.23 | 1.07–1.41 |
|
||||||
| I feel part of society (C7), 1–5 | 1.24 | 1.09–1.41 |
|
||||||
| I’ve been feeling useful (D2), 1–5 | 1.38 | 1.16–1.65 |
|
1.61 | 1.32–1.98 |
|
|||
| How well do you cope with housework (E1), 1–5 | 1.28 | 1.07–1.53 |
|
||||||
| How well do you cope with taking care of personal hygiene (E8), 1–5 | 1.31 | 1.08–1.60 |
|
||||||
| How would you currently rate your memory? Is it: very poor–very good (F3), 1–5 | 1.40 | 1.18–1.66 |
|
0.80 | 0.64–1.00 |
|
|||
| I have skills that I can use in work life (F8), 1–5 | 1.39 | 1.22–1.60 |
|
1.22 | 1.06–1.40 |
|
|||
| In your opinion, is your level of physical fitness: poor–good (G1), 1–5 | 1.27 | 1.07–1.52 |
|
||||||
| If you suffer from one or more prolonged physical or psychological illness, symptom or injury, assess how much of an impediment these illnesses, symptoms or injuries are to work or possible work (G11), 0–10 | 0.93 | 0.89–0.98 |
|
0.94 | 0.90–0.99 |
|
|||
| Does the total income of your household cover your costs: very poorly–very easily (H2), 1–6 | 1.25 | 1.11–1.40 |
|
||||||
| Observations | 1,172 | 1,092 | 907 | ||||||
| Tjur’s R2 | .092 | .094 | .070 | ||||||
Note. The p-Values in Bold Refer to Statistically Significant Results at Significance Level 0.05.
Acknowledgements
We thank the staff of the project ‘The Social Inclusion and the Change of One’s Work Ability and Capacity’ (Solmu) at the Finnish Institute of Occupational Health for their help with the Abilitator and many practical issues. We also thank the company Altexta for conducting the English language review of the original version of this manuscript. The ChatGPT service at the Finnish Institute of Occupational Health was used for improving language clarity and proofreading of the revised version of this manuscript.
Ethical considerations
Research on the Abilitator was approved by the ethics board of the Finnish Institute of Occupational Health in June 2017 (6/2017 - 6 §).
Consent to participate
The respondents of the Abilitator were told that responding to the questionnaire is voluntary and the responses will be confidential. The respondents were informed that the response data will be transferred to the Finnish Institute of Occupational Health, the institute will report the results in academic and popular scientific publications, and before any publishing the data will be converted into such a form that the respondents cannot be identified from it. In conclusion, the respondents were informed that by responding they give their consent for the data to be used in the operations of the Finnish Institute of Occupational Health.
Author contributions
EA, JA and MJ designed the study. EA and JA managed the data, and JA performed the statistical analyses. EA, MW, JA and MJ discussed the results. EA was the primary author of the manuscript, and MW, JA and MJ also contributed to writing the manuscript. MW is the most experienced content expert of the Abilitator, and MJ is the principal investigator of the Abilitator research. All authors read and approved the final manuscript.
Funding
The authors disclosed receipt of the following financial support for the research, authorship, and/or publication of this article: This study utilised questionnaire data gathered using the Abilitator. The Abilitator was co-developed in 2014 to 2017 at the Finnish Institute of Occupational Health in ‘The Social Inclusion and the Change of One’s Work Ability and Capacity’ (Solmu), a national coordination project funded by the European Social Fund (ESF) Priority 5 programme (2014–2023) [grant number S20237]. Also, the analyses and writing of this article were supported by the European Social Fund (ESF) Priority 5 programme via Solmu-project.
Declaration of conflicting interests
The authors declared no potential conflicts of interest with respect to the research, authorship, and/or publication of this article.
Data availability statements
The data that support the findings of this study are available from the Finnish Institute of Occupational Health (FIOH), but restrictions apply to the availability of these data, which were used under license for the current study, and so are not publicly available. Data are however available from the authors upon reasonable request and with the permission of the Finnish Institute of Occupational Health (FIOH).