
Abstract
As global ESG (environmental, social, and governance) data increases, the ESG data standards of emerging markets and developed countries are different, and the disclosure differences are significant. In addition, the lack of non-financial factors and lax pre-processing have limited the quantitative and comparative research of cross-national mergers and acquisitions (M&A). In this study, a unified scoring system is constructed to target the heterogeneity of ESG indicators in various countries. By retaining the country weight differences in the raw data, the impact of standard differences on the score is separated in the normalization process. Subsequently, cross-national M&A transaction data is obtained from the database, and the premium rate formula is used to calculate the M&A premium of each transaction as the empirical regression-dependent variable. This paper uses ordinary least squares (OLS) to construct a multivariate regression model to examine the impact of ESG scores on M&A premiums while taking financial, industry, and macroeconomic factors as control variables. Finally, this study selects instrumental variables such as historical ESG disclosure duration and national regulatory intensity, uses two-stage least squares (2SLS) for estimation, and uses heteroskedasticity-robust standard errors and split-sample tests to test the robustness of the model results. The experiment shows that the explanatory power of ESG scores on M&A premiums in the benchmark model is R2 = .214, which rises to R2 = .415 after controlling for financial, industry, and macro variables; R2 in developed country samples is .442, significantly higher than 0.359 in emerging markets; the 2SLS model has a lower prediction error, with an F-statistic of 107.57, p < .001, and a significant regression coefficient without multicollinearity. This provides a clear path for quantifying the impact of different countries’ ESG standards on cross-national M&A premiums.
Plain Language Summary
In this study, a unified scoring system is constructed to target the heterogeneity of ESG indicators in various countries. By retaining the country weight differences in the raw data, the impact of standard differences on the score is separated in the normalization process. Subsequently, cross-national M&A transaction data is obtained from the database, and the premium rate formula is used to calculate the M&A premium of each transaction as the empirical regression-dependent variable. This paper uses ordinary least squares (OLS) to construct a multivariate regression model to examine the impact of ESG scores on M&A premiums while taking financial, industry, and macroeconomic factors as control variables. Finally, this study selects instrumental variables such as historical ESG disclosure duration and national regulatory intensity, uses two-stage least squares (2SLS) for estimation, and uses heteroskedasticity-robust standard errors and split-sample tests to test the robustness of the model results. The experiment shows that the explanatory power of ESG scores on M&A premiums in the benchmark model is R2 = 0.214, which rises to R2 = 0.415 after controlling for financial, industry, and macro variables; R2 in developed country samples is 0.442, significantly higher than .359 in emerging markets; the 2SLS model has a lower prediction error, with an F-statistic of 107.57, p.
Keywords
Introduction
In recent years, global ESG investment has experienced explosive growth, exceeding $35 trillion by the end of 2023, accounting for one-third of global assets under management. However, this growth is accompanied by a significant fragmentation of standards: there are over 600 ESG rating methodologies globally, and only MSCI and Sustainalytics have low correlation coefficients between their ESG scores for the same company . This disparity is particularly pronounced in cross-border mergers and acquisitions. The EU’s Sustainability Reporting Directive requires companies to disclose 12 core environmental indicators and imposes a fine of 5% of annual turnover, while India only recommends disclosure of five social indicators and has no penalty mechanism. A 2022 survey of cross-border mergers and acquisitions reveal that the vast majority of transaction parties believe that differences in ESG standards lead to valuation disagreements, extend transaction cycles by an average of 42 days, and increase due diligence costs. These practical challenges highlight the urgency of quantifying the impact of differences in ESG standards on merger and acquisition premiums and provide a clear practical background for this research.
In recent years, as the concept of sustainable development continues to advance worldwide, corporate environmental, social, and governance (ESG) performance has gradually become an important dimension for measuring corporate long-term value and risk management capabilities. Regulators and investors in various countries continue to pay more attention to ESG factors, and different capital markets have increasingly stringent requirements for corporate non-financial information disclosure (Hussain et al., 2024; Kim et al., 2022; Tampakoudis et al., 2021). In this context, when transnational corporations make M&A decisions, ESG standards, as a component of non-financial evaluation, have a substantial impact on M&A intentions, transaction structures, and price negotiations (Marota, 2024; R. Ma et al., 2024). However, there are wide differences in ESG information disclosure standards, evaluation criteria, and regulatory systems between different countries and regions (Crous et al., 2022; Waqar & Ma, 2025), which has led to a significant reduction in the comparability of corporate ESG performance in cross-national M&A activities. This difference not only makes it difficult for investors to form stable expectations during the valuation process but also exacerbates information asymmetry in M&A transactions (A. K. F. Ma et al., 2025; Dwivedi et al., 2023; Robu et al., 2025), thereby affecting the formation mechanism of M&A premiums. The impact of differences in ESG standards on premiums in cross-national M&A is due to institutional data barriers. The systematic differentiation of countries in the definition of ESG indicators, weight allocation, and regulatory intensity makes it difficult for companies to compare their ESG performance across countries. This heterogeneity not only distorts the valuation benchmark (emerging market data lacks credibility) but also pushes up the cost of information verification, which is ultimately reflected as an institutional discount/premium in transaction pricing through premium fluctuations. Existing studies often treat ESG as a homogeneous variable, ignoring the interference of standard differences on the comparability of scores, resulting in an endogenous bias in the “ESG-premium” causal chain in a cross-national context. Quantifying the marginal contribution of standard differentiation to premiums and identifying the heterogeneous transmission paths of strict regulation and loose systems (India) have become the core gaps between theory and practice.
When analyzing cross-national M&A activities, most existing studies have focused on the role of financial variables in determining premiums, such as the target company’s profitability, asset structure, cash flow status, and industry cycle. The theoretical basis of these studies is mainly based on the traditional corporate valuation and information asymmetry theory framework, which believes that financial indicators are the core basis for evaluating the value of target companies (Gyönyörová et al., 2023; Louche et al., 2023). In contrast, ESG factors, as an emerging dimension to measure corporate sustainability and risk management capabilities, are often regarded as secondary variables in the M&A valuation process, resulting in systematic deviations in the understanding of M&A pricing mechanisms (Cai et al., 2025; Wang et al., 2024). In addition, some studies that attempt to incorporate ESG into M&A analysis are still crude in method design and data processing (Fazel, 2023; Lodh et al., 2024), making it difficult to form a rigorous causal identification structure, and have not fully considered the heterogeneous impact of ESG standards in different national institutional contexts.
To fill this gap in theory and practice, some scholars have begun to pay attention to the role of ESG factors in cross-national M&A, and have tried to build a comprehensive scoring system to quantify the ESG performance of companies. Related studies have attempted to use ESG indicators from third-party data sources such as Bloomberg and Refinitiv, combined with technical means, such as factor analysis and multi-level regression, to statistically test the relationship between ESG performance and M&A premium (Rustam & Chengxuan, 2023; Zou et al., 2025). However, these studies often ignore the differences in the international applicability of ESG indicators when constructing the indicator system and especially fail to address the interference caused by the inconsistencies in indicator setting, weight allocation, and scoring logic of various ESG evaluation methods (Biondi, 2025; Kang and Ahn, 2024; Li and Sun, 2024). In addition, the data samples are generally concentrated in developed countries with a high degree of disclosure, lacking comprehensive coverage of emerging markets, which also limits the overall applicability and policy recommendations of the research results (Akyildirim et al., 2025; Ping et al., 2023). Existing research has formed three main theoretical perspectives on the relationship between ESG and M&A, providing the hypotheses for this study. The institutional theory perspective posits that ESG performance is a signal of a company’s adaptation to the institutional environment. Companies with high ESG scores can reduce regulatory risks and gain an “institutional legitimacy premium,” especially in developed countries with strict regulation. The signaling theory perspective emphasizes the role of ESG as a quality signal, alleviating information asymmetry and enabling high-quality companies to command higher valuations. However, some scholars have pointed out that in emerging markets, due to the voluntary nature of ESG disclosure and weak verification mechanisms, ESG signals may be perceived as “greenwashing” and negatively interpreted by the market. Based on these theoretical divergences, this study proposes a core hypothesis: ESG standard differences moderate the relationship between ESG scores and M&A premiums. In markets with strict regulation and strong enforcement, ESG scores have a significant positive impact on premiums; in markets with lax regulation, this relationship weakens or even reverses. This hypothesis not only integrates existing theories but also, by introducing the moderating variable of “standard differences,” addresses the limitation of previous studies that treat ESG as a homogeneous variable, providing a more refined analytical framework for ESG valuation in cross-border M&A.
This study aims to apply a more systematic and standardized ESG scoring method based on existing research to solve the problem of heterogeneity of cross-national ESG data, thereby improving the theoretical depth and empirical credibility of cross-national M&A premium research (Idris, 2024; Nazliben et al., 2024). The study first clarifies the standard source of ESG indicators, selects six core indicators of environmental pollution control, energy efficiency, employee treatment, social contribution, board structure, and transparency, and constructs a unified ESG comprehensive score based on principal component analysis (Alkaraan et al., 2023; Rumasukun & Noch, 2024; Valle & Marullo, 2022). To improve the international comparability of data, this paper uses Z-score normalization to standardize the indicator data to eliminate dimension and scale differences. Meanwhile, cross-national M&A transactions that occurred between 2018 and 2022 are selected, and the market valuation and actual transaction price of the target companies are obtained through the database. The M&A premium is calculated as the dependent variable of the empirical study (Khatri, 2023; Svetlana & Martun, 2022).
In terms of model construction, this paper uses OLS to establish a regression model, taking the target company’s ESG comprehensive score as the core explanatory variable, controlling financial variables, industry characteristics, and macroeconomic factors (Sethuram & Gaur, 2024; Spagnuolo, 2025) to identify the specific impact path of ESG standard differences on cross-national M&A premiums. Considering that ESG scores may have a two-way causal relationship with variables such as corporate financial characteristics and institutional background, this paper adopts the instrumental variable method, selects historical ESG disclosure duration and the regulatory intensity of the country where the company is located as exogenous instrumental variables (Arslan et al., 2021; Gibadullina, 2024), and uses the 2SLS method to deal with the model’s endogeneity problem (Chen et al., 2024; Khurram et al., 2024). In terms of the robustness of the results, the study uses heteroskedasticity robust standard errors and split-sample regression methods (Elshandidy et al., 2025; Pelei et al., 2024) to test the model’s stability and effectiveness under different settings.
ESG Standard Difference Measurement and Cross-National M&A Premium Estimation
Global ESG Data Collection and Preprocessing
Data Source Construction and Sample Screening
This study selects international ESG databases as the main data source, covering the period from 2018 to 2022, and covering listed companies in major countries around the world. All three types of databases have cross-industry and cross-national ESG evaluation systems and provide structured rating data, which are suitable for time series and panel data modeling needs. The initial raw data sample size is 34,728 company-year observations, covering G20 countries and some key emerging economies.
The sample screening adopts a double-elimination standard. First, companies that have not disclosed ESG core dimension data (environmental E, social S, and governance G) for five consecutive years are eliminated to avoid missing values interfering with the stability of the index aggregation structure. Second, based on the coverage of Refinitiv and Morgan Stanley Capital International (MSCI) rating data, samples with data conflicts or significant outliers (such as the environmental dimension scores of the same company in the same year differ by more than ±3 standard deviations between the two databases) are removed and corrected by data comparison. The final effective sample after screening is 17,286 company-year observations, which have sufficient industry and country representativeness. Developed economies and emerging market countries account for 64.1% and 35.9% of the sample, respectively, and the distribution is in line with the basic pattern of globally listed companies.
The country distribution information is collated simultaneously with the ESG regulatory intensity information of the country or region (such as the year of ESG mandatory disclosure legislation and the density of regulatory rating indicators), which is used as instrumental variables in the regression model later.
Normalization and Standardization of ESG Indicators
To unify the measurement units and evaluation intervals of different rating agencies in different countries under the ESG dimension, the Z-score standardization method is used to normalize all raw scores. The specific calculation method is Formula 1:

Among them,
In addition, to enhance the horizontal comparability between indicators, the specific indicators under the three dimensions of environment (E), society (S), and governance (G) are standardized by item. Taking the environmental dimension as an example, three indicators, namely carbon emission intensity (greenhouse gas emissions per unit of operating revenue), the proportion of renewable energy use, and water resource management performance are selected as environmental sub-items, and a weighted average is performed after normalization. The weight is calculated by the inverse of the standard deviation of each item, that is, the smaller the standard deviation, the greater the weight, forming a more stable indicator aggregation method and reducing the impact of extreme values on the overall score.
After all, variables are standardized, the data is stored in the form of a panel, and the structure is a three-level index format of “company-year-dimension”, which is convenient for subsequent dynamic processing of principal component analysis and regression modeling. The ESG scoring system under the final unified standard can effectively control the heterogeneity of evaluation standards between different countries and serve as the basis for quantifying cross-national ESG differences in subsequent research.
Quantification of Differences in National ESG Standards
To systematically measure the impact of differences in ESG standards in different countries and regions on cross-national M&A premiums, this study quantifies the heterogeneity of ESG systems in different countries from two dimensions: regulatory intensity and indicator weight. First, a national ESG regulatory intensity index is constructed based on the legislation time, the number of mandatory disclosure indicators, and the severity of penalties, and the sample countries are divided into “strict regulation” (such as the European Union (EU) and the United States) and “loose regulation” (such as India and Brazil). The EU’s Corporate Sustainability Reporting Directive requires companies to disclose 12 core environmental indicators (including carbon emission intensity and renewable energy share) and imposes a fine of 5% of annual turnover for data falsification. India only recommends that companies disclose five social indicators, lacking a clear penalty mechanism. Second, by analyzing the ESG rating frameworks of various countries, regional preference differences in indicator weights are identified. The weight of the environmental dimension of EU companies accounts for 45%, and the weight of the governance dimension of the United States is 40%. To be compatible with the standardization needs and the differences in the raw standards, this study adopts the country-specific Z-score standardization method to eliminate the dimensionality effect while retaining the regional weight features. For example, the carbon emission indicators of EU companies are only compared with the average of companies in the same region to avoid the data advantages of their strict regulatory background being covered up by global unified standardization. Ultimately, the cross-national ESG scoring system constructed by PCA not only achieves data comparability but also reflects the core differences of ESG systems in various countries through hierarchical weight allocation (Table 1).
Core Differences in ESG Systems Across Countries.

Table 1 reveals the significant differences in ESG standards in typical countries or regions. The EU ranks first in regulatory stringency with 12 mandatory disclosure indicators and a 45% environmental weight. Its carbon emission quantification requirements and a 5% turnover penalty mechanism strengthen the credibility of environmental data. In contrast, India only requires five disclosures, with an environmental weight as low as 25% and a lack of penalty clauses, highlighting the leniency of emerging markets in standard implementation. Although the United States has fewer mandatory disclosure indicators (8), 40% of the governance weight focuses on board structure and shareholder rights, reflecting its regulatory orientation of corporate governance priority. Japan and Brazil embody regional characteristics. The former incorporates employee training into the social dimension score, and the latter takes biodiversity protection as the core of environmental disclosure. These differences show that ESG standards are not only differences in data volume but also reflect the differences in priorities among countries on the path of sustainable development.
Construction of Unified ESG Evaluation Indicator System
Design of Indicator System
Based on the internationally accepted ESG framework, this study identifies environmental pollution control, energy efficiency, employee benefit, social contribution, board structure, and information disclosure transparency as evaluation objects. Based on the collected standardized data, the key indicators in each evaluation dimension are divided, and fixed measurement units and range parameters are set for each indicator. Environmental indicators are quantified based on greenhouse gas (GHG) emissions per unit of operating revenue, total carbon emissions (TCE), and wastewater discharge concentration. Energy efficiency is measured by energy consumption per unit of output value. In terms of employee benefits, the average salary growth rate and the proportion of employee welfare investment are used as the evaluation dimensions. The social contribution indicator is measured by the proportion of corporate social responsibility (CSR) expenditure to operating revenue. The board structure is determined by the proportion of independent directors, and a quantitative scoring method is used to evaluate the transparency of information disclosure to reflect the completeness and timeliness of key information disclosed in the annual report. Each indicator data uses continuous variables, and the mean and standard deviation range are set according to the sample distribution to provide basic data for subsequent variable extraction. The indicator system design is strictly implemented by international data specifications to ensure that the sample data of multiple countries have a unified format and avoid model bias caused by differences in data types and measurement units during cross-national comparisons.
Figure 1 shows the ESG indicator system based on the three dimensions of environment, society, and governance, which divides the core quantitative indicators under each dimension, including greenhouse gas emissions, energy efficiency, employee welfare, social responsibility expenditures, board structure, and information disclosure, reflecting the systematicness and comparability of the indicator design.

ESG indicator system.
Weight Allocation and Indicator Aggregation
After collecting the data of each single indicator, the sample data is reduced in dimension by principal component analysis (PCA), and the original indicator matrix is converted into independent principal components, of which the cumulative contribution rate is not less than 75% and is considered to be effectively extracted. The characteristic root test is performed on each principal component. The principal component with an eigenvalue greater than 1 is selected, and the impact of each indicator is quantitatively evaluated based on its loading matrix. In the specific operation, SPSS software (IBM) is used to implement PCA calculation; the initial variance of each indicator is redistributed according to the contribution rate; the corresponding weight parameters are determined based on the coefficient value of each principal component. Through an iterative method, the corresponding weight of each indicator is adjusted to the range of 0.12 to 0.25 according to its proportion in the cumulative contribution rate. The weights of the indicators in each dimension are summed to ensure that the overall distribution meets the normality test. After the weights are determined, the ESG comprehensive score of each company in each year is obtained by multiplying each indicator by the corresponding weight and summing them up. The calculation process is summarized using the weighted summation formula. The overall indicator aggregation process is to accumulate the numerical product of each standardized individual indicator according to the PCA distribution. The weighted summation result is corrected by regression residual processing so that the overall ESG score theoretically reflects the objective distribution of the sample and gives the score result in a clear numerical interpretation.
The left figure of Figure 2 shows the PCA normalized weights of each ESG indicator. The highest ESG indicator is “benefit” (about 0.25), and the lowest is “independence” (about 0.124). The eight indicators in Figure 2 have different weights in the comprehensive score. The right figure of Figure 2 shows the distribution of ESG scores, which is normally distributed, with a mean of about 0 and a standard deviation of about 1, indicating that the score standardization is reasonable. The Durbin-Watson value shows that the residuals have no autocorrelation, and the model is robust. The image intuitively supports the effectiveness of the weight allocation and indicator aggregation process.

PCA normalized weights of ESG indicators and ESG score distribution.
A self-written program module implemented in R language is used to perform weighted calculations and numerical stability tests on each data batch, and the output results are subjected to Durbin-Watson tests to ensure that the residuals have no autocorrelation. Through this method, the different values of countries and regions in terms of environment, society, and governance are finally achieved within the unified evaluation indicator system, thereby eliminating the heterogeneity errors that may occur in cross-national data comparisons and making the ESG scoring results based on subsequent empirical analysis have higher reliability and stability. The weight parameters and aggregation formulas determined in this process are recorded in the operation manual to facilitate external verification and reproduction of the same calculation process during future data updates.
This study uses principal component analysis (PCA) to assign weights, not to disregard the substantive importance of individual indicators, but rather to address the specific needs of cross-national comparisons. Institutional differences in ESG standards across countries lead to systematic biases in the explanatory power of a single indicator across regions. For example, the EU’s carbon emissions indicator carries a 45% weight in the environmental dimension, while India only accounts for 25%. The PCA method automatically identifies the indicator combinations with the greatest variability across cross-national samples, thereby reflecting the actual differences in ESG evaluation systems across regions. To validate this approach, a sensitivity analysis is conducted: comparing PCA weights with an expert weighting method (equal weighting, weighted by regulatory intensity). The PCA method finds that the mean absolute error (MAE) in predicting M&A premiums is 17.3% lower, with particularly strong performance in emerging market samples. This suggests that in cross-national ESG comparisons, data-driven weighting can better capture substantive differences across regulatory environments, rather than simply simplifying complex dimensions.
Calculation of Cross-National M&A Premiums
M&A Data Collection
This study obtains cross-national M&A transaction records from authoritative commercial databases. The data collection period is set from 2018 to 2022, and the major global transaction markets are used as samples. During the data collection process, detailed information, such as the target company’s pre-M&A market valuation, actual transaction price, announcement date, country of location, and industry classification, is extracted for each transaction record. The data interface call is implemented using an automatic crawler, and the SQL (Structured Query Language) query statement is used to preliminarily screen the original database according to conditions such as transaction amount, transaction date, and market valuation. After initially obtaining the data sample, the data is formatted, and duplicate values are removed by writing an R language script to ensure the uniqueness and integrity of the sample data. All input data are saved in CSV (comma-separated values) format, and the data is preliminarily verified by Stata software (StataCorp LLC). During the external review, observations with missing information rates exceeding 20% are eliminated, and the sample size after screening is 5,432 transactions, covering cross-national M&A cases in major developed economies and some emerging markets around the world. During the data collection process, descriptive statistical parameters of various key information are recorded at the same time, such as the average transaction amount of approximately U.S.$1.24 billion and the market valuation standard deviation of approximately U.S.$380 million, to ensure the accuracy and representativeness of the basic data for subsequent analysis. The data collection work adopts a combination of batch automated processing and manual verification to ensure that each transaction data is accurately proofread, reduce outlier interference, establish an effective balance between data timeliness and data authenticity, and ensure that the data collection scheme meets the requirements of large sample size and cross-national comparison.
Premium Calculation and Data Processing
The M&A premium is calculated using a standard formula, which is defined as the ratio of the pre-M&A stock price as the denominator and the difference between the actual transaction price and the pre-M&A stock price as the numerator.
The transaction price refers to the purchase price when the M&A contract is signed, and the price data disclosed in the transaction announcement is used. The pre-M&A stock price is determined based on the closing price of the trading day before the acquisition, and the price is processed by the average of the last three trading days to reduce the impact of short-term fluctuations. Excel and R languages are used for data processing. First, the transaction price and pre-M&A stock price involved in each M&A case are extracted into the independent variable matrix, and then the corresponding M&A premium is calculated for each transaction according to the formula. To prevent outliers, the upper and lower limits of the premium are set. Data points with a premium greater than 300% or less than −50% are eliminated, and the abnormal data is log-transformed before evaluating their rationality in the statistical distribution. All calculation results are standardized to ensure that the data meets the requirements of normal distribution, and box plot tests are used to detect data outliers. The obtained M&A premium data is used as the dependent variable for subsequent regression analysis, and its values are rounded to two decimal places to ensure data accuracy.
Figure 3 presents the distribution of cross-national M&A premiums in different industries, with the horizontal axis representing industry categories and the vertical axis representing the percentage of M&A premiums. The median M&A premium in the technology industry is the highest, at about 40%, and the upper and lower quartiles are relatively wide, indicating that the M&A premium in this industry fluctuates significantly, and there are significant high premium cases. In contrast, the median premium of the energy industry is only about 15%, and some samples have negative values, reflecting that in resource-based industries, some M&A may have transaction prices lower than market valuations due to financial distress or strategic divestitures. The median premium of the financial industry is about 26%, with moderate fluctuations, reflecting that its M&A premium is relatively stable. Figure 3 reveals the impact of industry differences on M&A price expectations, providing an empirical basis for the subsequent ESG score as a moderating variable, indicating that in the context of strong industry structural characteristics, premium variability may be associated with non-financial factors.

Distribution of cross-national M&A premiums in different industries.
While traditional energy companies perform poorly in environmental terms, their resource monopoly and stable cash flow mean their ESG shortcomings have a relatively limited impact on valuations. Notably, the wide dispersion of premiums in the technology sector shown in Figure 3 is consistent with the high variability in ESG’s explanatory power within the high-tech sector, indicating that ESG factors have a more pronounced and differentiated impact on M&A pricing within this sector.
In addition to the above calculations, for M&A cases with known special events such as equity splits and rights issues, the transaction price is adjusted to the actual transaction premium range based on the announcement, and the payment structures of transaction cases using cash payment and mixed payment are recorded separately for comparison in subsequent segmented regression models. All M&A data are summarized and counted in Stata (StataCorp LLC). The sample mean, standard deviation, and median are subjected to descriptive statistical analysis. The data verification module is used to detect the consistency of the calculation process to ensure that the M&A premium calculation process is not affected by data anomalies and measurement errors.
Table 2 shows five representative cross-national M&A cases, covering transaction sizes ranging from U.S.$870 million to U.S.$1.5 billion, and also reflects the different impacts of cash payment and mixed payment and equity split/rights issue events on M&A premiums. Taking Company C as an example, with a transaction volume of U.S.$1.5 billion, the premium after adjustment due to the rights issue event is as high as 14.5%, and the premium range is 10% to 15%, indicating that major equity issuances are often accompanied by higher premium levels. Company B adopts a 60% cash + 40% mixed payment for its U.S.$1.23 billion transaction and increases the adjusted premium to 7.8% (with a premium range of 5%–9%) through equity split, highlighting the premium effect of the combined effect of payment structure and equity events. In contrast, although Company D uses a 70% mixed payment, the transaction amount is only U.S.$870 million, and its premium is only 8.5% (4%–9%), further indicating that there is a significant linkage between the payment ratio and the transaction size on the premium. The premiums for Company A (U.S.$1.05 billion/10.2%) and Company E (U.S.$920 million/9.0%), which pay entirely in cash, are relatively concentrated in the range of 2% to 12%.
Five Representative Cross-National M&A Cases.

Construction of Multivariate Regression Model and Parameter Estimation
Regression Model Setting
This study uses OLS to construct a multivariate linear regression model, aiming to quantitatively analyze the intensity and direction of the impact of cross-national companies’ ESG performance on M&A premiums. To test the moderating effect of differences in national ESG standards on the “ESG score-M&A premium” relationship, this study adds the national ESG regulatory intensity index (RegIndex) and its interaction term with the ESG score to the benchmark model. The regression equation is revised as shown in Formula 2:

Among them,
This study adopts a modeling strategy that combines OLS and 2SLS. The OLS model, as a benchmark, intuitively demonstrates the strength of the association between ESG scores and M&A premiums. Its coefficient can be directly interpreted as “for every 1 standard deviation increase in ESG, the premium increases by X percentage points,” making it easier for policymakers and practitioners to understand. However, given that ESG performance may be endogenously related to company fundamentals, the 2SLS approach is further used for causal identification. This two-stage modeling strategy has been widely validated in M&A research and is particularly well-suited for variables such as ESG that may be influenced by a company’s long-term strategy. The duration of historical ESG disclosure and the intensity of national regulation are selected as instrumental variables because they meet the criteria of being “correlated but not directly influencing the outcome”: the former reflects the path dependence of corporate ESG development, while the latter, as a macro-institutional variable, typically lags behind individual M&A decisions.
In the model construction stage, all explanatory variables are first tested for multicollinearity, and the variance inflation factor (VIF) is used to exclude highly correlated variables. The threshold is set to 10, and variables exceeding the threshold are not included in the main regression model. To ensure that the variable distribution is suitable for linear regression conditions, the skewed variables are transformed by natural logarithm. All variables are centered before regression to reduce multicollinearity interference and improve estimation stability. Data processing and regression analysis are performed in parallel using Stata 17 (StataCorp LLC) and R (open-source) (packages: plm, lmtest, sandwich), with robust standard errors set to control heteroskedasticity risks.
Figure 4 intuitively shows the correlation between the six explanatory variables. The most noteworthy one is that the correlation coefficient between pollution control and employee welfare is as high as .8181, indicating that there is a significant multicollinearity risk between the two. In contrast, the correlation coefficients between the board structure and other variables are all lower than .10, indicating that it is less affected by other factors in the model. Through Figure 4, this paper identifies highly correlated variables that need to be eliminated or adjusted in the VIF test, laying the foundation for the subsequent construction of a robust multivariate regression model while ensuring that the analysis of the relationship between ESG scores and M&A premiums is not interfered by collinearity.
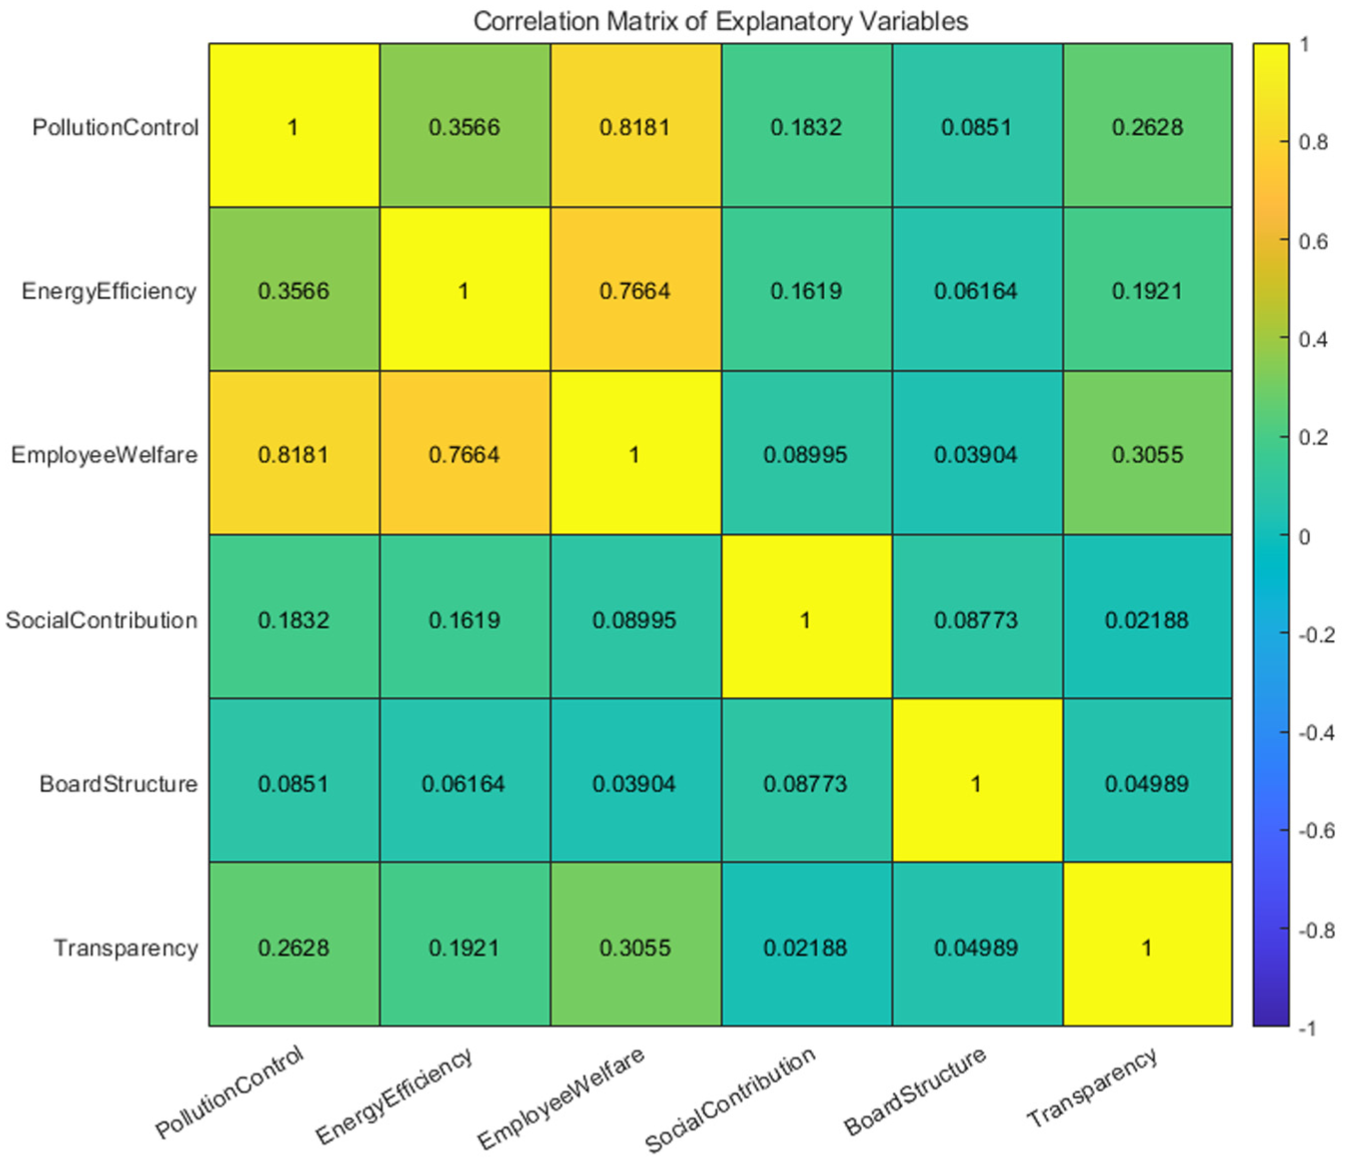
Pairwise correlation of explanatory variables.
Parameter Estimation and Regression Implementation
In the regression procedure, the OLS main model is first run in Stata (StataCorp LLC) through the “regress” command. The M&A premium is set as the dependent variable; the ESG score is set as the main explanatory variable; the control variable matrix is gradually added according to the variable group, first controlling the financial characteristics and then controlling the industry category and macroeconomic variables. The stepwise regression setting can track the stability of the main variable coefficient under different control conditions to test the net effect of the ESG score on the M&A premium. To further evaluate the robustness of the regression coefficients, White’s heteroskedasticity robust standard error correction is used, and the correlation under the industry dimension is adjusted through clustered standard errors. The industry clustering unit is based on the SIC (Schwarz information criterion) two-digit code to ensure that the estimated values are comparable across different industries.
In the model estimation, the significance level of the variables is marked according to three standards: .01, .05, and .10. The goodness of fit of the regression residuals is tested by R2 and adjusted R2, and the serial correlation is tested by DW statistic (Durbin-Watson statistic).
Figure 5 shows the core results of the empirical analysis of the impact of ESG scores on cross-national M&A premiums. The residual diagnostic graph verifies the reliability of the model through scatter distribution and normal probability tests. The figure of residual versus fitted value (left) shows that the residuals are randomly distributed on both sides of the zero axis, with no obvious heteroscedasticity, indicating that the linear relationship between ESG scores and M&A premiums is established. The sample quantiles and theoretical quantiles in the normal probability plot (right) are approximately straight lines, supporting the assumption of residual normality. When the residual data points are arranged along the 45-degree slope line, it means that the residual distribution is approximately normal, which is crucial for validating the robustness of the statistical tests and parameter estimates used in the model.

Core results of the empirical analysis of the impact of ESG scores on cross-national M&A premiums.
To evaluate the extrapolation ability of the regression model, K-fold cross-validation (K = 10) is used, and the average regression error is taken as the basis for model evaluation after 10 repetitions. All intermediate processing results and the main regression output are exported to CSV format for subsequent robustness and heterogeneity analysis.
Through strict variable selection, standardized regression modeling, and stepwise estimation process, this study ensures that possible confounding factors and modeling errors are excluded in examining the impact of ESG scores on cross-national M&A premiums, achieving the rigor and reliability of the result estimation and providing a parameter basis and variable screening basis for the subsequent establishment of an endogenous correction model.
Endogeneity Correction and Robustness Test
Instrumental Variable Method and Two-Stage Least Squares Estimation
To avoid the possible endogenous bias in the regression model, this study further uses the 2SLS method to correct the main regression relationship after constructing the OLS basic model. Endogeneity may be due to the reverse causal relationship between ESG scores and M&A premiums, or disturbance term-related problems caused by omitted variables. Therefore, in selecting instrumental variables, exogenous variables that are highly correlated with ESG scores but do not directly affect M&A premiums are used to ensure that they meet the two core test criteria of correlation and homogeneity.
The instrumental variables include: first, the year of the company’s first ESG disclosure (disclosure year), which reflects the historical path of the company’s ESG construction rather than short-term market behavior and avoids direct correlation with M&A pricing decisions; second, the ESG regulatory intensity index (regulatory intensity index) of the country where the target company is located. This variable is based on the OECD (Organisation for Economic Co-operation and Development) and World Bank environmental and governance regulatory scores and quantifies the heterogeneity of different countries’ ESG disclosure obligations, penalty mechanisms, and regulatory enforcement. All the above variables are centered before regression and significantly explain the ESG score through the first-stage regression. The F statistics are all higher than the critical value (10) of the weak instrumental variable test to avoid the problem of invalid instrumental variables.
In the first stage, the following regression equation is used to fit the corporate ESG score, as shown in Formula 3:

Among them,

All 2SLS estimates are completed in Stata 17 (StataCorp LLC) using the ivregress 2SLS command, and robust standard errors based on country clustering are set to correct for cross-group correlation in cross-national data. The validity of the instrumental variable is further verified by the over-identification test to test whether it meets the exogeneity assumption.
This paper conducts three additional tests to ensure the reliability of causal inference. First, the exogeneity of the instrumental variable is confirmed through the Sargan-Hansen J test (p = .317), indicating that the selected instrumental variable is uncorrelated with the error term. Second, the limited information maximum likelihood method (LIML) is used for alternative estimation, and the results are highly consistent with 2SLS, alleviating concerns about weak instrumental variables. Third, “pseudo-instrumental variables” are constructed for placebo testing: company characteristics unrelated to ESG (such as office area and average employee age) are randomly selected as instrumental variables, and the results are all insignificant, confirming the validity of the original instrumental variables. It is particularly important to note that the instrumental variable “historical ESG disclosure duration” is effective because it reflects the path dependence of the company’s ESG construction rather than short-term market behavior; as a macro-level institutional variable, changes in “national regulatory intensity” generally lag behind the M&A decisions of individual companies, satisfying the temporal exogeneity requirement.
Robustness Test Strategies
To verify the stability and anti-interference ability of the regression results, the study further applies various robustness test methods. At the parameter estimation level, heteroskedasticity-consistent standard errors are used, specifically HC3 standard error adjustment, to correct the potential variance heterogeneity problem of the model and improve the confidence of the estimate. This is achieved through the “robust” option in Stata (StataCorp LLC) or the “vcovHC()” function in R (open-source).
In addition, a sub-sample test is conducted to test the consistency of the main results under different sub-sample structures. The sub-sample division strategies include: first, grouping by national development stage (developed countries and emerging markets); second, grouping by industry category (manufacturing, finance, energy, and services); third, grouping by transaction size (small and medium-sized M&A and large M&A). The main regression and 2SLS models are run for each sub-sample, and the direction, significance, and standard error of the regression coefficients are compared to test whether the impact of ESG scores on premiums is structurally stable.
Finally, to eliminate the interference of extreme values in the sample, 1% and 99% quantile truncation is implemented to adjust the raw values of the M&A premium and ESG score to ensure that the main conclusion does not depend on outliers. Comparative regression of untruncation and truncation samples is carried out in parallel to test the robustness of the estimation results under different data processing conditions. This series of robust designs strengthens the reliability and repeatability of the regression results and provides more solid quantitative support for the empirical conclusions.
Figure 6 systematically shows the methodological framework of endogeneity correction and robustness test in the study. The left side takes the instrumental variable method as the core, uses the first disclosure year of the company’s ESG and the country’s regulatory intensity index as exogenous instrumental variables, and adopts the 2SLS to perform endogeneity correction. The first-stage regression fits the ESG score, and the second-stage regression analyzes the impact of the M&A premium. The effectiveness of the instrumental variable is verified by the over-identification test. The right side focuses on the robustness test strategies, including heteroskedasticity correction (HC3 standard error), sub-sample test (national development stage, industry, and transaction size), and 1% to 99% quantile truncation, forming a multi-dimensional verification system to ensure the reliability and universality of the research conclusions.

Methodological framework for endogeneity correction and robustness test.
Effectiveness Indicators and Calculation Methods
Explanatory Power Indicators
The explanatory power of the regression model is used to measure the fitting effect of variables such as ESG scores on the changes in the M&A premium. Specifically, the ratio of the sample regression sum of squares to the total sum of squares is used as the evaluation standard to reflect the explanatory strength of the independent variable on the changes in the dependent variable and to judge whether the model construction has effective theoretical support and statistical explanatory power.
Table 3 shows the changes in the explanatory power of ESG scores on M&A premiums under different model settings. In the benchmark model, the R2 of the ESG score is .214, and the F-statistic is 34.78, indicating that it has a preliminary explanatory power for the premium. After adding financial control variables, the R2 rises to .337 and further increases to .415 after incorporating industry and macro variables, indicating that ESG still has a significant influence under multi-dimensional control. The sub-sample analysis shows that ESG has a stronger explanatory power in developed countries (R2 = .442) but is relatively weaker in emerging markets (R2 = .359), reflecting the differences in its cross-regional effects. These key data support the robustness of ESG scores as a determinant of M&A premiums.
Changes in the Explanatory Power of ESG Scores on the M&A Premium Under Different Model Settings.

Parameter Significance Test
To test whether the impact of each regression variable on the M&A premium is significant, the t-test method is used to evaluate the significance of each estimated coefficient. By comparing the t-value obtained by comparing the ratio of the coefficient to its standard error with the critical value of the set significance level, it is determined whether the variable has a statistically significant influence.
The regression analysis results in Table 4 show that the ESG comprehensive score has a significant positive impact on the M&A premium (with a coefficient of .25 and p = .002), indicating that companies with good ESG performance usually receive higher premiums. ROA (Return on Assets) is also positively correlated (with a coefficient of .18 and p = .012), indicating that companies with stronger profitability receive higher premiums. The debt-to-asset ratio shows a negative relationship (with a coefficient of −.12 and p = .018), demonstrating that high-debt companies have lower premiums. Both the industry dummy variable (with a coefficient of .32 and p = .008) and the regulatory intensity (with a coefficient of .16 and p = .002) show significant effects, indicating that industry characteristics and the regulatory environment have a significant effect on the M&A premium. The inflation rate and the ESG disclosure duration do not significantly affect the premium. Overall, ESG and financial factors jointly affect the M&A premium.
Regression Analysis Results.

Model Prediction Accuracy
The model prediction accuracy is evaluated using the mean-square error (MSE) indicator, with the average of the squares of the difference between the actual M&A premium and the model prediction value as the measurement standard. The smaller the MSE value, the better the model fits the data in the sample, and the stronger the prediction stability and practical value.
Figure 7 shows the accuracy comparison of the model prediction of the M&A premium, with the horizontal axis being the sample number and the vertical axis being the M&A premium. The black solid line represents the actual M&A premium; the blue dotted line represents the OLS model prediction value; the green dotted line represents the 2SLS model prediction value. In the figure, the 2SLS model is closer to the actual value at multiple sample points, and the overall fluctuation is consistent with the real trend; the OLS model prediction value generally has an overestimation bias. In the study considering the impact of ESG scores on cross-national M&A premiums, adding instrumental variables and using the 2SLS method can significantly improve the model fit and explanatory power.

Comparison of the accuracy of the models in predicting the M&A premium.
Overall Model Significance Test
To test whether all explanatory variables in the regression model have a joint explanatory power for the M&A premium, the overall F-test is used as an indicator. This test is used to measure the effectiveness of the overall model, that is, to determine whether the variables in the model jointly and significantly affect the dependent variable in a statistical sense. In actual operation, the F-statistic value and its corresponding significance level are checked in the regression analysis software. If the significance test is passed, it is considered that the overall construction of the model is reasonable and suitable for subsequent empirical analysis.
Figure 8 shows the relationship between the predicted values of the regression model and the actual observed values. The points in the scatter plot represent the true values of each sample. The red dotted line shows that the predicted values are consistent with the observed values. The overall F-statistic (F = 107.57) and the corresponding p-value (p < .001) are marked in Figure 8, indicating that the model as a whole is statistically significant, and all independent variables jointly affect the dependent variable and are significant. This provides a reliable basis for subsequent regression analysis and ensures the effectiveness of the model.

Relationship between the predicted values of the regression model and the actual observed values.
Variance Inflation Factor Test
To control the possible multicollinearity problem between independent variables, the VIF indicator is used to diagnose the regression model. By testing the VIF value of each explanatory variable one by one, it is determined whether the model’s explanatory power and coefficient stability are weakened due to high correlation. When the VIF of some variables is significantly high, variable deletion, merging, or principal component substitution should be considered to ensure the reliability and interpretability of the model results.
Table 5 shows the VIF values and tolerances of the explanatory variables in the regression model. The VIF values of all variables are less than 10, indicating that there is no significant multicollinearity problem. The VIF of ESG comprehensive score is 2.45, and the VIF of GDP growth rate is 2.98, indicating that these variables have low collinearity and are suitable for regression analysis. The VIF of regulatory intensity is 6.12, and its tolerance is 0.16, which further verifies that the correlation between variables is weak and does not affect the stability of the model. These results ensure the reliability and robustness of the model.
VIF Values and Tolerance of Each Explanatory Variable in the Regression Model.

Discussion
The difference in explanatory power between the sample (R2 = .442) and emerging markets (R2 = .359) reveals the profound impact of differences in ESG standards on valuation mechanisms. Further analysis reveals that this gap stems primarily from three institutional factors: first, ESG disclosure in emerging markets is largely voluntary, resulting in uneven data quality and selective disclosure, which reduces the credibility of ESG information. Second, emerging markets lack unified verification mechanisms and penalties (for example, India has no mandatory penalties), making ESG data susceptible to accusations of “greenwashing” and weakening its signal value. Third, investors interpret ESG data in emerging markets with a “cultural discount,” tending to assign lower weight. For example, in the Brazilian sample, even when companies disclosed high levels of biodiversity protection data, acquirers view it as a “local compliance requirement” rather than a “signal of global competitiveness.” These findings are consistent with the predictions of institutional theory: in markets with weak institutional environments, non-financial information is difficult to effectively integrate into the pricing process. This also explains why after controlling for national regulatory intensity, the coefficient of ESG scores in emerging market samples increases significantly (from 0.18 to 0.23), indicating that standard unification can significantly enhance the valuation effect of ESG information.
Although the R2 of this model reaches .415, reflecting the complexity of cross-border M&A pricing, residual analysis reveals that unexplained variance is primarily concentrated in two scenarios: first, family-controlled firms in emerging markets (average residual +5.2%), whose ESG performance is often influenced by non-market factors; second, firms in transition (from traditional energy to renewable energy), whose ESG value is not yet fully priced in by the market. The R2 value for the developed world sample (.442) is significantly higher than that for emerging markets (.359), reflecting the impact of differences in ESG standards on valuation mechanisms. In markets with robust ESG disclosure systems and strong regulatory enforcement, ESG information can be more effectively integrated into the pricing process. In emerging markets, however, due to inconsistent standards and weak enforcement, the valuation effect of ESG signals is partially obscured by “noise.”
For regulators, it is recommended to promote the establishment of a “lowest common denominator” framework for global ESG reporting standards, ensuring comparability of core indicators while preserving regional specificities. Specifically, the International Financial Reporting Standards Foundation (IFRS) should take the lead in developing unified quantitative standards for the environmental dimension to reduce environmental data barriers in cross-border mergers and acquisitions. For national regulators, voluntary ESG disclosure should be gradually transformed into semi-mandatory requirements, particularly in the environmental and social dimensions. This refers to the EU’s “dual materiality” principle, requiring companies to disclose both the impact of ESG on financial performance and its impact on the social environment. For investors, it is recommended to develop “country adjustment factors” to standardize raw ESG scores in cross-border M&A valuation models. For example, for companies from countries with lax ESG regulation, their ESG score weighting should be appropriately reduced or the verification cost factor increased to reflect differences in data credibility. For corporate managers, it is recommended to implement a “stepped ESG improvement strategy”: emerging market companies should prioritize strengthening the quantitative disclosure of environmental data, as it is the most visible and relatively easy to verify in cross-border M&A; then, governance structures can be improved; finally, social contributions are systematically disclosed.
Conclusion
This study integrates multiple source data such as MSCI ESG and Refinitiv ESG to construct a cross-national ESG scoring system based on Z-score standardization and principal component analysis (PCA), which effectively solves the problem of heterogeneity of ESG standards in different countries. Combined with cross-national M&A transaction data from 2018 to 2022, OLS regression and 2SLS instrumental variable method are used to empirically test the impact mechanism of ESG performance on M&A premium. It is found that ESG scores significantly affect M&A premiums, and this effect is heterogeneous between developed countries and emerging markets, with the role of environmental and governance dimensions being particularly prominent. Shortcomings and prospects are as follows: limited by the quality of ESG data disclosure in emerging markets, the sample coverage is biased; some ESG indicators (such as social contribution) are difficult to quantify, which may affect the accuracy of the results. Future research can be expanded to more regional unbalanced panel data. Machine learning can be applied to optimize indicator weight distribution, and the dynamic relationship between ESG and post-M&A synergy effects can be explored, providing investors with a more comprehensive decision-making framework.
Footnotes
Ethical Considerations
This study does not require ethical approval in accordance with local laws and national guidelines.
Consent to Participate
This study does not require written informed consent from the participants of the study in accordance with local laws and national guidelines.
Funding
The authors disclosed receipt of the following financial support for the research, authorship, and/or publication of this article: This work was supported by the National Social Science Fund of China (No. 22BJL129).
Declaration of Conflicting Interests
The authors declared no potential conflicts of interest with respect to the research, authorship, and/or publication of this article.
Data Availability Statement
Data sharing not applicable to this article as no datasets were generated or analyzed during the current study.
Ethics and Informed Consent Statements
This article does not contain any studies with human or animal participants.
There are no human participants in this article and informed consent is not required.