
Abstract
The traditional traffic concept seems to be unable to adapt to the traffic problems brought by cities’ rapid development. People must cultivate new modern traffic literacy to deal with traffic problems. Based on traffic literacy, this paper constructs a traffic literacy evaluation indicator system including 13 evaluation indicators such as traffic rules and mechanical knowledge by summarizing relevant literature. We propose an Improved Principal Component Analysis (I-PCA) method, introduce the concept of information contribution sensitivity, and optimize and empower the traffic literacy indicator system. The primary research is to construct a traffic literacy evaluation indicator system including 13 evaluation indicators such as traffic rules and mechanical knowledge. The top 10 indicators that satisfy the cumulative information contribution rate value greater than 90% are retained, and the three indicators with low contribution rate are excluded. The optimization method can retain the indicator with a relatively large information contribution rate so that the indicator’s weight can genuinely reflect the information content of the corresponding indicator. The optimization method can retain the indicator with a relatively large information contribution rate so that the indicator’s weight can genuinely reflect the information content of the corresponding indicator.
Introduction
With the rapid development of the economy and the continuous improvement of people’s living standards, the urban traffic demand has caused changes in the overall traffic layout: roads become wider, traffic networks are denser, and vehicle traffic surges. This has led to more and more severe road congestion, frequent traffic accidents, and numerous violations of road traffic laws and regulations, which have seriously affected the development of cities and the quality of life of residents (Aijaz, 2019). The traditional concept of transportation in the past seems to be unable to adapt to this fast-developing era, and large-scale transportation facilities alone cannot fundamentally alleviate urban problems. People must improve their literacy to solve traffic problems in the new era. As the main transportation participants, motor vehicle drivers should improve their transportation literacy and jointly cope with transportation problems (S. Liu et al., 2022; Wang & Tian, 2021). From the perspective of drivers (drivers of all types of vehicles, including but not limited to two-wheeler drivers or four-wheeler drivers, or heavy vehicle drivers), this paper establishes and optimizes the evaluation indicator system of traffic literacy to lay the foundation for subsequent research.
Scholars have paid less attention to the research on traffic literacy, and most of the literature aims to explore the factors that affect traffic accidents (e.g., Lu et al., 2019; Nævestad et al., 2015; Yan et al., 2020), traffic safety (Han et al., 2010), and Transportation Health Literacy (Sargent-Cox et al., 2011). Some scholars believe that one of the factors to improve urban traffic safety is the development of urban safety infrastructure, such as the design of roundabouts (Macioszek, 2020), the design of traffic calming devices (Sołowczuk, 2021), and the intelligent city network (Keyvan-Ekbatani et al., 2012). The practice has proved that the critical factor for traffic safety, ensuring health, and avoiding traffic accidents still lies in the ability of traffic participants to reflect and process real-time traffic conditions (Mahmud et al., 2019). Therefore, to fundamentally solve the traffic problems caused by human factors, it is necessary to improve the literacy of drivers themselves, which we call traffic literacy.
Referring to the definition of traffic literacy in existing research (S. Liu et al., 2022), The formation of traffic literacy starts from the individual’s mastery of traffic knowledge and then turns traffic knowledge into a skill and uses it to guide actions, cultivate, and form a good traffic safety awareness. The level of traffic literacy is the embodiment of the driver’s quality, and under the combined influence of acquiring Knowledge, mastering skills, safety awareness, and driving safety behavior, it gradually reduces the probability of traffic safety accidents. From the perspective of drivers, this study reviews the research related to traffic literacy, such as traffic safety evaluation indicators (Guo et al., 2011; Y. Zhang et al., 2015), green traffic evaluation indicators (G. X. Liu, 2019; Long & Gao, 2017), systematically summarizes various factors that affect drivers’ traffic literacy and preliminarily proposes an evaluation indicator system for driver’s traffic literacy.
It should be noted that the rationality of the driver’s traffic literacy evaluation index system is crucial to the evaluation results. Therefore, we need to optimize the indicator. Indicator selection is a standard method for indicator optimization. The existing indicator selection methods mainly focus on the relative importance of indicators and information overlap. The selection methods of relative importance mainly include the coefficient of variation (Meng & Chi, 2018), optimal variance method (Ahmad et al., 2017; Rezaei et al., 2018), and Bayesian longitudinal model (Fouskakis et al., 2020), etc. However, Relative importance can only indicate that a specific indicator is more important to the evaluation results, and it is impossible to judge whether there is information overlap between the indicators (Chen, 2021). The selection methods of overlapping information indicators mainly include correlation analysis (Kazemi, 2020; Ma et al., 2017), cluster analysis methods (Chen & Chi, 2015), and Support Vector Regression (Xiong et al., 2022). The effectiveness of these methods has been verified in numerous studies, but they cannot achieve the empowerment of indicators. This study aims to eliminate information redundancy indicators and introduce information contribution rates based on the I-PCA method to optimize and empower driver traffic literacy evaluation indicators.
The rest of this paper is structured as follows: Section 2 is the theoretical part of constructing the traffic literacy evaluation indicator system, and the indicator optimization method is introduced in Section 3. In Section 4, the data sources and indicator selection results are analyzed. Sections 5 and 6 are discussion and conclusion, respectively.
Theoretical Foundations
Concepts of Driver Traffic Literacy
Drawing on previous research experience on scientific literacy and environmental literacy, we introduce the concept of literacy into the research on driver traffic safety and regard current traffic problems as “human behavior.” The driver’s traffic literacy is a kind of professional literacy, and it is also a category of ability. It is the traffic behavior or tendency that traffic participants gradually develop through their understanding, attitude, and control ability to drive activities during long-term driving activities. It reflects the comprehensive quality of the driver’s traffic safety awareness in dealing with complex road traffic conditions and the implementation of traffic safety behaviors when people interact with the external traffic environment.
There are usually two identities in the natural traffic environment: traffic participants and traffic managers (Z. Li et al., 2011). However, we all need to master basic Knowledge such as mechanical common sense, traffic rules, traffic laws, and regulations, no matter what kind of identity. As a driver, he/she must have skills such as vehicle driving and emergency measures. A qualified driver’s Knowledge, experience, and method skills are insufficient. When the driver drives on the road, he has already entered the traffic environment and is faced with interaction with other vehicles, passing pedestrians, and passengers. At this time, it is necessary to have the ability to correctly judge whether to drive illegally, whether to comply with traffic orders, and whether to cooperate with traffic management. Drivers also need to have the social and moral concepts of “safety first” and “being kind to others” and cultivate the awareness of “driving carefully” and “respecting others,” which will prompt drivers to actively obey traffic rules and be courteous to other vehicles or pedestrians.
Since there are few studies on transportation literacy, this study mainly explores the evaluation dimension based on previous scholars’ experiences, conclusions, and research results. It mainly draws on more mature evaluation dimensions such as scientific and environmental literacy to find the evaluation dimension that conforms to the driver’s traffic literacy. American scholar Miller first proposed a “three-dimensional model” to define scientific quality, including understanding important scientific terms and concepts, scientific methods and research processes, and cognition and understanding of the social impact of science and technology (Miller, 1983). The International Student Assessment Project implemented by the OECD defines scientific literacy as a core competency and constructs an evaluation system for scientific literacy from four aspects: ability, Knowledge, attitude, and context (Bybee et al., 2009). After decades of development and precipitation, the viewpoints on the structure of scientific literacy have not yet formed a unified model but generally include two significant parts: scientific Knowledge and scientific ability.
Hungerford and Peyton (1976) first proposed the environmental literacy assessment framework, including ecological Knowledge, understanding of problems, concepts, values, attitudes, attribution judgments, environmental sensitivity, and action strategies (Hungerford & Peyton, 1976). With the deepening of research, experts such as Hungerford H., Wilke R., and McKeown-Ice R. formed the Environmental Literacy Assessment Consortium. Based on the connotation, evaluation, and research conclusions of environmental literacy, they proposed four dimensions of the environmental literacy assessment framework (Simmons & Koenig, 1995; Wilke, 1995): (1) cognition (knowledge and skills); (2) emotion; (3) other factors that determine responsible environmental behavior; and (4) individual or collective participation in responsible environmental behavior (Tian, 2022). Another is the environmental literacy assessment framework proposed by Stapp and other scholars in the Tbilisi Declaration issued by UNESCO (1978): (1) knowledge; (2) emotion; (3) skills; and (4) behavior (Stapp, 1978).
Based on the evaluation system of scientific literacy and environmental literacy, this study defines the concept of traffic literacy as the sum of the Knowledge and experience that drivers have in traffic reserves, the mastery of reasonable methods and skills, the concept of people-oriented consciousness, and the implementation of self-control behaviors. By learning traffic knowledge, drivers can master traffic skills proficiently, establish good traffic awareness, and use it to guide their actions.
Construction of Driver Traffic Literacy Indicator System
According to the concept of traffic literacy defined above, we construct an indicator evaluation system from four dimensions: knowledge, awareness, skills, and behavior. Based on reviewing the existing research, the next-level indicators of each dimension are further explored. Finally, 13 evaluation indicators such as Traffic rules, Mechanical common sense, and Knowledge of laws and regulations are formed; see the third column of Table 1. The corresponding indicator observation points and references are shown in the fourth and fifth columns of Table 1.
Traffic Literacy Evaluation Indicators, Key Points, and References.

Source. Wang and Tian (2021).
Method
To realize the validity and scientificity of the measurement indicator, we propose an I-PCA method, which introduces the concept of information contribution rate to optimize the evaluation indicator. The sum of the difference between the retained principal component and an indicator and the cumulative contribution ratio of the corresponding principal component variance represents the indicator’s information contribution rate of the original indicator system. The indicator’s Information contribution rate reflects the indicator’s information contribution to the overall evaluation of traffic literacy and can be used as an essential basis for indicator optimization. This study draws on the method of Wang and Tian (2021), and the specific optimization steps are as follows.
1. Preliminarily process the data obtained based on the evaluation indicators, eliminate the measurement questionnaires that do not meet the measurement standards, and at the same time perform Z standardization processing on the preliminarily screened data:

where
2. Solve the correlation coefficient matrix R based on the standardized data:

where
3. Bring the matrix R into the equation:

where

Further calculate the variance contribution rate

The research shows that several principal components with a cumulative variance contribution rate of more than 60% can carry most of the information of the original indicator set (Wang, 2010). This study defined this threshold at 65%, but it can be adjusted according to the actual calculation situation to meet the research needs.
4. The difference function

the difference value can be calculated. The eigenvectors of the orthogonally normalized correlation coefficient matrix are

Where
5.

6. Denote the information contribution dege of the indicator

7. Arrange the obtained

PCA theory believes that when the cumulative information contribution rate is between 70% and 90%, the first n principal components can carry most of the information of the original indicators and should be retained (Jolliffe & Cadima, 2016). To ensure that the retained index can carry the maximum amount of information of the original indicator set, we retain the first L indicators that satisfy the value of
8. The weighting of indicators is calculated by the ratio of the cumulative information contribution rate of one indicator to the cumulative information contribution rate of all indicators, denoted by

The indicator weights calculated in the process of indicator screening in this study were not excluded. After the indicator screening is completed, the problem corresponding to the excluded indicator should be deleted, and the remaining indicator should be re-weighted, which is also calculated using equation (11).
Data Sources and Results
Data Sources and Analysis
We designed a questionnaire based on the evaluation indicator system of driver traffic literacy constructed in Table 1. Respondents’ responses to the questionnaire were categorized in the form of a five-level Likert scale. The response levels are “Completly understanding, more understanding, somewhat understanding, Not quite understand, completely do not understand,” and the corresponding values are 5, 4, 3, 2, and 1. The questionnaire is divided into demographic characteristics and a traffic literacy survey scale. Individuals’ essential characteristics include 7 questions, including gender, age, education, occupation, place of residence, average monthly income, and years of driving experience; the traffic literacy survey scale includes 17 questions. Four indicators covering a wide range of information, such as Traffic rules, Safety awareness, Vehicle control, and Self-management behavior, are set with two questions, and the other indicators are set with one question.
The survey data all came from offline surveys. Drivers of different ages were randomly selected from different administrative regions in Zhengzhou to fill in the questionnaires, and a total of 550 questionnaires were distributed. Invalid questionnaires such as incomplete questionnaires and more than 80% of the questions answered the same option were excluded, and the preliminary screening of the questionnaires was completed. Finally, 393 valid questionnaires were obtained, and the effective sample rate was 71.33%. Studies have demonstrated that when the sample size is approximately 300, the consistency of sample loadings relative to population loadings greater than .9 can be obtained, which is an accepted value in the behavioral sciences for establishing an equivalence between two sets of loadings (Lorenzo-Seva & Ten Berge, 2006; Saccenti & Timmerman, 2016). In addition, in the process of PCA, the sample size should be more than 10 times the number of variables. If the study wants to get ideal results, it is better to be more than 25 times the number of variables (W. Zhang & Dong, 2013). We can conclude that the sample size obtained in this study meets the basic needs of the analysis.
When conducting PCA, it is necessary to ensure that the reliability and validity of the questionnaire meet the basic requirements of the analysis. SPSS 24.0 was used to test the reliability and validity of the questionnaire data. The primary reference indicators were the internal consistency coefficient (Cronbach’s α), Kaiser-Meyer-Olkin (KMO) test statistic, and Bartlett’s sphericity test. The results of data analysis showed that Cronbach’s α coefficient was .821, and the Cronbach’s alpha coefficient based on standardized items was .815, indicating that the overall reliability of the questionnaire was good. The value of the KMO test statistic is .854, and the Bartlett sphericity test has a significant p = .000, and the cumulative variance contribution rate of the common factor is 63.311%, only one-factor loading under each item is more significant than .4, and the other factor loading values are less than .4. It shows that the validity of the questionnaire is high.
Empirical Analysis Results
Driver’s traffic literacy evaluation indicators are screened and optimized based on the I-PCA indicator optimization method. To obtain a more credible evaluation system, the indicators with relatively low cumulative contribution rates are deleted.
The four indicators of Traffic rules, Safety awareness, Vehicle control, and Self-management behavior correspond to two problems. Therefore, it is necessary to perform weighted average processing on the corresponding two sets of data to convert them into one set of data. According to equations (1) and (2), solve the matrix R of the Z normalized data, see Table 2.
Bring the correlation matrix coefficient result into equation (3) to get the eigenvalue
The eigenvector
Arrange the obtained
Coefficient Matrix for Normalized Data.

Source. Wang and Tian (2021).
Eigenvalues and Contribution Rates of Principal Components.
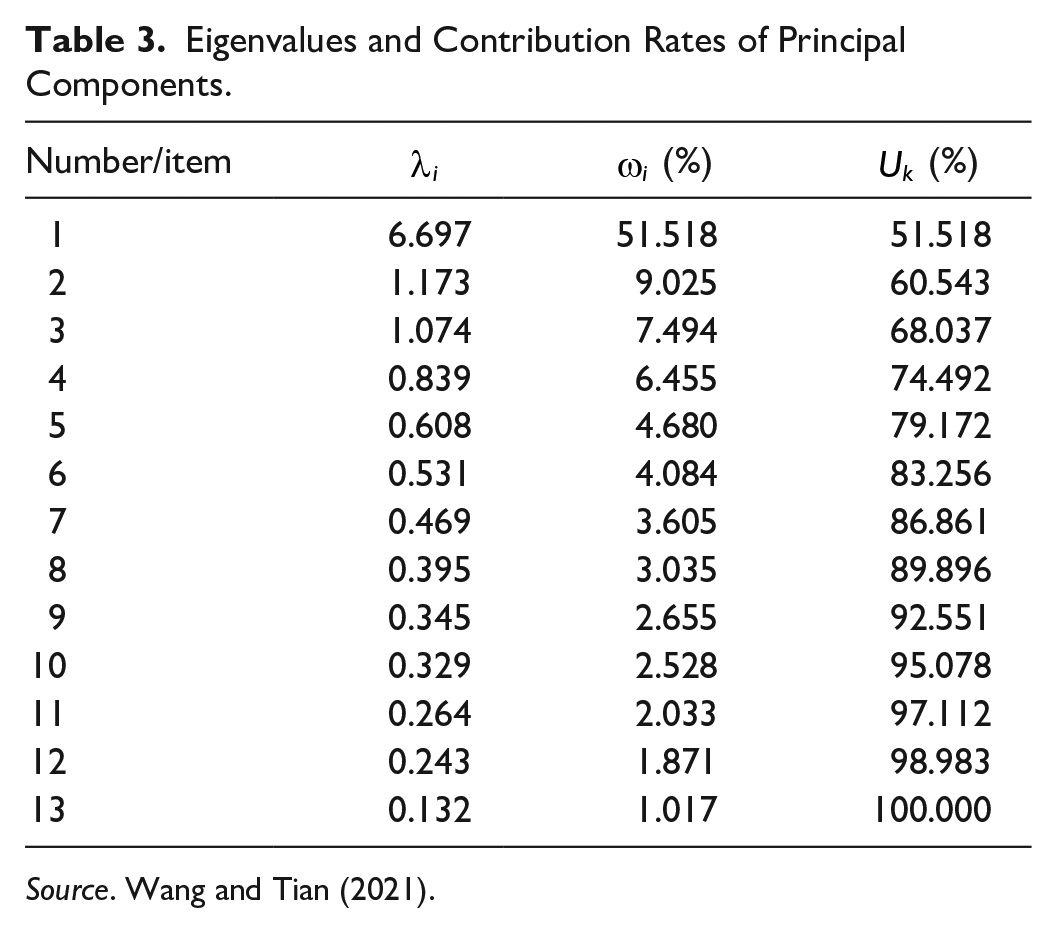
Source. Wang and Tian (2021).
Optimal Results of Indicators.

Source. Wang and Tian (2021).
Indicator Screening and Weighting Based on Cumulative Information Contribution Sensitivity.

Source. Wang and Tian (2021).
Note. The weights in the last column correspond to the indicators in the second column.
Discussion
This study draws on scientific, environmental, and other research foundations related to “literacy,” combined with the existing research related to traffic literacy. The traffic literacy indicator system we constructed from the four dimensions of Knowledge, skills, awareness, and behavior can reflect the overall quality of drivers, from basic Knowledge to behavior implementation in the driving process. The drivers are the most direct participant in traffic, and they not only need to consider the safety of passengers and the safety of other people and economic property around the driving environment (S. Liu et al., 2022). Improving the driver’s traffic literacy is conducive to improving the driver’s control over the entire driving environment, effectively controlling his driving behavior, taking emergency avoidance behaviors, etc. (Vaa, 2007; Zaidan et al., 2022). This will directly or indirectly reduce traffic accidents and reduce the maintenance cost of traffic facilities so that the functions of traffic facilities will play a more significant role. Drivers with higher traffic literacy will have higher safety awareness (S. Liu et al., 2022) and can effectively improve the culture of traffic safety behavior. Under cultural constraints, guidance and incentives, traffic order can be better improved, and the probability of traffic accidents is reduced (Sujon & Dai, 2021; Wishart et al., 2019).
In the era of informatization and intelligence, the dimensions of the indicator system for evaluation of different complex systems are becoming more and more complex, and information overlap between indicators will inevitably occur. Some scholars use dimensionality reduction methods to reduce information overlap (Chen et al., 2012; Uğuz, 2012), but there may be information loss, and the weight of indicators cannot be determined. The index optimization method based on relative importance is mainly based on the importance of the amount of information carried by the indicator relative to the evaluation results (Fouskakis et al., 2020; Kazemi, 2020), and the problem of information overlap cannot be avoided. This study proposes an I-PCA method, which calculates the indicators’ information contribution rate and judges the retention or deletion of indicators according to the set threshold. The research results show that the optimized index of this method can ensure the maximum information-carrying, avoid information overlap between indicators, and obtain the weight of each indicator. This method overcomes the disadvantage that the traditional PCA method cannot give weight and expands the method system of objective weighting.
It can be seen from the indicator selection results that we have deleted “Knowledge of laws and regulations,” “Kind to others,” and “Driving control behavior.”The information contribution rates of these three indicators are 4.32%, 3.1%, and 2.23%, respectively. The original indicator set has less information or overlaps with the information carried by other indicators. In actual traffic activities, the “traffic rules” include most of the “knowledge of traffic laws and regulations,” and the information between the two overlaps to a high degree, so the sensitivity of their information contribution is low. Similarly, the low sensitivity of the indicator of “Kind to others” to the information contribution of traffic literacy may be because the driver’s values are influenced by his social background and personal experience (Kaçan et al., 2019), which have formed the emotional intensity and behavioral standards for treating others. Driving control behavior occurs during the entire driving process, and its importance is self-evident. However, with the advancement of technology, vehicles are becoming increasingly automated (Hancock et al., 2020); it is easier for the driver to control the vehicle. In addition, the driving test standards in different countries and regions have been improved, and drivers who pass the test can master driving skills proficiently (Beanland et al., 2013; Williams, 2017). These are the reasons for the relatively low degree of impact of the indicator on traffic literacy.
It can be seen from Table 4 that the weights of Mechanical common sense, Safety awareness, and Values are .1079, .1066, and .1866, respectively. The mastery of “mechanical common sense” reflects the driver’s understanding of the vehicle, including the performance and operating instructions of the vehicle (Koo et al., 2015), which is a prerequisite to ensuring the driver’s safe driving. Safety awareness and values belong to traffic awareness. Research shows that traffic attitudes are critical to preventing traffic accidents (Martinussen et al., 2013; Yao et al., 2019). Safety awareness and values are part of a traffic attitude. When drivers have safety awareness and good values, they will take timely measures to avoid possible traffic accidents. Values exist at different levels of an individual and are a dynamically changing emotional state that can affect an individual’s real-life behavior (Schwartz, 1992; Skimina et al., 2018). When drivers are in the driving environment, their values interact with the stored Knowledge and mastered skills, influencing their driving behavior. As the most direct manifestation of traffic literacy, traffic behavior did not show a greater weight, which may be related to the behavior as an actor in the driver’s daily driving activities and has not attracted the driver’s attention.
Conclusions
Based on the existing research related to literacy, combined with traffic literacy, this paper constructs the evaluation indicator system of transportation literacy from four dimensions knowledge, skills, awareness, and behavior. The system contains a total of 13 indicators, including Traffic rules, Knowledge of laws and regulations, Mechanical common sense, Safety awareness, Values, Kind to others, Situation foresight, Vehicle control, Precautionary measures, Emergency measures, Self-management behavior, Driving control behavior, and Safe civilized behavior. This lays a theoretical foundation for the research on evaluating driver traffic literacy. The traffic management department can formulate a targeted driver traffic literacy improvement strategy for an indicator with a high information-sensitive contribution rate. It can quickly improve the driver’s traffic literacy level, activate the driver’s subjective initiative to effectively avoid traffic accidents, and promote the road traffic system to maintain a safe state.
The research aims to eliminate information redundancy indicators, and based on the I-PCA method, the concept of Information contribution rate is proposed, and the indicators are optimized and weighted. Firstly, a questionnaire is designed to obtain the original data based on the constructed traffic literacy indicator. Secondly, according to the calculation results, three indicators with low sensitivity to information contribution, such as Knowledge of laws and regulations, Kind to others, and Driving control behavior, are excluded, and nine indicators, such as Traffic rules that can reflect most information on traffic literacy are retained. Finally, all indicators are weighted according to the calculation results of the information contribution rate to reflect the importance of the indicators.
Footnotes
Acknowledgements
The author would like to thank the No. 6 Traffic Police Brigade of Zhengzhou Public Security Bureau for their support in obtaining data for this study. Thank you to the drivers surveyed for their responses to the questionnaire. Thanks to the authors’ colleagues who assisted in collecting the questionnaires during the paper’s writing process.
Declaration of Conflicting Interests
The author(s) declared no potential conflicts of interest with respect to the research, authorship, and/or publication of this article.
Funding
The author(s) received no financial support for the research, authorship, and/or publication of this article.