
Abstract
Social media can be valuable tools for art organizations, as the posts uploaded to their accounts can manifest their perspectives on organizational goals and activities. In particular, visual materials are playing a crucial role in organizational social media communication. They can manifest the social representations (SRs), which are systems of opinions, knowledge, and/or beliefs shared by a group of people. Based on the social representations theory, this study was conducted to identify the key elements and structures of visual SRs in art organizations’ Instagram photos via computational analyses. Specifically, the major content of the photos was determined through photo classification and content tagging, and words embedded in the photos were detected using an optical character recognition technique. Clustering analysis was used to compare content, embedded words, and pixel-level features between the resulting groups. Correspondence analyses were performed at the account level to establish the representational fields. The results showed that text and people were the major types of objects represented in art organizations’ Instagram photos. The texts presented in the photos were mainly about organization names, information about events, and calling for actions of the public. Moreover, representation of texts and people emerged as key factors structuring the fields of visual SRs at the account level. The results suggest that organizational facets were more emphasized than artistic facets in art organizations’ strategic use of visual social media. The implications of these findings were discussed, along with the limitations and suggestions for future research.
Plain Language Summary
Like any organizations, art organizations can use social media to achieve their organizational goals effectively. Particularly, visual social media can express the organizational activities that textual social media cannot. The expressions on social media by organizations in a domain can be understood from the perspective of social representations theory. This study aimed to identify what are the key elements represented in the Instagram photos of art organizations and how the representational field generated by art organizations are shaped. Computational analyses were performed for these aims. Specifically, the major content of the photos was determined through photo classification and content tagging, and words embedded in the photos were detected using an optical character recognition technique. Clustering analysis was used to compare content, embedded words, and pixel-level features between the resulting groups. Correspondence analyses were performed at the account level to establish the representational fields. The results showed that text and people were the major types of objects represented in art organizations™ Instagram photos. The texts presented in the photos were mainly about organization names, information about events, and calling for actions of the public. Moreover, representation of texts and people emerged as key factors structuring the fields of visual social media at the account level.
Keywords
Introduction
Social media have transformed how organizations communicate with stakeholders and the public. This is also the case in art organizations: they increasingly use social media for various purposes including internal collaborations (Amitrano et al., 2018; Holm & Beyes, 2022), external communications (Gielen, 2010; Lazzeretti et al., 2015; Tsourvakas et al., 2016), and providing interaction platforms (Hausmann & Poellmann, 2013). Their digital expressions that reflect their efforts and the underlying perspectives form part of broader social representations (SRs), which are systems of opinions, knowledge, and/or beliefs shared by a group of people (Rateau et al., 2012), of art organizations.
Despite the growing importance of social media posts for understanding organizational SRs, research has largely focused on the SRs expressed by individuals (Pindado & Barrena, 2021) or in mass media (Ittefaq et al., 2022) on particular issues. Little is known about how art organizations construct and disseminate SRs on social media, particularly through visual materials. Considering visual materials, such as photos, illustrations, and videos, have become dominant modes of communication on social media, understanding the visual SRs among art organizations is crucial for grasping how the organizations regard the interactions on social media for their activities.
Moreover, prior studies on visual SRs in organizational social media have largely relied on manual content analysis methods (Shaw et al., 2022; S. Y. Lee et al., 2022), limiting the amount of data and the type of generated knowledge. While computational methods have been employed to investigate SRs in photos (Cano-Martínez et al., 2023), their application to organizational communication, especially within the arts sector, remains scarce. This study addresses this gap by applying computational techniques to analyze the visual SRs in art organizations’ Instagram photos.
This study is grounded in the social representations theory (SRT), which has been extensively applied in various contexts to examine how collective meanings are formed, maintained, and transformed (Moscovici, 1984; Rateau et al., 2012). By applying SRT to the analysis of visual social media content, this study extends its applicability to organizational communication in the digital era, particularly in the arts sector. This approach aligns with prior research that has examined the role of visual media in shaping public perceptions and collective understandings (Martikainen & Sakki, 2021; Hakoköngäs et al., 2020), thereby providing a strong theoretical foundation for analyzing the social representations constructed by art organizations on Instagram. Beyond its academic contributions, this research holds societal relevance in demonstrating how art organizations contribute to the construction of shared cultural values in the digital sphere. Given the increasing dominance of visual social media in public discourse, understanding how these organizations visually communicate their missions and values is essential for fostering cultural participation, inclusivity, and community engagement. As arts and culture sectors often serve as critical spaces for civic dialogue and social cohesion, examining their digital strategies helps illuminate broader questions about cultural democracy and digital accessibility.
Based on the above considerations, the present study aims to identify the key elements and structure of visual SRs in art organizations’ social media posts. For this aim, this study analyzes the Instagram photos on art organizations’ accounts using computational methods. These analyses would exhibit how the visual SRs in art organizations’ Instagram photos are structured and what roles they play for organizational activities. In doing so, the study contributes to the literature on art organizations’ online communication strategies.
Related Works
Studies on Art Organizations
Various aspects of art organizations have been examined in the literature. First of all, finance and performance of art organizations have been the major themes of study. It has been investigated how budget use was related to institutional complexity (Amans et al., 2015) and how priority of fundraising was influenced by internal and external financial conditions (Y.-J. Lee & Shon, 2018). The importance of performance measure in art organizations has been discussed (Zorloni, 2010), and the validity of Tuckman-Chang financial vulnerability measures was examined in particular (Hager, 2001). Next, the internal structure and the self-innovation of art organizations have been inspected. The distribution of organizational members’ influence, the grouping patterns between volunteers and staffs, and the influence of those factors on organizational effectiveness were examined (Kushner & Poole, 1996). It has been also studied how art organizations attempted to meet the challenges of globalization (Gielen, 2010) and entrepreneuring (Holm & Beyes, 2022). Additionally, the social meanings of art organizations have been discussed in the literature. It has been examined how art organizations contributed to the mental well-being of people (Cotter & Pawelski, 2022) and how art organizations were related to urban development (Zilberstein, 2019).
The SNS communications of art organizations, however, have not been examined sufficiently. A limited number of studies has paid attention to the public relation of art organizations. For example, Fillis (2003) has explored how art organizations built their public images and used them to grow in domestic and international markets. Camarero et al. (2012) has found that art organizations’ public images were closely linked to the brand equity that the public maintains regarding the organizations. Despite those studies, insufficient attention has been paid to how art organizations use SNSs for communicating with the public. Furthermore, the SNS posts on art organizations’ accounts have been rarely analyzed. The present study attempts to fill this gap by analyzing art organizations’ Instagram posts.
Visual SRs in Organizational Social Media
Visual materials can be more effective than textual ones in many contexts of communication (Mele et al., 2023; Metastasio et al., 2024; Mooseder et al., 2023). An inborn ability distinguishes seeing from the skill of reading, which is acquired postnatally. Thus, visual materials have a more immediate impact on human perception than textual ones. The picture superiority effect suggests that pictures are easier to comprehend and remember than words (Hockley, 2008; Stenberg, 2006). This might be also the case in organizations’ public communication. Organizational messages with stronger visual stimuli have been found to be more effective in inducing the public action (Chung & Lee, 2019). Furthermore, the social media environments could enable organizations to deliver more messages in visual forms to the public and make the organizational communications more effective.
Despite the growing importance of visual social media for organizational communications, visual SRs in the social media posts of organizational accounts have been examined only in a limited number of studies. These studies demonstrated how particular issues or themes were represented in the social media photos of organizations in relevant domains. For example, S. Y. Lee et al. (2022) investigated the representations of natural disasters in humanitarian aid organizations’ photos. Guidry et al. (2017) examined how Ebola was represented in health organizations’ photos. Cassinger and Thelander (2020) explored the conventions that influence the representation of employee voice on corporate Instagram. Shaw et al. (2022) demonstrated the representation of wildlife in conservation organizations’ photos. Sutton and Vacarezza (2020) illustrated the representation of abortion rights in the photos of women’s rights activists’ organizations.
Art organizations’ visual SRs in social media photos have not been actively investigated. Although the importance of social media for art organizations has been acknowledged (Amitrano et al., 2018), only few studies have examined SRs of art organizations in textual forms. The content of the mission statements and communication materials was analyzed to show what art organizations deliver to the public about themselves (Foreman-Wernet, 2017). Other than these rare studies, the SRs of art organizations were hardly investigated, let alone in their visual forms. This study attempts to fill this research gap by examining visual SRs in Instagram photos of art organizations.
Elements of Visual SRs
According to SRT, an SR is developed through two key processes: anchoring and objectification (Moscovici, 1984). Anchoring involves understanding new phenomena by linking them to existing knowledge and experiences. In this process, objects or issues of interest are interpreted based on the framework of established notions held by relevant groups or subjects (Arruda, 2015). In contrast, objectification transforms abstract phenomena into concrete and tangible entities by assigning them a scheme or figure. This process involves reconstructing the main attributes of the phenomena to become verbal or visual symbols (Martikainen, 2019). These two processes are not separate but interconnected activities that occur collectively within groups of people to generate and refine SRs.
Thus, visual SRs in photos can be analyzed by identifying what the photos are about and what are primarily represented in them, as these elements often result from the processes of anchoring and objectification (Martikainen & Sakki, 2021). Additionally, words embedded in photos serve as another key element of visual SRs, acting as verbal symbols that directly convey SRs. In this regard, previous studies on SRs have analyzed words as critical components of SRs (Pindado & Barrena, 2021; Sensales et al., 2021), which applied equally to words embedded in photos (Hakoköngäs et al., 2020). In fact, words embedded in photos can be modified in terms of their size, color, and font to attract viewers’ attention, making them a more direct expression of the photographer’s (and uploader’s) interests than the caption texts accompanying the photos. Furthermore, the visual characteristics of given photos are another key element of visual SRs because they can shape how the objects and words in the photos are displayed visually (Kugelmann et al., 2019).
Identifying the elements of visual SRs through manual content analysis, which has been used in the literature, is challenging. This is because detailed visual characteristics (e.g., pixel-level information) of photos are difficult to examine and a large number of photos are difficult to analyze (Martikainen, 2019). Here, computational analyses offer viable alternatives for examining the elements of visual SRs (Cano-Martínez et al., 2023). For example, the main content of a given photo can be identified using computer vision techniques, such as photo classification and content tagging. Words embedded in photos can be detected using an optical character recognition (OCR) technique. Additionally, the pixel-level information can be processed to quantitatively measure various visual characteristics of a given photo.
To examine visual SRs in art organizations’ Instagram photos, this study identifies the key elements of these representations. The primary focus is to observe what the photos are generally about and what objects are mainly represented in the photos. Moreover, this study examines the embedded words in the photos. These observations are expected to provide insights into the general aspect of the SRs conveyed in art organizations’ Instagram photos. In addition to the general aspects, the detailed aspects of visual SRs can be investigated by dissecting the visual SRs into segments. In other words, visual SRs can be examined not only at the total dataset level but also at the subset levels that may reveal another aspect of SRs. These detailed segments of visual SRs have rarely been explored in the literature on visual SRs. Clustering and correspondence analysis (CA) can be used for this purpose (see the Methods section for details).
Based on the previous studies reviewed above, this study raises the following research questions (RQs):
Method
Research Sample and Data Gathering
Lists of art organizations were acquired from the websites of the National Endowment for the Arts (https://www.arts.gov/state-and-regional-arts-organizations) and the Council for Art Education (https://councilforarteducation.org/resources/art-centers-and-associations/) of the United States. From these lists, state/jurisdictional art agencies and nonprofit art organizations were selected. Instagram account of each organization was then obtained from its official website. Instagram was selected because it is one of the representative photo-centric social media. Organizations with no or inactive (with less than 30 uploaded photos) accounts were excluded from the research sample. As a result, 348 accounts of art organizations were selected for analysis.
The data were gathered using the Instagram-Scraper-2021 program (https://github.com/aahouzi/Instagram-Scraper-2021), which extracts data from the HTTP Archive (HAR) file that contains traces of interactions between a web browser and a website. The profile page of a given account was opened with a web browser, scrolled down by page five times to generate additional interactions between the web browser and the website. The resulting HAR file was saved, and the photos were obtained from the file. Approximately 15 photos were displayed on each page (profile and scrolled pages), and the most recent 90 photos were initially aimed to be collected. When the number of uploaded photos was fewer than 90 in some accounts, all photos in the accounts were gathered. As a result, 27,873 photos (M = 80.095, SD = 8.891) were collected and used for analysis.
Determining the Content of Photos
The content of a given photo was determined using the Image Analysis function of Microsoft Azure AI Vision services (https://learn.microsoft.com/azure/ai-services/computer-vision/overview-image-analysis), which has been used in prior studies for various purpose (Ghermandi, et al., 2022; Malighetti et al., 2020; Peng, 2021; Peng et al., 2024). First, a given photo was categorized based on its content. The pretrained AI determined the taxonomy-based categories; 15 classes in the main category and 86 classes in the subcategory. The main category is used, which has the following classes: abstract, animal, building, dark, drink, food, indoor, others, outdoor, people, plant, object, sky, text, and transportation. Next, content tags based on recognizable objects, living beings, scenery, and actions in a given photo were obtained. A tag is accompanied by a confidence score, indicating its degree of correspondence with the photo content. These two kinds of results from a photo were aggregated at the respective levels of total photos, photos in each cluster (described in a later section), and photos in an account: the proportion of photos in each content class was assessed, and the average confidence score of each content tag was obtained.
Detecting Embedded Words in Photos
The printed or handwritten text in a given photo was detected using the OCR function of Microsoft Azure AI Vision services (https://learn.microsoft.com/azure/ai-services/computer-vision/overview-ocr). The detected English words were transformed into lowercase letters. Punctuation marks, stop words, and the markers for web addresses (e.g., “www,” “http”) were then removed. The remaining words were lemmatized so that different variant forms of a word were transformed into their lemma. Consequently, 214,046 words were obtained after the above preprocessing, and the frequency of words was counted at the respective levels of total photos, photos in each cluster (described in a later section), and photos in an account. The preprocessing and analyses of words were performed using the NLTK library (version 3.9.1; Bird et al., 2009) in the Python language (version 3.12.7).
Clustering Photos
Clustering is a data analysis technique to group data units based on their characteristics (Waggoner, 2020). In other words, it divides a dataset into groups in which units within the same group are similar and units in different groups are dissimilar. Clustering is particularly useful for uncovering data structures in latent layers that are distinct from the overall dataset layer, and it has been widely used in social science research (Fonseca, 2013). This technique has also been employed in SR studies, where clusters generated via clustering can reveal the underlying structure of SRs. In this regard, several studies have used to examine SRs (Chartier & Meunier, 2011; Pindado & Barrena, 2021; Rochira et al., 2020). Clustering has also been used to analyze social media photos for various purposes (Castellano & Vessio, 2022; Ketonen & Malik, 2020; J. Kim & Kang, 2022; Wazarkar & Keshavamurthy, 2020). These previous studies provide a solid foundation to apply clustering methods to examine visual SRs.
All the photos in the research sample, irrespective of their accounts, were clustered using the k-means clustering algorithm (Waggoner, 2020). For clustering, each data unit should be transformed into feature vectors, where manually extracted features or features from deep neural networks (DNNs) models can be used. DNN-based features are known for better performance in clustering (Curiskis et al., 2020); however, they are also known as a “black box,” indicating their unsuitability for human understanding. Thus, the clustering was conducted using DNN-based features, but the resulting clusters were compared using manually extracted features (described in a later section). Specifically, each photo was fed into the ResNet50 model (He et al., 2016) which was pretrained on the ImageNet dataset (Deng et al., 2009), and the parameter values in the second to the last layer were used as a feature vector in 2,048 dimensions. The elbow method, silhouette score algorithm (Yuan & Yang, 2019), and cluster stability analysis (von Luxburg, 2009) were then used to determine the optimal number of clusters. Algorithms were run with 10 different centroid seeds, and the average results are presented for each number of clusters in the respective panels of Figure 1. The results of the determination suggest that two clusters are optimal. Accordingly, the photos were clustered into two clusters. Clustering was performed with scikit-learn library (version 1.6.1) in the Python language.

Determining the optimal number of photo clusters using the (a) elbow method, (b) silhouette score algorithms, and (c) cluster stability analysis.
Extracting the Photo Features
Features for comparing clusters and conducting CA were extracted. The Gini coefficient was calculated from the distribution of photo proportions in each content class on an account. This measurement represents the concentration (i.e., nondiversity) of photos in terms of their content. Moreover, the number of words embedded in the photos was also used as an analytic feature. Other features are described below.
Facial Features
Features representing the characteristics of human faces in a given photo were extracted using Google Cloud Vision API (https://cloud.google.com/vision). The pretrained AI returned information about human faces and their emotional states in a photo. The information was processed to extract the following features: the number of faces, closeup (i.e., the area ratio of the largest face to the photo), and face ratio (i.e., the area ratio of all faces to the photo). The emotional states were exhibited by a real number between 0 and 1 in four classes (i.e., joy, sorrow, anger, and surprise), and the states were averaged for each class across all faces in a photo.
Pixel-Level Features
Features regarding the visual characteristics of a given photo were determined using the information in pixels. The information can be processed in color space models, such as RGB (red, green, and blue) or HSV (hue, saturation, and value [i.e., lightness]). First, the pixel values were aggregated by means and variances in RGB and HSV, respectively; thus, red mean, red variance, green mean, green variance, blue mean, blue variance, saturation mean, saturation variance, value mean, and value variance were extracted. The hue in the HSV model is a circular value on a color wheel; thus, the hue mean direction and hue circular variance were extracted instead of the simple mean and variance (Hanbury, 2003). Additionally, the number of peaks in the hue histogram (hue peaks) was measured. This value represents the degree of being monotonous or mussy of a given photo (Mao et al., 2003). The value was measured as the number of local maxima in the hue histogram, which was smoothed using the kernel density estimation algorithm.
The pixel-level features for aesthetic aspects of a photo were also extracted. First, brightness of a given photo was assessed using the average luminance (Y values in YUV color space) of the photo (San Pedro & Siersdorfer, 2009). Colorfulness was measured based on an algorithm that uses the relative strengths of RGB values in pixels and their means and standard deviations (Hasler & Süsstrunk, 2003). Naturalness, which refers to the degree of correspondence between a given photo and human perception of reality, was measured using an algorithm that uses pixels in HSL color space whose values reside within a certain range respectively (Huang et al., 2006). Contrast is relevant to the relative variation of the luminance of a given photo, and it was assessed using the square root of the mean of the difference between the pixel luminance and mean luminance in the HSL color space (Obrador & Moroney, 2009). RGB contrast was measured by applying the contrast algorithm to pixels in RGB space (San Pedro & Siersdorfer, 2009). Sharpness is a measurement of the detail of a given photo, and it was measured using an algorithm that uses the Laplacian of each pixel’s luminance and the average luminance of its surrounding pixels (San Pedro & Siersdorfer, 2009). Color diversity was measured using the box-counting method that calculates the fractal dimension of a given photo (D. Kim et al., 2014). Color harmony, which shows the extent of harmony between the key colors in a given photo, was measured using the algorithm proposed by Machajdik and Hanbury (2010). The two highest peaks in the hue histogram smoothed by the kernel density estimation algorithm were identified, and the internal angle between them on the color wheel was measured as color harmony.
Performing CAs
CA is a data analysis and visualization technique used to identify artificial dimensions that explain variances within a dataset and to determine the contribution of each data unit and variable to these dimensions (Greenacre, 2017). Typically, top two dimensions with the highest explained variances are used for analysis and visualization. Since data units and variables are distributed within dimensions that retain as much of the original variance as possible, these dimensions and contributing variables reveal the key criteria by which data units differ from one another. These criteria are particularly useful for examining SRs because they reveal how SRs are structured among individuals or groups that have contributed to the generation of SRs. Thus, CA has been widely used to examine SRs in the literature (Brondi et al., 2021; Meier & Kirchler, 1998; Melendrez-Ruiz et al., 2021), but the data analyzed have been mainly in textual form. Although CA can also be used to analyze visual data, its use for this purpose is relatively limited (Bast, 2024).
CAs were conducted using an account as the unit of analysis, and the relevant features were averaged at the account level. The variables used for a CA should be in the same scale (Greenacre, 2017): thus, separate CAs were conducted respectively using the features on the same scale. Precisely, the proportion of photos in each content class, photo features, and top 50 frequent words embedded in photos were used for CAs. The first CA was performed using the proportion of photos in each content class to all photos in an account. The photo features on a continuous scale were recoded by rank (Greenacre, 2017) in order to be used for the second CA. The third CA utilized the frequencies of the top 50 words in the photos of an account (determined in an earlier section). The CAs were performed using the ca package (version 0.71.1; Nenadic & Greenacre, 2007) in the R language (version 4.4.3).
Results
In this section, the results of the analyses are presented in the order of RQs raised in the previous section. The interpretation of the results and their implications will be presented in the Discussion section.
Major Content and Embedded Words (RQ1)
Figure 2a and b show the result of inspecting the major content of art organizations’ Instagram photos. As shown in the figure, text was the major content of art organizations’ Instagram photos. Photos classified in the text class took the largest share, and text-related content tags were included in the content tags with a high confidence score. Additionally, people were another major content. Photos classified in the people class took the second largest share, and people-related content tags were also included in the content tags with a high confidence score. Notably, the considerable share of photos in the abstract class (i.e., abstract shapes or patterns) and the high confidence scores of art-related content tags suggest that art was included in the major content of art organizations’ Instagram photos.

(a) Frequency of photos by content class, (b) top 15 content tags by confidence score, and (c) top 50 frequent words embedded in art organizations’ Instagram photos.
Figure 2c shows the top 50 most frequent words embedded in art organizations’ Instagram photos. Besides general words like “art” and “artist,” words relevant to names of organizations were frequently presented in the photos. Additionally, words related to events probably held by the organizations were embedded in the photos. The organizations also presented words about times and locations of events, and they advertised events by words describing the events. Notably, the organizations presented words relevant to demanding the public to do something, probably for the events and organizations.
Comparing Clusters (RQ2)
Photos were clustered into cluster 1 (18,114 photos) and cluster 2 (9,759 photos), and the two clusters were compared in terms of their major content, photo features, and the words embedded in the photos.
Figure 3 compares the content of the two clusters. As shown in the figure, people were the major content in the photos of the first cluster, while text was the major content in the photo of the second cluster. In cluster 1, photos in the people class took the largest share, and photos in the outdoor and indoor (where interactions among people might occur) classes took considerable shares. Content tags regarding people and the backgrounds of their interactions were included in the content tags with a high confidence score. At the same time, photos in the abstract class took a considerable share, and art-related content tags were also included in the content tags with high a confidence score. Based on these results, it can be inferred that people appearing with artworks in indoor and outdoor settings were the major objects represented in the photos of the first cluster. In cluster 2, photos in the text class took the dominant share, and content tags related to text and graphics had high confidence scores. These results indicate that texts decorated with graphics were the major objects represented in the photos of the second cluster.

Comparison of two detected clusters in terms of the frequency of photos by content class (top row) and top 15 content tags by confidence score (bottom row).
Table 1 compares the two clusters in terms of photo features. All the facial features were greater in cluster 1, whereas the number of words was greater in cluster 2. Specifically, the number and area of human faces were greater in cluster 1 and all the emotions were also stronger. In contrast, more words appeared in cluster 2. These results correspond to the major content of the photos in respective clusters: photos of people content in cluster 1 displayed more and larger human faces with stronger emotions, whereas photos of text content in cluster 2 displayed more words.
Comparison of the Two Detected Clusters in Terms of Photo Features.

Significantly greater than the other cluster.
Regarding pixel-level features, the photos of the first cluster were greater in value variance, hue variance, and color diversity. These results indicate that these photos exhibited greater variation in lightness and color. The hue mean direction in the first cluster was 193, which was higher than that of the second cluster. On the color wheel, 180° corresponds to pure green, and green becomes darker or lighter as the degree increases or decreases around there. Thus, this result suggests that the photos in the first cluster were generally more green-colored than those in the second cluster. Additionally, the photos in the first cluster were more detailed (greater sharpness) and more harmonious in color (greater color harmony) than those in the second cluster. The above results could be attributed to various settings where people appeared in the photos. They would have made the photos more diverse in lightness and color, more green-colored, more detailed, and more harmonious in color. In contrast, the photos in the second cluster were greater in RGB means and variances. Saturation and value were greater, and brightness and colorfulness were also greater in the second cluster. These results indicate that colors were generally stronger in cluster 2. The dominance of text content in the second cluster can account for the results: words in the photos would have been displayed brightly and in bold colors. This account can also be applied to higher (RGB) contrast and hue peaks: the text-presenting photos of the second cluster were more monotonous and contrasted.
Finally, the two clusters were compared in terms of the words embedded in the photos. Figure 4 shows the top 50 frequent words in the photos of respective clusters. Other than the overall higher frequency of words in cluster 2, the compositions of words were generally similar in both clusters. Out of 50, 35 words were common in both clusters, and the kinds of words were similar to those found in the previous section. They were mainly related to names of organizations, events, times and locations of events, descriptions of events, and calling for actions.

Comparing two detected clusters in terms of the top 50 frequent words embedded in photos: (a) cluster 1, (b) cluster 2.
Some words appeared only in one of the two clusters, but they also belonged to the kinds of words found in the previous section: words related to names of organizations, events, times and locations of events, description of events, and calling for actions were presented in the photos. Notably, words about certain values were embedded in the photos of cluster 1. Nevertheless, it can be said that the embedded words were generally similar between the two clusters.
CA Results (RQ3)
The results of CAs were presented in CA plots (Figures 5–7) and CA tables (Tables 2–4) below. Top two dimensions used for visualizations in the CA plots were also presented in the CA tables. A dimension with a singular value greater than 0.2 is generally accepted as feasible (Wang et al., 2020), which was the case for the top two dimensions of all CAs plots and tables below. Among all features, ones with a substantial contribution to either dimension were displayed; the contribution larger than average was considered substantial according to the guideline in Greenacre (2017).

CA plot using the proportion of photos in each content class. Each gray circle represents each account.

CA plot using photo features. Each gray circle represents each account.
CA plot using the frequency of top 50 words. Each gray circle represents each account.
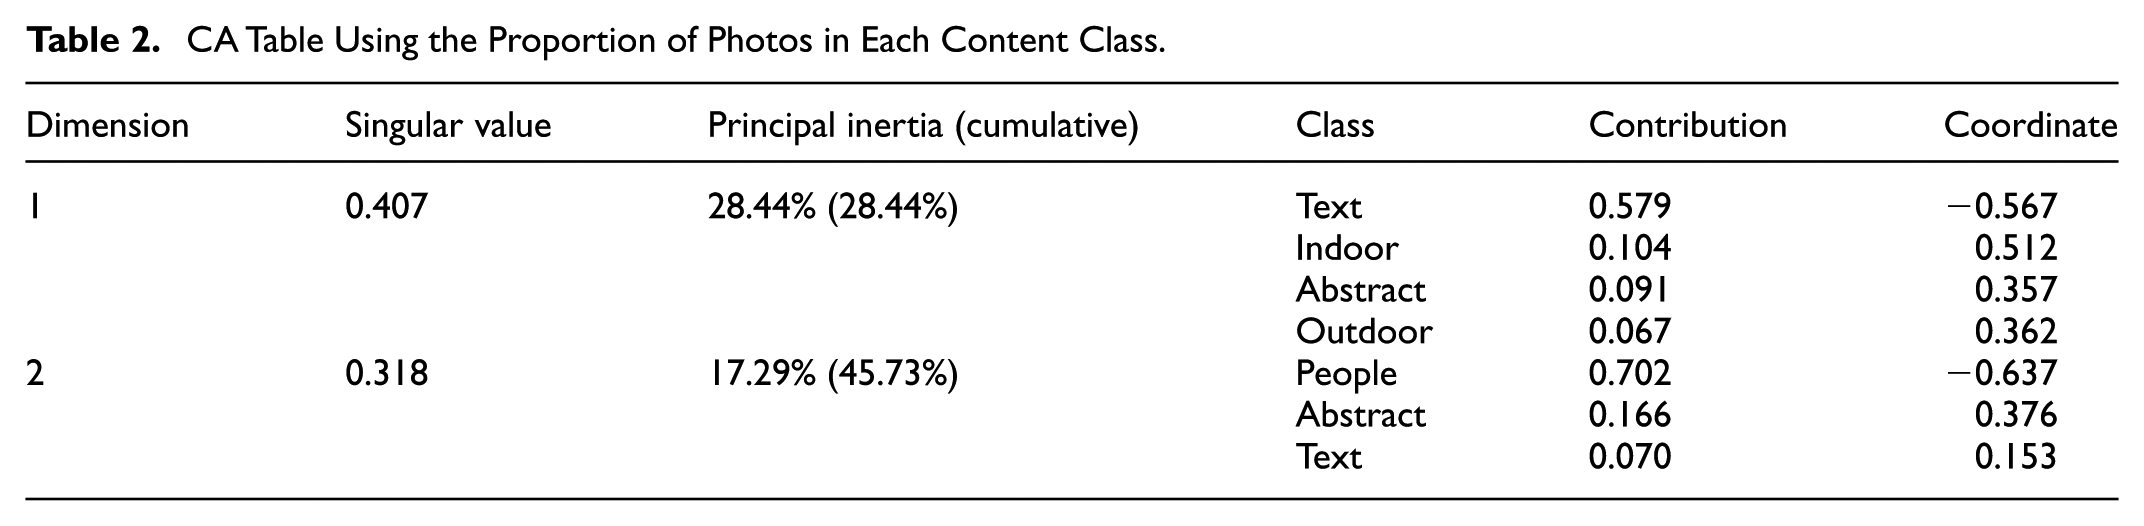
CA Table Using the Proportion of Photos in Each Content Class.
CA Table Using Photo Features.

CA Table Using the Frequency of Top 50 Words.

Figure 5 and Table 2 shows the first CA result obtained using the proportion of photos in each content class. The first dimension, which explained 28.4% of the total inertia, can be identified as “text vs. art” dimension. It separated the high proportion of photos in the text class and the high proportions of photos in the abstract, indoor, and outdoor classes which indicate artworks in various settings. The second dimension, which explained another 17.3% of the total inertia, can be identified as “people vs. art and text” dimension. The high proportion of photos in the people class in one pole was opposed to the high proportions of photos in the text and abstract classes in the other pole. These results suggest that these two dimensions were the criteria by which art organizations’ Instagram accounts differed in terms of their SRs. Notably, the proportions of photos in the abstract, indoor, and outdoor classes were located close to each other and distinct from other features in the CA plot. This result suggests that there existed a group of accounts that uploaded mainly art-related photos, unlike other groups of accounts that uploaded mainly text- or people-related photos.
Figure 6 and Table 3 show the second CA result obtained using the photo features. The first dimension, which explained 28.5% of the total inertia, can be summarized as “facial features” dimension. All facial features were located in one pole of the dimension, and no other features made substantial contribution in the opposite pole. In other words, facial features were the key determinants of the dimension. This result corresponds to the above CA result that the proportion of photos in the people class constituted one of the key dimensions of the CA field regarding the content category. The second dimension, which explained another 21.6% of the total inertia, can be summarized as “pixel features” dimension. Many pixel-level features (e.g., means and variances of RGB, value mean, brightness, [RGB] contrast, and saturation variance) were located in one pole of the dimension, and no other features had substantial contributions in the opposite pole. The substantial features in this dimension were also the features that were greater in the text-centered cluster presented in the previous section. The number of words also contributed substantially to this dimension. Thus, the pixel features relevant to text presentation in photos were the key determinants of the second dimension. These results suggest that these two dimensions were the criteria by which art organizations’ Instagram accounts differed in terms of their SRs.
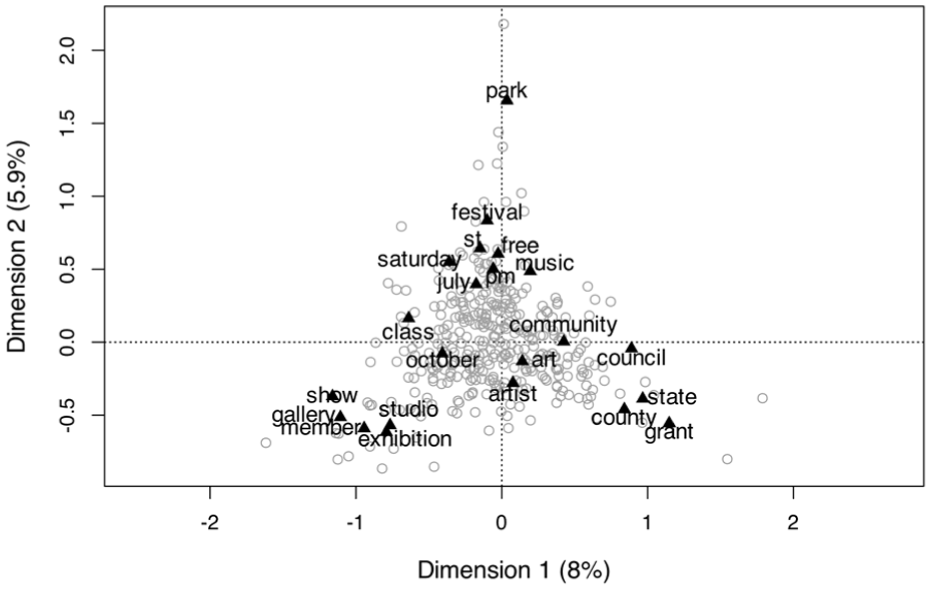
Figure 7 and Table 4 present the third CA result obtained using the frequency of the top 50 words. The first dimension, which explained 8% of the total inertia, can be summarized as “event vs. organization name” dimension. The high frequency of words related to events were located in one pole, and the high frequency of words related to names of organizations were located in the other pole. The second dimension, which explained another 5.9% of the total inertia, can be summarized as “event vs. general” dimension. The high frequency of words related to events were located in one pole, and the high frequency of general words related to art were located in the other pole. However, these two dimensions explained only 13.85% of the total inertia, which were smaller than the dimensions regarding the proportion of photos by content class (45.73%) and photo features (50.13%). Thus, the frequency of the top 50 words did not differ distinctively among the art organizations’ Instagram accounts.
Discussion
In this section, the major findings are summarized and their implications are discussed. The limitations and the suggestions for future research are also presented.
Summary of Principal Findings and Discussions about Them
First, text was the major type of object represented in Instagram photos of art organizations. The proportion of the photos in the text class was the largest, text-related content tags had high confidence scores, and one of the detected photo clusters was text-centered. On the one hand, this finding can be understandable from the general composition of Instagram content where photos with embedded text were one of the major types (Hu et al., 2014). On the other hand, however, the finding suggests that art organizations presented texts more than other types of objects, such as artworks, to the public. Individual artists or curators have utilized social media to exhibit the artworks of their own or of their interests directly to the public (Fisher, 2016; Kang et al., 2019) thanks to the multimedia functionalities of social media. In contrast, our finding indicates that this is not the case in art organizations; they mainly used their Instagram posts to deliver messages to the public in textual forms, even though Instagram is a photo-centric social media. This underuse of the Instagram’s visual functionalities reveals the art organizations’ perception of Instagram. Art organizations might consider Instagram more as a messaging tool for organizational purposes than a virtual place where artistic creators and fans can interact. In fact, this use of photos as a text carrier can be an effective strategy, since words embedded in photos can be easily manipulated in terms of their graphic effects. However, art organizations’ limited perception of Instagram would have restricted the potential of the platform as an online artistic scene.
Furthermore, the texts presented in art organizations’ Instagram photos were mainly related to organization names, events (their times, locations, and descriptions), and calling for public actions. It is not surprising that organization names were included in the photos; they have been one of the major elements in the textual posts of art organizations (Foreman-Wernet, 2017). However, it is remarkable that calling for actions was one of the key contents of the embedded texts in the photos. According to the information-community-action framework (Lovejoy & Saxton, 2012), organizational social media messages function mainly in one of the three ways: delivering information to the public, building community for the public, and arranging actions with the public. Unlike traditional websites, social media have the potential for building community and performing actions with the public through their dialogic communication capabilities (Lovejoy & Saxton, 2012). However, previous studies have demonstrated that this potential has been actualized only limitedly in many cases (Qu, 2020; Zhou & Pan, 2016). In contrast, our finding indicates that art organizations actively called for actions of the public. Moreover, it was observed that information about events was another major content of the embedded texts in the photos. These results suggest that the actions called for in the photos probably referred to participating in the events. Given that presence is one of the crucial factors for enjoying the arts, the use of embedded texts in photos to call for participation in such events can be a suitable strategy. At the same time, however, the results also reveal that art organizations considered Instagram as an instrument to mobilize people for their events rather than as an online venue for interaction with the public.
Next, people were another major type of objects represented in Instagram photos of art organizations. The proportion of the photos in the people class was the second largest, people-related content tags had high confidence scores, and the other detected photo clusters was people-centered. This result can be understood from the general notion that social media are for the relationships among people and from the literature suggesting that photos of people have been the most popular content type on social media (Bakhshi et al., 2014; Koutromanou et al., 2023). Furthermore, the people in the photos might be the ones relevant to art (e.g., artists or viewers); the people-centered photos in cluster 1 also had art-related content tags with high confidence scores. They were probably not the photo takers themselves, because selfies were known to take a tiny portion (about 0.7%) of Instagram photos (Caliandro & Graham, 2020) and the accounts were of organizations not personal users. Therefore, people working on or looking at artworks were mainly represented in art organizations’ Instagram photos. This representation of people with artworks, rather than artworks only, shows a contrast to the social media use of artists and curators, who mainly presented artworks on their accounts (Fisher, 2016; Kang et al., 2019). This contrast suggests that organizational facets were more emphasized than artistic facets in art organizations’ SRs on Instagram. They might want to show more about interaction between people and artworks than artworks themselves. This would explain why words related to certain values (e.g., “history,” “one,” “love,” and “life”) were presented with people in the photos of people-centered cluster. The values would be related to the organizational goals that art organizations seek to achieve.
Finally, the representations of texts and people were the key determinants that structured the field of visual SRs at the account level. The proportions of photos in the text and people classes were the major criteria by which art organizations’ Instagram accounts differed in terms of their SRs. Relatedly, the prominence of facial features, usually relevant to people photos, and that of pixel-level features, usually relevant to text photos, were the other criteria by which the accounts differed in terms of their SRs. These results suggest that there were accounts that played leading roles in structuring the fields of visual SRs. A part of accounts uploaded a high proportion of text photos with high values in pixel-level features, and other part of accounts uploaded a high proportion of people photos with high values in facial features. It is beyond the scope of this research which factors might have influenced this difference among accounts (it would be a topic for future research). However, inspection of the structure of SRs using visual features has been rarely performed in the literature; lexical features have been mainly used to identify the structure of the representation field (Brondi et al., 2021; Meier & Kirchler, 1998; Melendrez-Ruiz et al., 2021). Thus, the above results can be meaningful as a dissection of visual SRs; CAs revealed the aspect of visual SRs that average feature values and photo clusters could not. The results would also serve as a possible reference for future research that would dissect various types of visual SRs. Notably, the accounts did not distinctively differ in terms of the composition of the words embedded in their photos. This result indicates that the messages that art organizations intended to convey directly to the public through words did not differ by accounts; the difference was only in how the organizations designed their photos in terms of objects and visual characteristics.
Implications
This study offers several meaningful implications for both theory and practice. First, it contributes to broadening the scope of SRT by highlighting the role of visual SRs within the context of organizational social media. While prior studies have primarily focused on textual representations, this research emphasizes that social media platforms—particularly visual ones like Instagram—can serve as rich environments where organizations communicate values, priorities, and identities not only through texts but also through photos. This expands the theoretical understanding of SRs by showing how the processes of anchoring and objectification operate in the visual-digital context of organizational communication. Specifically, the study illustrates how art organizations anchor their visual content in organizational goals and objectify them through recurrent visual motifs such as text, people, and event-related information. As De Paola et al. (2022) suggest, the multimodal nature of social media facilitates the sharing of emotions, beliefs, and symbolic meanings, making them especially conducive to sharing SRs. By analyzing art organizations’ Instagram photos, this study showed what was mainly represented in the photos and how they were used to communicate with the public. These insights would deepen our understanding of how art organizations present themselves and interact with the public in the digital age. Furthermore, the findings provide practical insights for art organizations and similar entities seeking to enhance their digital communication strategies. Organizations can use these insights to critically assess their current social media practices and better align their visual messaging with their desired public image, whether by fostering community engagement, promoting events, or reinforcing organizational identity. Finally, this study suggests promising avenues for future research. In particular, scholars can build upon this work to examine whether similar visual SR patterns emerge in other sectors, such as corporate or non-profit domains, and how these patterns may influence key outcomes such as audience engagement, brand perception, or organizational performance.
Methodologically, the study can serve as an example of analyzing visual SRs by combining computational techniques for image content analysis, embedded word extraction, clustering, and CA. These techniques can be applied for analyzing other datasets, making this approach broadly applicable to other organizational contexts. Practically, the findings offer organizations a framework for critically evaluating their visual presence on social media. Since SRs can influence public perception, organizations can benefit from understanding how they are visually presented and whether their presence aligns with their intended goals or values. Further, organizations may improve their public image and strengthen engagement with their audiences by adjusting their visual SRs. Culturally, this study can show how the digital technologies are used in the cultural domain. It presents an example of how cultural organizations endeavor to establish a connection with the public via new technologies.
Limitations and Further Research
The major limitation of this research is the exclusive focus on U.S.-based art organizations, which may limit the generalizability of the findings to other cultural contexts. Art organizations in different countries may adopt varying communication strategies influenced by distinct cultural norms, regulatory environments, or audience expectations. Thus, future studies should consider cross-cultural comparisons to examine whether the identified patterns of visual social representations hold in other regions. Additionally, incorporating samples from diverse countries can help mitigate sample bias and enrich the understanding of how cultural context shapes organizational communication on visual social media. Another limitation is the lack of consideration for different art genres. Each art genre (e.g., music, painting, sculpture, craft, etc.) has its own way of exhibiting its works, meaning that organizations within different art genres may use social media differently for public communications. Similarly, state/jurisdictional art agencies and nonprofit art organizations may have varying approaches to social media usage owing to their different goals and communication methods. Considering these aspects would make the results abundant in future research. Finally, this study did not explore other relevant outcome factors that visual SRs may influence. Future research would examine the impact of visual SRs on metrics such as online engagement, participation rate in organizational events, or fundraising success to better understand their effect on organizational performance.
Conclusion
Based on the SRT, this study investigated the visual SR in art organizations’ Instagram photos using computational methods. This study underscores the significance of visual SRs in organizational social media, offering theoretical, practical, and cultural meanings regarding how cultural organizations communicate with the public in the digital environments.
Footnotes
Ethical Considerations
This article does not contain any studies with human or animal participants.
Informed Consent
There are no human participants in this article and informed consent is not required.
Funding
The author received no financial support for the research, authorship, and/or publication of this article.
Declaration of Conflicting Interests
The author declared no potential conflicts of interest with respect to the research, authorship, and/or publication of this article.
Data Availability Statement
The data that support the findings of this study are available from the corresponding author upon reasonable request.