
Abstract
This research is intended to study the behaviors of outpatients in a medical center and constructs a set of data exploration procedures such that hospital management can deal with patient relationship management more effectively. This study adopts LRFM (length, recency, frequency, and monetary) model and cluster analysis, including self-organizing maps and K-means method, to categorize 321,908 outpatients of the medical center into 12 groups and then uses the multidimensional customer clustering philosophy to classify the outpatients. Outpatients can be categorized into five different types of groups, namely, core customer groups, potential customer groups, new customer groups, lost customer groups, and resource-consuming customer groups. In addition, seven types of outpatients based on five types of categories are identified. The similarities and differences of each group based on the patients’ characteristics are analyzed to give differentiation strategy advices for hospital management. Hospital management thus can design the optimal service strategies, provide the best care services, enhance hospital’s performance, and reduce the overall cost to establish quality relationships with outpatients.
Introduction
The health care industry has encountered dramatic changes, including the growth of private health care sectors putting lots of pressures on health care providers for survival and development (Zhou et al., 2017). On the contrary, patients who have the freedom of choice in health care providers have forced fierce competition among health care service providers (Shieh et al., 2010; Zhou et al., 2017). Under such circumstances, the success of health care providers does not only result from having quality technical skills and provision of high-quality medical services solely but also from meeting patients’ needs and encouraging patients to return to the practice (Rundle-Thiele & Russell-Bennett, 2010; Zhou et al., 2017). In addition, Porter and Teisberg (2006) emphasized that the health care industry needs to focus on increasing values for patients through managing a patient’s personal health, provision of a health plan based on value added, acting responsibility, and building a long-term relationship rather than minimizing the short-term costs. Moreover, Dafny and Lee (2016) addressed that putting patients first, creating choices for patients, and making outcomes transparent are the needed changes for health care organizations. As a matter of fact, patient loyalty is a critical success factor that beyond patient satisfaction when health care providers are in an intense competition (Fatima et al., 2018; Ravichandran, 2015).
MacStravic (1987) summarized that patient loyalty is essentially important for health care providers’ marketing strategies because loyal patients are sources of repeat business, potential users of new services, and positive spokespersons in word-of-mouth advertising. When patients spread positive word of mouth, loyalty can enhance health care providers’ brand images (Zhou et al., 2017). Loyalty can be defined as an attitude or a behavior (Fatima et al., 2018). In practice, the intention to go back to the same health care provider, stick with the same provider, and the intention to recommend one’s provider to others can be described as patient loyalty (MacStravic, 1994). Moreover, patients with loyalty might continue to use medical services, follow physicians’ treatment plans, and keep quality relationships with the providers (Zhou et al., 2017). That is, loyalty brings continuity of care, compliance with medical advices, and greater use of preventive services (MacStravic, 1994). It would be essential to develop and maintain patient loyalty for both health care providers and patients (Zhou et al., 2017). Obviously, managing patient loyalty effectively is critically important for health care providers.
To measure patient loyalty effectively, actual behavioral or attitudinal loyalty such as consistency of use or return to the same health care organizations would be a better indicator than expressions of willingness or intention (MacStravic, 1994; Ravichandran, 2015). Chen et al. (2012) stated that identifying target patient segments is an approach to determine high-value patients that enables health care providers to differentiate their services to core groups of target patients, attract the desired target patient segments, and employ resources allocation more effectively. Specifically, targeting patient segments is to divide the entire patients into several groups in accordance with the patients’ characteristics and similar preferences. RFM model using recency (denoted as R), frequency (denoted as F), and monetary (denoted as M) based on the practice/foundation of three important variables (R, F, and M) is an effective tool to perform customer value analysis based on the past customer behaviors (Chen et al., 2012; Zhang et al., 2015). RFM model is a behavior-based tool suitable to analyze the behaviors of a customer in accordance with his or her past behaviors in the database (Hughes, 1994; Wei et al., 2010).
Previous researches showed that RFM model has been used extensively in either patient loyalty or patient value analysis. For instance, Lee (2012) utilized RFM model to analyze inpatients for patient loyalty. Chen et al. (2012) also applied RFM model to identify target patient segments such that health care providers can specifically target and tailor services for different types of target segments. Therefore, RFM model is very suitable in medical industry to perform patient value analysis and patient loyalty. In addition to RFM model, LRFM (length, recency, frequency, and monetary) model has been found to be an effective tool for patient loyalty or patient value analysis. The term “L” represents length that calculates the relationship length between the health care providers and patients (Wu et al., 2014). That is, a longer relationship represents customers having a higher degree of behavioral loyalty. Wu et al. (2014) used LRFM model to analyze patients’ value in a pediatric dental clinic. Besides, Hosseini and Mohammadzadeh (2016) applied LRFM model to analyze patients from emergency clinics for customer value analysis based on patients’ characteristics, preferences, and activities. Furthermore, Mohammadzadeh et al. (2017) employed LRFM model to calculate each patient’s lifetime value such that the health care provider can classify patients into four different types of patients. In doing so, health care providers could further implement customer relationship management (CRM) to strengthen the relationship with patients and apply different marketing strategies to enhance their profits and reduce costs due to patients’ loss. Obviously, using LRFM model in health care industry enables health care providers to identify target patients, provide different health care services effectively, and, particularly, establish long-term relationships with patients.
Review of LRFM Model
RFM model is a behavioral model and was proposed by Hughes (1994) that can be applied to perform customer behavioral analyses and predictions in accordance with the behaviors from the database (Yeh et al., 2009). Hosseini and Mohammadzadeh (2016) pointed out that RFM model is suitable to evaluate customer lifetime value or loyalty, where customer lifetime value can be applied to find profitable customers and enable the management to design strategies to target customers. RFM model is defined as follows (Wei et al., 2010): Recency measures the length of a time period since the last purchase. Frequency is to count the number of purchases in a time period. Monetary is to accumulate the amount of money spent in this time period. These three variables are very useful to segment customers by observing customers’ attitudes toward the product, brand, benefit, or even loyalty from the database.
Reinartz and Kumar (2000) pointed out that RFM model is unable to distinguish whether the customers have long-term relationships with an organization. Chang and Tsay (2004) addressed that customer loyalty can be established by a long-term relationship between a customer and an organization. Thus, Chang and Tsay (2004) emphasized that length “L” should take into account the original RFM model because length depicts the time length–based relationship between the organization and customers (Wu et al., 2014). That is, LRFM model, an extended RFM model, can be applied to analyze customer values and loyalty from the database (Wei et al., 2012). Length “L” is defined as the time length between the first and last purchases in the database.
Traditionally, RFM model is to sort and divide the customer data into five equal segments (Wei et al., 2012). That is, a value of 5 is assigned to represent the top 20% segment, a value of 4 is given to represent the next 20% segment, and so on. Customers can be represented as one of 625 (54) combinations, namely, 5555, 5554, . . ., and 1111. In contrast, Chang et al. (2010) and Wu et al. (2014) preached the use of original data to replace the coded numbers in RFM-based models. In fact, using the continuous values of RFM-based model is more flexible to categorize customer behaviors. This study adopts the philosophy from Chang et al. (2010) and Wu et al. (2014) to use continuous values for LRFM models.
Chang and Tsay (2004) used L, R, F, and M values in each subgroup to compare with the grand averages of L, R, F, and M values of the entire group as a basis to categorize customers. In general, there are 16 (24) combinations when each variable value is divided into greater or smaller than the grand average variable value. In addition, by using F and M variables, the classification consists of best, frequent, spender, and uncertain customers. Furthermore, by using L and R variables, the categorization is composed of close, potential, acquired, and lost relationships. When these four variables are combined together along with the customer value matrix proposed by Marcus (1998), Chang and Tsay (2004) listed 16 different types of customers in terms of L, R, F, and M performance as shown in Table 1, where R is defined as a higher value indicating the more recent visits to the hospital (Wu et al., 2014).
Sixteen Different Types of Customers Based on LRFM Variables.

Note. L = length; R = recency; F = frequency; M = monetary.
Sixteen types of customers depicted in Table 1 can be further categorized into five different types of groups based on Ha and Park (1998). Core customers include high-value loyal customers, high frequency customers, and platinum customers. Potential customers consist of potential loyal customers, potential frequency customers, and potential consuming customers. Lost customers are composed of high-value lost customers, frequency churn customers, consuming churn customers, and uncertain lost customers. New customers are defined as high-value new customers, consuming promotional customers, frequency promotional customers, and uncertain new customers. Finally, resource-consuming customers are composed of low-cost consuming customers and high-cost consuming customers (Chang & Tsay, 2004).
When patients are categorized specifically, hospital management can more effectively achieve their goals by providing high-quality health care services through appropriately designing resources allocation strategies (Chen et al., 2012). In doing so, hospitals can differentiate their offerings and medical services to different patient groups as well as to attract the desired new patients (Chen et al., 2012). Moreover, hospitals can implement CRM to strengthen the relationship with the patients and employ different marketing strategies to enhance their profit (Mohammadzadeh et al., 2017). Ultimately, when patients have higher perceived values from hospitals, their overall satisfaction will be increased and their behavioral intentions will be influenced positively (Zhou et al., 2017). In fact, patients’ perceived value is a determinant of patient loyalty that would result in better and longer relationships between hospitals and patients and bring higher profits for hospitals.
Research Method
A case study using LRFM model based on a database of outpatients’ records of a medical center in Taiwan from January 1 to December 31, 2016, is conducted. Each record from an outpatient includes the patient’s gender, date of visit, age, department (clinic) of visit, cost of visit, and zip code. This study was approved by the Institutional Review Board of Changhua Christian Hospital in Changhua County, Taiwan, with the protocol number of CCH IRB 171103 with the waiver of documentation of informed consent.
Five general guidelines are applied for data cleaning. First, the patient’s records due to nonillness to the hospitals such as preventive care or vaccination are excluded. Second, the patients referred from other hospitals to the case hospital for inspection are excluded. Third, if a patient visits the case hospital for more than once or for two or more departments on the same date, this study considers the patient only seeks the medical treatment once on that particular date. The medical expenses for more than one visit on the same date are added to become one total amount of medical expenditure on that date. Fourth, the length for each patient measures the days from the first and the last visits on the database. It is worth to note that the last visit for each patient would fall in 2016, but the first visit might be earlier than the period. Moreover, if a new patient only comes to this case hospital once, L is defined as a value of 0. Fifth, if a patient was born in 2016, his or her age is less than 1 year old. The age of the patient is assigned to be 0.
There are 321,908 outpatients with 1,683,065 visits in 2016 after data cleaning. The definitions of L, R, F, and M variables are as follows. Length is defined as the number of days from the first visit to the last visit, where the last visit falls in the period of Year 2016. Recency measures the number of days of the last visit in 2016. This study adopts the definition by Wei et al. (2013) by defining January 1 as a number of 1, January 2 as a number of 2, and December 31 as a number of 366. A higher recency value indicates a patient has visited the hospital more recently. Frequency is calculated by counting the number of visits for a patient in 2016. Finally, monetary for each patient is to sum the medical expenditures in 2016 in terms of New Taiwan dollars. The minimum, average, maximum, and standard deviation values for each variable are depicted in Table 2.
Information of L, R, F, and M Variables.

Note. L = length; R = recency; F = frequency; M = monetary.
To perform cluster analysis, L, R, F, and M are input variables. A modified two-stage approach that combines self-organizing maps and K-means method proposed by Kuo et al. (2002) is applied because this approach outperforms either self-organizing maps or K-means method. IBM SPSS Modeler 14.1 is the software, and the “Kohonen node” (namely, self-organizing maps) with default values is used. When the Kohonen node is set to “simple,” the number of clusters is generated. Later, K-means method is employed to cluster 321,908 outpatients in accordance with the determined number of clusters by self-organizing maps.
Results
The demographic variables of outpatients are depicted below. The numbers of male and female outpatients are 138,595 and 183,313, representing 43% and 57% of total outpatients, respectively. The youngest and oldest outpatients for both male and female are 0 and 104, whereas the average ages of male and female outpatients are 42 and 45, respectively. The age groups of total outpatients are described as follows: There are 56,080 outpatients whose ages are 17 years or less, 80,097 outpatients from 18 to 39 years, 118,622 outpatients from 40 to 64 years, and 67,109 outpatients with 65 years or more, consisting of 17%, 25%, 37%, and 21%, respectively. The majority of outpatients’ residence come from four adjacent areas: Changhua County with 250,205 outpatients (77.7%) where the medical center is located; Taichung City with 23,182 outpatients (7.2%); Nantou County with 20,160 outpatients (6.26%); and Yunlin County with 17,499 outpatients (5.44%).
Four variables, namely, L, R, F, and M, are the input variables when self-organizing maps are employed to perform cluster analysis. The suggested number of clusters among 321,908 outpatients is 12. Table 3 summarizes the descriptive statistics among these 12 clusters in accordance with sample size; average numbers of L, R, F, and M; and the symbol(s) of L, R, F, and M greater than the averages of L, R, F, and M, based on the results performed by K-means method with 12 clusters. Specifically, Cluster 5 has the largest average L value, indicating the patients have maintained the longest relationships with the hospital. The patients in Cluster 2 have visited the hospital most recently and most frequently. Moreover, the average money spent in Cluster 2 is the highest among 12 clusters. Most of outpatients are in Clusters 1, 4, 5, 10, and 12. Seven different types of outpatients are found in terms of L, R, F, and M symbols, such as LRFM (Clusters 2, 5, and 11), RFM (Clusters 3, 6, and 10), LRF (Cluster 12), LF (Cluster 1), LR (Cluster 9), RF (Cluster 8), and none (Clusters 4 and 7).
Descriptive Statistics of 12 Clusters Based on K-Means Method.

Note. L = length; R = recency; F = frequency; M = monetary.
By applying the philosophy proposed by Chang and Tsay (2004), the outpatients summarized in Table 3 can be further categorized into seven types of customers, including high-value loyal customers (Clusters 2, 5, and 11), high frequency customers (Cluster 12), potential frequency customers (Cluster 1), uncertain lost customers (Clusters 4 and 7), high-value new customers (Clusters 3, 6, and 10), frequency promotional customers (Cluster 8), and low-cost consuming customers (Cluster 9) as shown in Table 4.
Outpatient Classifications Based on L, R, F, and M Variables.

Note. L = length; R = recency; F = frequency; M = monetary.
Table 5 summarizes seven types of customers in terms of their LRFM symbol, sample size, percentage of the population, average L value, average R value, average F value, average M value, expenditure as a percentage of total medical expenditure in 2016, number of visits as a percentage of the total number of visits in 2016, gender, and age, where Groups 1, 2, 3, 4, 5, 6, and 7 represent high-value loyal customers, high frequency customers, potential frequency customers, uncertain lost customers, high-value new customers, frequency promotional customers, and low-cost consuming customers, respectively. In addition, Table 6 provides top 5 lists of clinic visits in terms of medical expenditure and frequency for these seven groups.
Descriptive Statistics of Seven Groups.
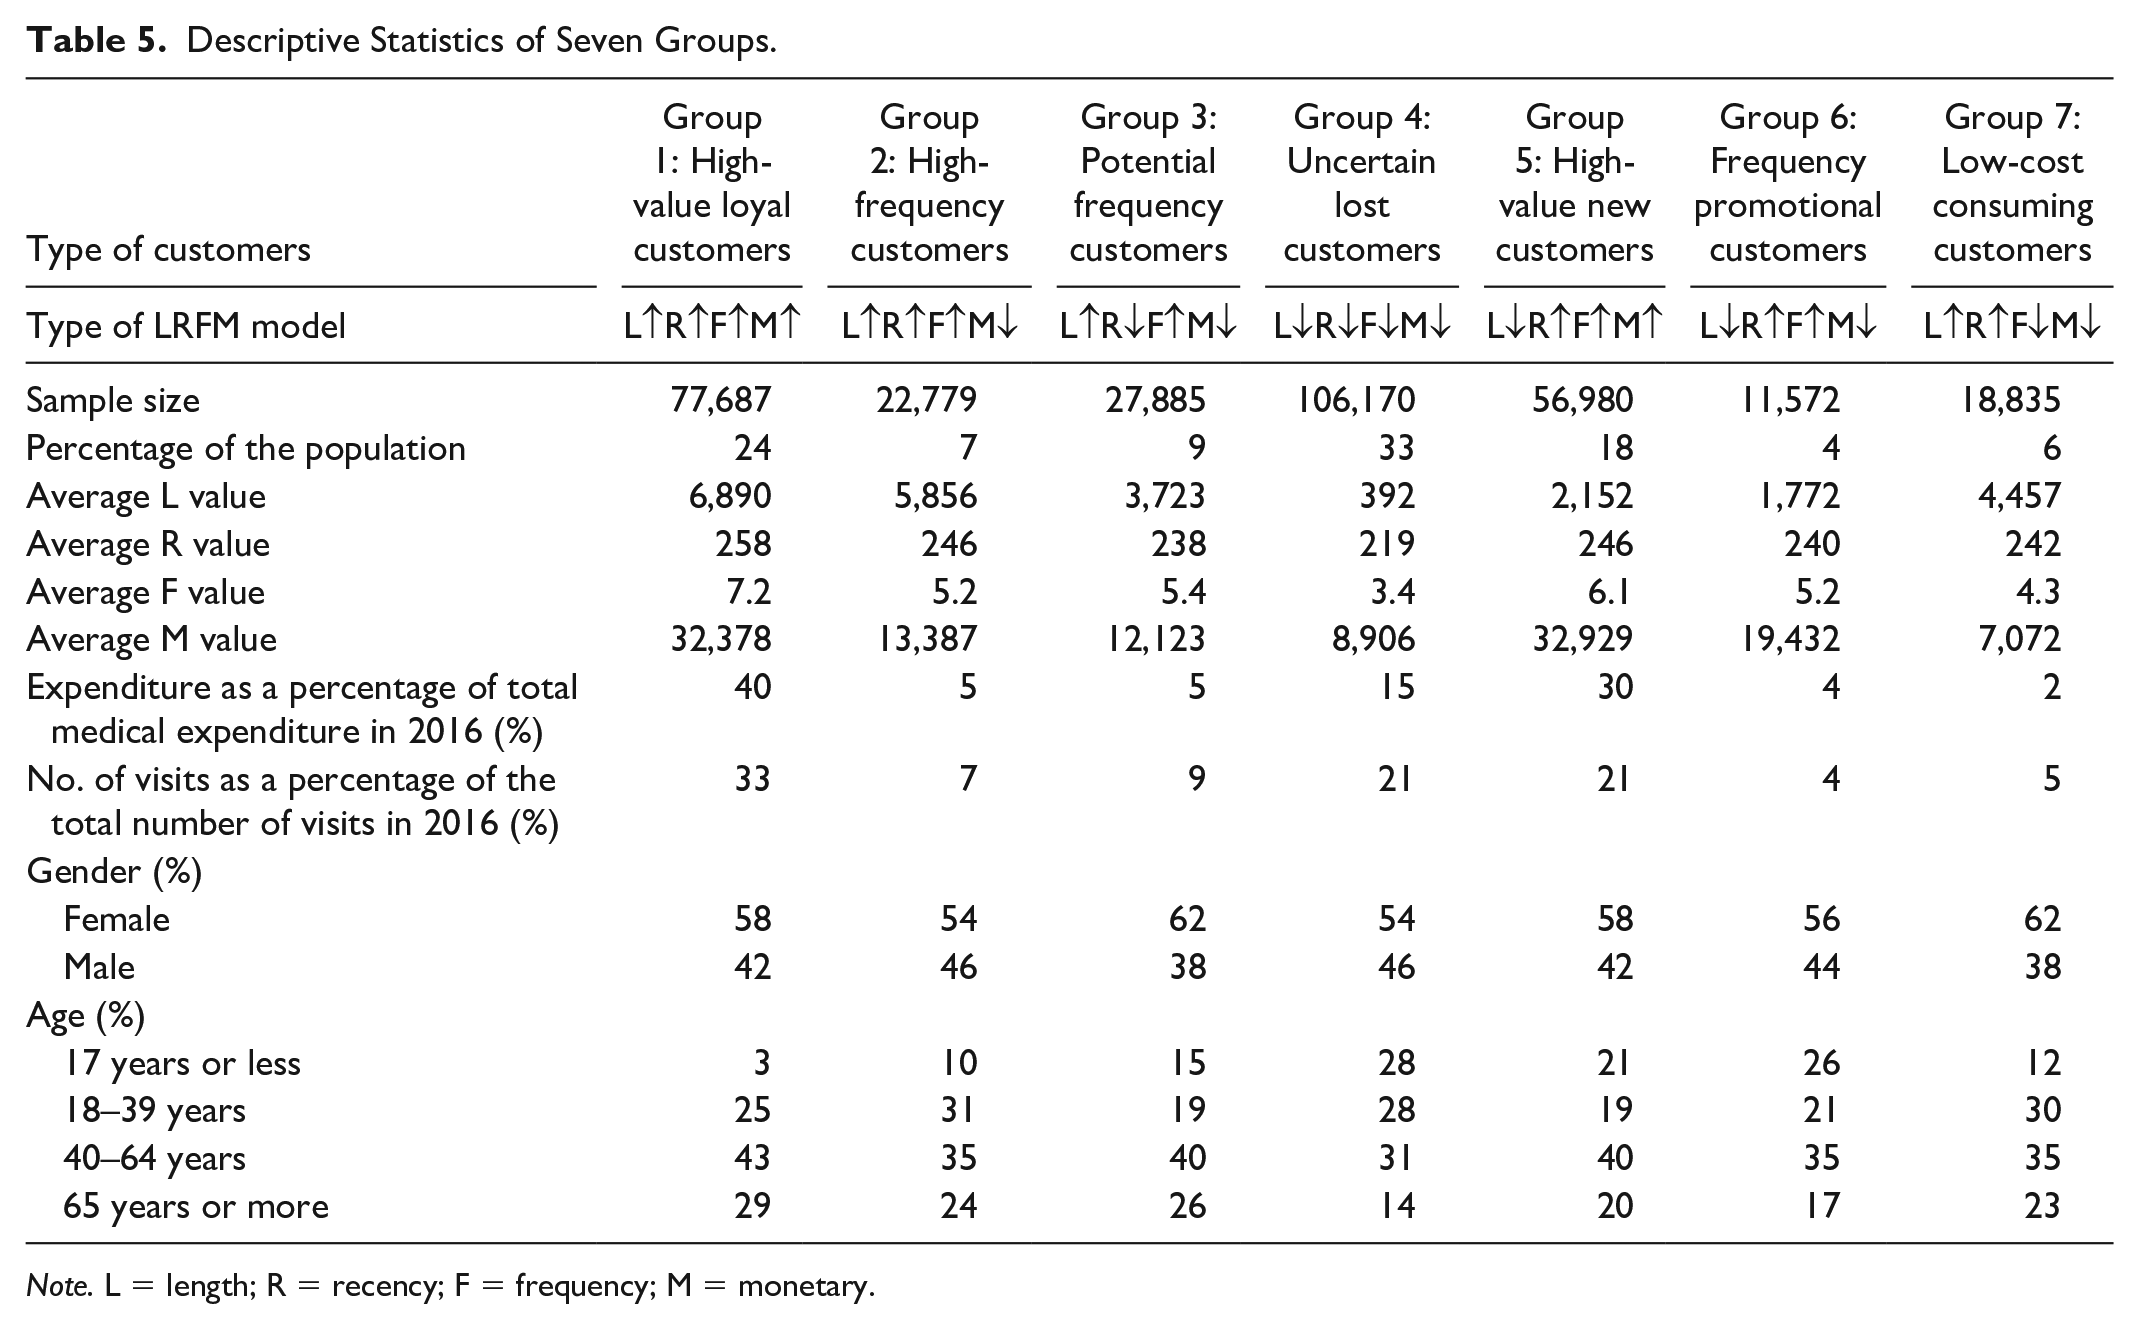
Note. L = length; R = recency; F = frequency; M = monetary.
Top 5 Lists of Clinic Visits of Seven Groups.

Core customers include high-value loyal customers and high-frequency customers. High-value loyal customers (Group 1) have a number of 77,687 patients accounting for 24% of the total population. The average L, R, F, and M values are 6,890, 258, 7.2, and 32,378, respectively, and all of the values are greater than the grand averages. Specifically, the expenditure and the number of visits in 2016 account for 40% of the total medical expenditure and 33% of the total number of visits, respectively, as shown in Table 5. Patients with high medical expenses typically indicate that they are critically ill patients who need long-term treatment in Division of Hematology—Oncology (cancer outpatient chemotherapy) and Division of Nephrology (hemodialysis) with 14.7% and 9.0%, respectively. The major characteristics of patients are as follows: Female patients are the majority (58%). Seventy-two percent of outpatients are 40 years old or more. The major clinic visits in terms of medical expenditure are from Division of Hematology—Oncology with 14.7% and Division of Nephrology with 9.0%. In contrast, the major clinic visits in terms of frequency are from Division of Endocrinology & Metabolism, Division of Cardiovascular Medicine, and Department of Neurology with 8.6%, 8.5%, and 8.3%, respectively.
High-frequency customers (Group 2) have a number of 22,779 patients accounting for 7% of the total outpatients. The average L, R, F, and M values are 5,856, 246, 5.2, and 13,387, where L, R, and F values are greater than the grand averages of L, R, and F values. In contrast, the average M value is less than the grand average M value. Specifically, the expenditure and the number of visits in 2016 account for 5% of the total medical expenditure and 7% of the total number of visits, respectively. The major characteristics of patients are described as follows: Female patients are the majority (54%). Ninety percent of outpatients are 18 years old or more. The major clinic visits in terms of medical expenditure are from Division of Endocrinology & Metabolism, Division of Gastroenterology & Hepatology, Department of Neurology, and Department of Emergency Medicine with 8.6%, 7.3%, 7.1%, and 7.1%, respectively. On the contrary, the major clinic visits in terms of frequency are from Department of Neurology, Division of Endocrinology & Metabolism, Division of Cardiovascular Medicine, and Division of Gastroenterology & Hepatology with 9.0%, 8.6%, 7.7%, and 6.3%, respectively.
The third type of the customers is potential frequency customers (Group 3) belonging to potential customers. There are 27,885 patients in this group, that is, 9% of the total outpatients. The average L, R, F, and M values are 3,723, 238, 5.4, and 12,123, where L and F values are greater than the grand averages of L and F values. On the contrary, R and M values are less than the grand averages of R and M values. Moreover, the expenditure and the number of visits in 2016 account for 5% of the total medical expenditure and 9% of the total number of visits, respectively. The major characteristics of patients are described as follows: Female patients are the majority (62%). The majority of outpatients (40%) are in 40 to 64 years age group. The major clinic visits in terms of medical expenditure are from Division of Endocrinology & Metabolism, Division of Cardiovascular Medicine, Department of Neurology, and Division of Gastroenterology & Hepatology with 8.6%, 7.4%, 7.2%, and 7.1%, respectively. On the contrary, the major clinic visits in terms of frequency are from Division of Cardiovascular Medicine, Department of Neurology, and Division of Endocrinology & Metabolism with 9.0%, 8.3%, and 8.1%, respectively.
The fourth type of customers is uncertain lost customers (Group 4) who belong to lost customers. There are 106,170 patients in this group accounting for 33% of the total outpatients. The average L, R, F, and M values are 392, 219, 3.4, and 8,906, where all of these four values are less than the grand averages. The expenditure and the number of visits in 2016 account for 15% of the total medical expenditure and 21% of the total number of visits, respectively. The patients in this group can be described as follows. Female patients are the majority (54%). The majority of outpatients (86%) are less than 65 years old. The major clinic visits in terms of medical expenditure are from Department of Ophthalmology with 14.6%, Department of Obstetrics & Gynecology with 7.5%, and Department of Emergency Medicine with 7.2%. In contrast, the major clinic visits in terms of frequency are from Department of Obstetrics & Gynecology with 6.6%, Department of Ophthalmology with 6.2%, and Division of Neonatology with 6.0%.
Two types of customers are new customers, namely, high-value new customers and frequency promotional customers. For high-value new customers (Group 5), there are 56,980 patients, that is, 18% of the total outpatients. The average L, R, F, and M values are 2,152, 246, 6.1, and 32,929, where R, F, and M values are greater than the grand averages. The expenditure and the number of visits in 2016 account for 30% of the total medical expenditure and 21% of the total number of visits, respectively. The patients in this group have the following characteristics: Female patients are the majority (58%). The majority of outpatients (60%) are 40 years old and above. The major clinic visits in terms of medical expenditure are from Division of Hematology—Oncology with 13.9%, Division of General Surgery with 10.6%, Department of Radiation Oncology with 8.2%, Division of Nephrology with 7.3%, and Division of Chest Medicine with 6.7%. On the contrary, the major clinic visits in terms of frequency are from Division of Endocrinology & Metabolism, Department of Neurology, Division of Cardiovascular Medicine, and Division of Gastroenterology & Hepatology with 6.4%, 6.3%, 6.2%, and 5.8%, respectively.
There are 11,572 patients accounting for 4% of the total outpatients belonging to frequency promotional customers (Group 6). The average L, R, F, and M values are 1,772, 240, 5.2, and 19,432, where R and F values are greater than the grand averages. The expenditure and the number of visits in 2016 account for 4% of the total medical expenditure and 4% of the total number of visits, respectively. The major characteristics of patients are as follows: Female patients are the majority (56%). The majority of outpatients (35%) are 40 to 64 years old. The major clinic visits in terms of medical expenditure are from Division of General Surgery with 10.0% and Department of Ophthalmology with 7.6%. In contrast, the major clinic visits in terms of frequency are from Division of Endocrinology & Metabolism, Department of Obstetrics & Gynecology, Department of Neurology, Division of Gastroenterology & Hepatology, and Department of Ophthalmology with 5.9%, 5.6%, 5.4%, 5.3%, and 5.3%, respectively.
Low-cost consuming customers (Group 7), one of a kind of resource-consuming customers, have a number of 18,835 outpatients accounting for 6% of the total outpatients. The average L, R, F, and M values are 4,457, 242, 4.3, and 7,072, where L and R values are greater than the grand averages. The expenditure and the number of visits in 2016 account for 2% of the total medical expenditure and 5% of the total number of visits, respectively. The patients in this group can be depicted as follows: More than three fifths of the patients are female. The majority of outpatients (65%) are 18 to 64 years old. The major clinic visits in terms of medical expenditure are from Division of Cardiovascular Medicine with 7.7%, Division of Endocrinology & Metabolism with 7.6%, Department of Neurology with 7.3%, Department of Emergency Medicine with 6.6%, and Division of Gastroenterology & Hepatology with 6.3%. On the contrary, the major clinic visits in terms of frequency are from Division of Cardiovascular Medicine with 8.4%, Department of Neurology with 7.4%, and Division of Endocrinology & Metabolism with 6.9%.
To check whether the classification of seven groups performs well, chi-square test and one-way analysis of variance (ANOVA) are used. Both gender and age are categorical data such that chi-square test is applied. In contrast to the categorical data, average L value, average R value, average F value, and average M value are continuous data. Therefore, these values are analyzed by ANOVA, and Bonferroni method is used for post hoc analysis. The results depicted in Table 7 show that the p-values of all variables are less than .001, indicating the classification among these seven groups go well. In summary, the classification of outpatients in Table 5 is effective statistically.
Statistical Analyses on Seven Groups.
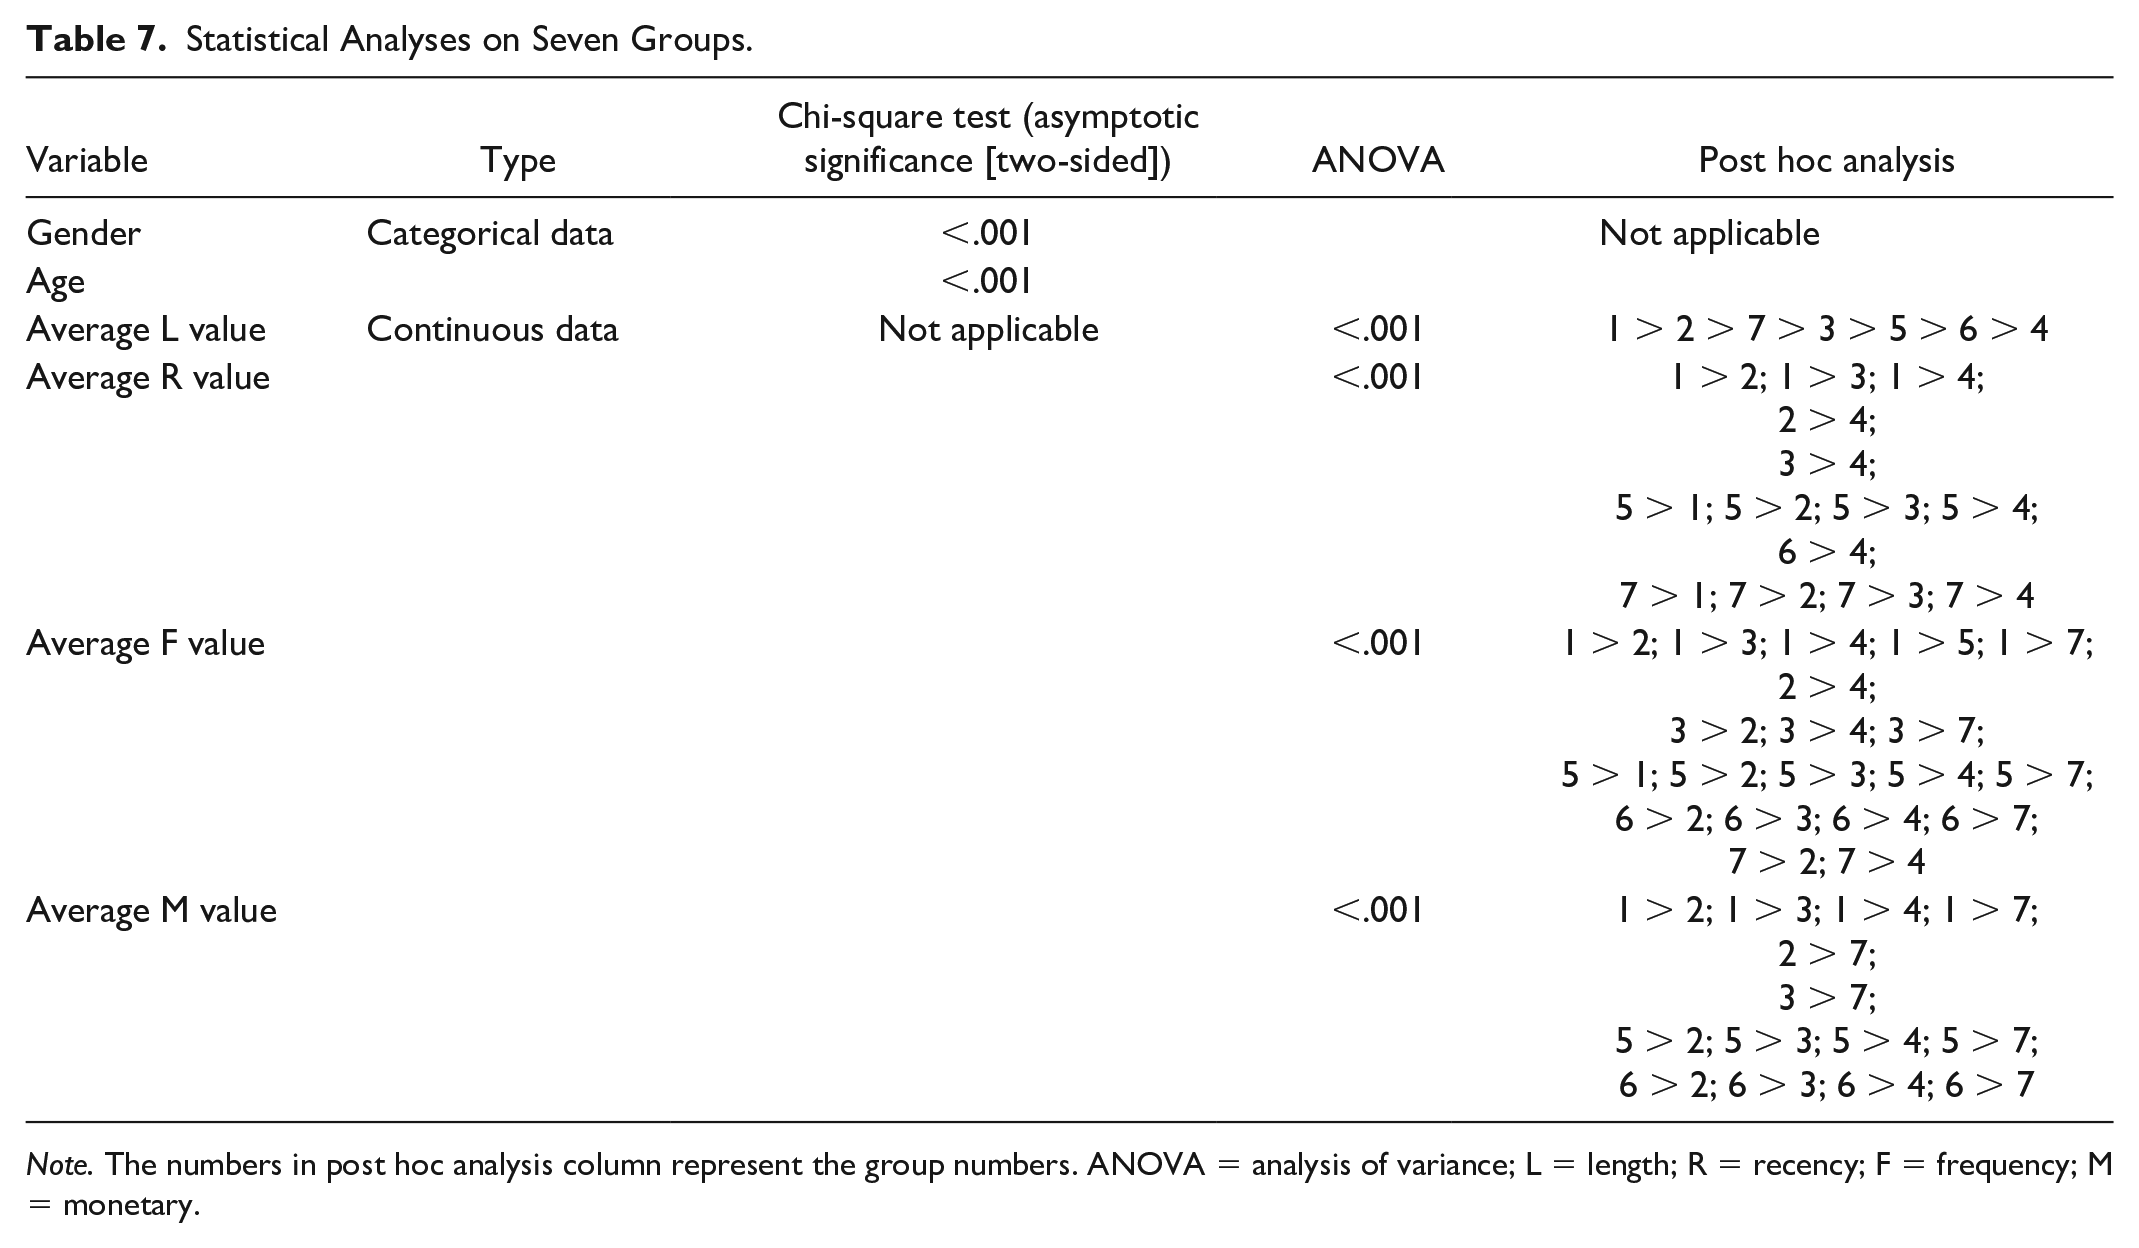
Note. The numbers in post hoc analysis column represent the group numbers. ANOVA = analysis of variance; L = length; R = recency; F = frequency; M = monetary.
Discussion
To provide health care to all residents in Taiwan, the government launched the National Health Insurance program in March 1995, which is a mandatory, single-payer social health insurance system based on the principle that each person should have equal access to health care services by providing universal coverage, health care of acceptable quality, comprehensive benefits, and convenient access to treatment with low premium and health care expenditures (Shieh et al., 2010; Wei et al., 2012; Wu et al., 2014). With the National Health Insurance program, residents have the freedom of choice in health care providers and this phenomenon results in a high-intensity competition among health care providers (Wei et al., 2012; Wu et al., 2014). Under such circumstances, adding values for patients and building a long-term relationship with patients are essential (Porter & Teisberg, 2006). Moreover, patient loyalty is a critical factor beyond patient satisfaction when health care providers are in an intense competition (Fatima et al., 2018; Ravichandran, 2015). Therefore, the application of LRFM model enables health care providers to add values for patients and to establish a long-term relationship with patients.
High-value loyal customers (LRFM) in the core customers group and high-value new customers (RFM) in the new customers group have the following characteristics: The outpatients have higher recency values and their return rates in terms of frequency are high. In addition, their high medical expenditure per visit indicates that they might be critically ill patients who need long-term treatments in the Division of Hematology—Oncology (cancer outpatient chemotherapy) and Division of Nephrology (hemodialysis). Therefore, the hospital should invest more resources to provide regular and active cares to monitor the patients’ conditions and their post-treatment conditions. Besides, more relevant medical knowledge consultations and service needs should be provided to relentlessly care the patients to maintain the loyalty and long-term relationships between the patients and the hospital. Practically, it is recommended that such patient groups can be included in the disease case management system such that the case management team can actively track and care for the patients’ medical treatments through the disease case management system or invite the patients to join the patient group of the similar disease category. Moreover, providing patients psychological comfort and professional medical knowledge through patients’ exchange activities organized by the hospital is a means of establishing a long-term close relationship between high-value loyal patients and the hospital.
High-frequency customers (LRF) in the core customers group have more recent visits, high return rates, to and long-term relationships with the hospital. These patients have chronic diseases requiring long-term treatments from Department of Neurology, Division of Endocrinology & Metabolism, Division of Cardiovascular Medicine, and Division of Gastroenterology & Hepatology. The patients whose ages are 40 years and above are slightly less than 60% of high-frequency customers, and 98% of the patients live in Changhua County where the case hospital is located. These patients return to the hospital regularly following the physicians’ instructions and have long-term relationships with the hospital. Although the medical expenditure per visit is below the grand average, the patients choose this case hospital as a higher priority when there is an emergency or a serious illness that requires medical treatments. In practice, these patients are loyal to this hospital in terms of the L value. Therefore, it is recommended that the hospital can invite patients to join the remote care services that enable nurses in the remote care center to regularly collect the patients’ physiological information at home through the internet and to provide care and healthy diet guidance to the patients’ physiological conditions. Moreover, the physiological data would be able to assist physicians in precise treatments and improve and control the patients’ physiological conditions effectively.
Frequency promotional customers (RF) in the new customers group have more recent visits and high return rates to the hospital. However, the patients who do not have long-term relationships with the case hospital can be viewed as a potential customers group. The hospital can improve the mobile medical APP functions such as satisfaction survey, follow-up reminder, and medication reminder to care for the patients’ conditions and satisfaction after the treatment to figure out the patients’ needs and provide suitable medical treatments. Moreover, it is recommended to work with medical consulting services to enhance patient satisfaction after medical treatments and establish long-term relationships with patients.
Potential frequency customers (LF) in the potential customers group have long-term relationships with the hospital with high return rates. They have not been to the hospital for a long time for the chronic disease treatments in cardiovascular medicine, neurology, endocrinology and metabolism, and gastroenterology and hepatobiliary medicine. It is recommended that the hospital should use resources such as questionnaires or telephone interviews to document the reasons why the patients fail to come back for medical treatments. In doing so, the hospital can understand the patients’ needs and provide appropriate service processes to enhance patient satisfaction after medical treatments.
Low-cost consuming customers (LR) in the resource-consuming customers group have long-term relationships with the hospital with more recent visits but have lower return rates. It is recommended that the hospital can employ its resources in patient condition analyses and patient satisfaction questionnaires to further identify the needs of this patient group and then give them the services they need to make such patients to be loyal to the hospital.
Uncertain lost customers in the lost customers group have not been to the hospital recently and the relationships between the patients and the hospital are short. In addition, the frequency and medical expenditure are relatively low. The case hospital is a medical center responsible for emergency and critical care in the central Taiwan area. Thus, it is recommended that the hospital can further analyze the reasons why the patients fail to come back such as the consultation of the second medical opinion or unwillingness to come back to the hospital due to the services that do not meet the patients’ needs.
Conclusion
Health care organizations need to emphasize on the value for patients rather than the minimization of the short-term costs through managing a patient’s personal health, provision of a health plan, acting responsibility, and building a long-term relationship with patients (Porter & Teisberg, 2006). By putting patients first, creating choices for patients, and making outcomes transparent, patient loyalty, which is beyond patient satisfaction, can be realized when health care providers are in an intense competition (Dafny & Lee, 2016; Ravichandran, 2015). This study employs LRFM model and cluster analysis to categorize 321,908 outpatients from a medical center into 12 groups in terms of their length, recency, frequency, and monetary. These 12 clusters are further categorized into five different types of customer groups based on the philosophy proposed by Chang and Tsay (2004). In addition to five types of categories, these outpatients are grouped into seven types of customers. The similarities and differences among these seven types are analyzed and compared. The managerial implications for each type of outpatients are depicted, which enable the hospital management to develop different strategies to provide the best care services, enhance the hospital’s performance, lower the cost, and, ultimately, set up a long-term relationship with patients. Although patient satisfaction and loyalty are a means of measure outcomes, further work is recommended to measure other outcomes such as patient recovery and disease treatment status.
Footnotes
Declaration of Conflicting Interests
The author(s) declared no potential conflicts of interest with respect to the research, authorship, and/or publication of this article.
Funding
The author(s) received no financial support for the research, authorship, and/or publication of this article.