
Abstract
The goal of the current study was to explore the visual representation of #ShoutYourAbortion hashtag movement on Instagram. The photos’ content and embedded texts in the photos were examined. And the photos were clustered using k-means clustering algorithm, and the resulting clustered were compared using the same criteria above. Photo features which shows the content- and pixel-level characteristics were extracted and used for comparison between clusters. The photo features were also used to examine their relationships with the public’s responses. It was found that text was the main type of content, and the texts presented in photos were mainly about stories told in first person point of view as a woman. The photos were grouped into two clusters, which differed in terms of content and photo features. And the public’s responses were found to be related to photo features. The results are expected to contribute to the understanding of hashtag movements via photos and making photos in hashtag movements more appealing to the public.
Social networking services (SNSs) have been acknowledged as the key channel for protests and social movements (Markham, 2016). It is mainly due to the social media functions that make it possible for users to communicate with others in an easier, faster, and more diverse way. Hashtag is one of those functions. It is basically a combination of the symbol “#” and brief keywords or abbreviations, and it is known to be first introduced on Twitter to enable users to search tweets of interest and follow conversations more easily (Bruns & Stieglitz, 2013). For social movements, it is used as a discursive marker which explicitly expresses authors’ stance on an issue; a post with a particular hashtag is generally understood as an approval or disapproval of the author for a stance (Bruns & Stieglitz, 2013).
Hashtag movement, or hashtag activism, refers to actively utilizing the hashtag function of SNSs for social change (Dadas, 2018). Since it can facilitate spreading of awareness and information on a social issue, hashtag can be a useful tool for activists who struggle for social changes (Crandall & Cunningham, 2016). It is also useful for ordinary people in that they can easily share their stories, which can be both personal and political, with other people who have similar viewpoints and express support for social movements. While it is criticized for obscuring rich context of social movements into short phrases (Dadas, 2018), it is widely used and acknowledged as an important way of social movements (Anderson et al., 2018). On these accounts, there have been many scholarly works not only about hashtag in general (Filieri et al., 2021) but also about hashtag movements which focused on various social issues (Bunting & Stamatel, 2019; Sinpeng, 2021; Wang & Zhou, 2021; Zoller & Casteel, 2021).
Despite these works, little attention has been paid to how hashtag movements are visually represented, and the role of visual materials in hashtag movements remains unclear. Text is still the most dominant form in SNSs, but posts in visual form including photos have been gaining increasing attention from users. Existing SNSs such as Twitter and Facebook are providing photo-uploading functions, and photo-centric SNSs such as Instagram have become popular (Jurgenson, 2019). This changing media environment necessitates scholarly attention to how hashtag movements are visually represented in photo-centric SNSs, but this has not been addressed enough. Also, few studies that analyzed photo data about hashtag movements (Ichau et al., 2019; Stefanone et al., 2015) were confined, in terms of research method, to analysis by human coders. Thus, the size of dataset was relatively small and various computational methods were not actively used for analysis. Additionally, how the characteristics of photos are related to the public’s responses has received scant attention, while it is a central concern for hashtag movements to draw attention and receive positive responses from the public.
To fill these gaps, the goal of this research is to explore the visual representation of hashtag movement and the public’s responses on Instagram. The #ShoutYourAbortion movement was taken as an example. It is a case of abortion debates, which has been one of the central topics in hashtag movements. While #ShoutYourAbortion movement was investigated in terms of its subthemes (Cappellini et al., 2019) and interaction networks among its participants (Ahmed, 2018), its visual representation has not been examined. Thus, little is known about through which visual objects the participants of the movement express their ideas and viewpoints.
Abortion Debates on Social Media and #ShoutYourAbortion
As other controversial social issues, abortion has been a major topic discussed on SNSs. It can be questioned whether debates on SNSs can represent the real-world discussions, because there can be biases concerning the participants of the debates. However, a study on an abortion debate on Twitter reported that, while Twitter has strong biases in population representation, the characteristics of Twitter discussion matched the ones from national surveys (Graells-Garrido et al., 2019). Thus, investigating the abortion debates on SNSs can provide an indication to understand the discussion at large in the society. In this respect, previous studies have examined the linguistic and discursive characteristics of abortion debates on SNSs (Molek-Kozakowska & Wanke, 2019; Sharma et al., 2017), and another body of literature has focused on the linkage pattern among participants of debates (Cinelli et al., 2021; Lycarião & Dos Santos, 2017).
As a case of abortion movements on SNSs, #ShoutYourAbortion has gained attention in the literature. The movement began in 2015 by reproductive rights activists Amelia Bonow, who shared on Facebook her abortion experience in Planned Parenthood after the U.S. House of Representatives had decided to stop funding the institution (Kosenko et al., 2019; Whaley & Brandt, 2018). And Lindy West, one of Bonow’s friends, attached #ShoutYourAbortion hashtag in her screenshot of the original post, and the hashtag was shared with her thousands of Twitter followers (Kosenko et al., 2019). After that, #ShoutYourAbortion became the symbol of de-stigmatization of abortion narratives and served as a platform for women’s honest and raw voices concerning their experiences that resist against mainstream narratives (Whaley & Brandt, 2018). Concerning #ShoutYourAbortion, previous studies examined which themes emerged on Twitter (Cappellini et al., 2019), how users were connected on Twitter (Ahmed, 2018), and how the hashtag was used to condemn the original purpose (Kosenko et al., 2019).
However, it has not been actively investigated how abortion debates in general or #ShoutYourAbortion in particular was visually represented. SNS photos can have much implication for public health in general (Fung et al., 2020), and this is also the case concerning abortion debates. Myles (2019) gave an example of “rogue Anne”; it is a visual image of a girl, and it was used for pro-abortion activities in Prince Edward Island, Canada, where abortion services were offered since their decriminalization in 1988. Sutton and Vacarezza (2020) analyzed the photos in pro-abortion activist organizations’ websites and blogs. Duggan (2022) explored the possibility how TikTok can be used to teach about abortion. Despite these studies, computational analysis of photos on abortion movements is still in deficit, and this study attempts to fill this gap by examining the visual representation of #ShoutYourAbortion movement on Instagram. One of the major elements of visual representation is content, so the content of the photos is examined. Also, text has been reported one of the dominant type of photos on Instagram (Hu et al., 2014), so the words presented in the photos are examined. The below research questions are addressed:
RQ1. What are visually represented in the Instagram photos with #ShoutYourAbortion hashtag?
(a) What is the content of the photos?
(b) Which words are presented in the photos?
Analyzing SNS Posts by Clustering Methods
Clustering is an unsupervised learning technique which assigns similar units in a dataset into the same group (Filho et al., 2014). The resulting clusters can show latent structures or patterns in the dataset, so it has been used to analyze SNS data in the literature (Driscoll & Thorson, 2015; Mostafa & Nebot, 2020). Particularly, clustering methods have been employed to examine SNS photos. For example, Kaneko and Yanai (2016) clustered geo-tagged Twitter photos which were related to particular events. They used local speeded-up robust features (SURFs) and red, green, and blue (RGB) histograms as the features, and the photos in the resulting clusters showed how the events were visually represented. Huang et al. (2021) examined the image of the Tri-City region in Poland by clustering the geotagged photos on Instagram and Twitter. They used the global positioning system (GPS) location as features, and the resulting clusters were found to correspond to one of the elements of city image suggested by Kevin Lynch, a landmark theorist. Ketonen and Malik (2020) clustered the Instagram photos with #vaping hashtag to investigate their visual representation. Using the features extracted from deep neural networks (DNNs), they identified the subthemes including e-liquid, e-cigarette, product package, and persons.
In line with these studies, this study applies a clustering method to investigate the visual representation in the Instagram photos with #ShoutYourAbortion hashtag. The content and the presented words are examined in each cluster as done in the whole corpus. Additionally, the content- and pixel-level characteristics are compared among clusters, because visual representation can be examined in terms of which objects are presented and which attributes the pixels have. The following research questions are addressed:
RQ2. How are the Instagram photos with #ShoutYourAbortion hashtag clustered?
(a) How do the clusters differ in terms of their content?
(b) How do the clusters differ in terms of the words presented in the photos?
(c) How do the clusters differ with regard to their characteristics at content- and pixel-levels?
Visual Attributes of Social Media Photos and the Public’s Responses
It has been a crucial topic which type of online photos draw more attention from users. The popularity of online photos has been mainly investigated concerning engagement (Park et al., 2015), which has been usually measured by number of likes and/or comments from users. A group of studies has employed a random sample of photos, which was not confined to a particular domain or topic, to examine which visual attributes of photos induced more engagement, and it was found that having human faces (Bakhshi et al., 2014) and using red, purple, and pink (Bakhshi & Gilbert, 2015) had influences on the engagement of photos on Instagram and Pinterest. Another group of studies has focused on a particular domain or topic; SNS photos about politics (Muñoz & Towner, 2017), online social movements (Casas & Williams, 2019; Kim et al., 2020), and public health (Kim & Kim, 2020) were investigated with regard to the relationships between the visual attributes of the photos and engagement. Additionally, engagement was the key concern in previous studies which analyzed SNS photos about food (Peng & Jemmott, 2018), face orientation (Lindell, 2019), brand (Li & Xie, 2020), and tourism (Aramendia-Muneta et al., 2021).
Based on these studies, this research explores how the features of #ShoutYourAbortion Instagram photos are related to the responses from the public. In addition to engagement, this study employs sentiment of the comments as another metric of the public’s response. Previous studies have reported that the public’s responses to Instagram photos were revealed differently in engagement and comment sentiment, which thus can be considered as distinct domains of public responses (Kim & Kim, 2020; Kim et al., 2020). Correlational analyses between the photo features and the public’s responses are conducted, and predictive analyses are performed to predict the public’s responses from the photo features. The following research questions are addressed:
RQ3. How the features of Instagram photos with #ShoutYourAbortion hashtags are related to the public’s responses?
(a) How are the photo features correlated with the public’s responses?
(b) How accurate are the predictions made from the photo features on the public’s responses?
Method
Research Sample
This study uses the public Instagram posts with #ShoutYourAbortion hashtag for the research sample. Data were gathered by Instagram-scraper (https://github.com/arc298/instagram-scraper) on October 19, 2018. In addition to photos, data concerning likes and comments were downloaded. As a result, 11,176 photos, 122,150 comments, and 1,875,328 likes in total were used for analysis.
Analyzing the Content of Photos
Frequency by content category
The overall content of photos was determined by the frequency of photos which belongs to each category. Online artificial intelligence (AI) services, which have been used to analyze photo content in literature (Bosch et al., 2018), were used for this purpose. This study utilized Computer Vision API (application programing interface) in Microsoft Azure Cognitive Services (CV API; https://azure.microsoft.com/services/cognitive-services/computer-vision/; Price et al., 2021); the pretrained AI categorized the photo into 1 of the 15 predetermined classes. The classes were abstract, animal, building, dark, drink, food, indoor, others, outdoor, people, plant, object, sky, text, and transportation.
Confidence scores of content tags
The content of a photo was also assessed by content tags and accompanying confidence scores (Muralidhara & Paul, 2018) determined by CV API. Unlike the content category where only a single class is assigned to a photo, multiple content tags can be used to describe the content of a given photo. The pretrained AI returned tags which indicate the content of the photo and confidence score for each tag; for example, person (0.9945455), laptop (0.9635144), computer (0.9579097), clothing (0.9370073), indoor (0.9179773), furniture (0.906451), table (0.742828846), and people (0.720105648). The higher confidence score of a content tag means that the content of a given photo is more about the tag. And the confidence scores of each tag were averaged to show the overall content of the photo corpus.
Detecting texts in photos
The Optical Character Recognition (OCR) function provided in CV API was employed to detect texts presented in photos. After obtaining detected words from the API, following preprocessing was performed; transforming into lowercase, removing punctuation marks, removing stop words (and, but, the, to, of, for, a, an, in, with, is, are, am, was, be, can, or, about, from, •, et, on, at, by, not, &, 0, 1, 2, 3, v, if, up, this, that, as, -, it, it’s, o, c, after, no, than, may, only), and removing Uniform Resource Locators (URLs). Then, the frequent words were observed to analyze the content of the photo corpus in terms of their presented texts.
Clustering Photos
The photos in the research sample were grouped into clusters by k-means algorithm (Ahmed et al., 2020). Each photo was transformed into a vector with 2,048 dimensions using the penultimate layer of ResNet50 model (He et al., 2016) which was trained on ImageNet dataset (Deng et al., 2009). The transformation was conducted using img2vec-keras library (https://github.com/jaredwinick/img2vec-keras). And the optimal number of clusters was sought using elbow method and silhouette score method (Yuan & Yang, 2019). In Figure 1, we can see the elbow (a) and the highest silhouette score (b) when the number of clusters is two, which can be considered as the optimal number of clusters. Thus, the photos were grouped into two clusters (5,375 photos in cluster 1 and 5,801 photos in cluster 2).
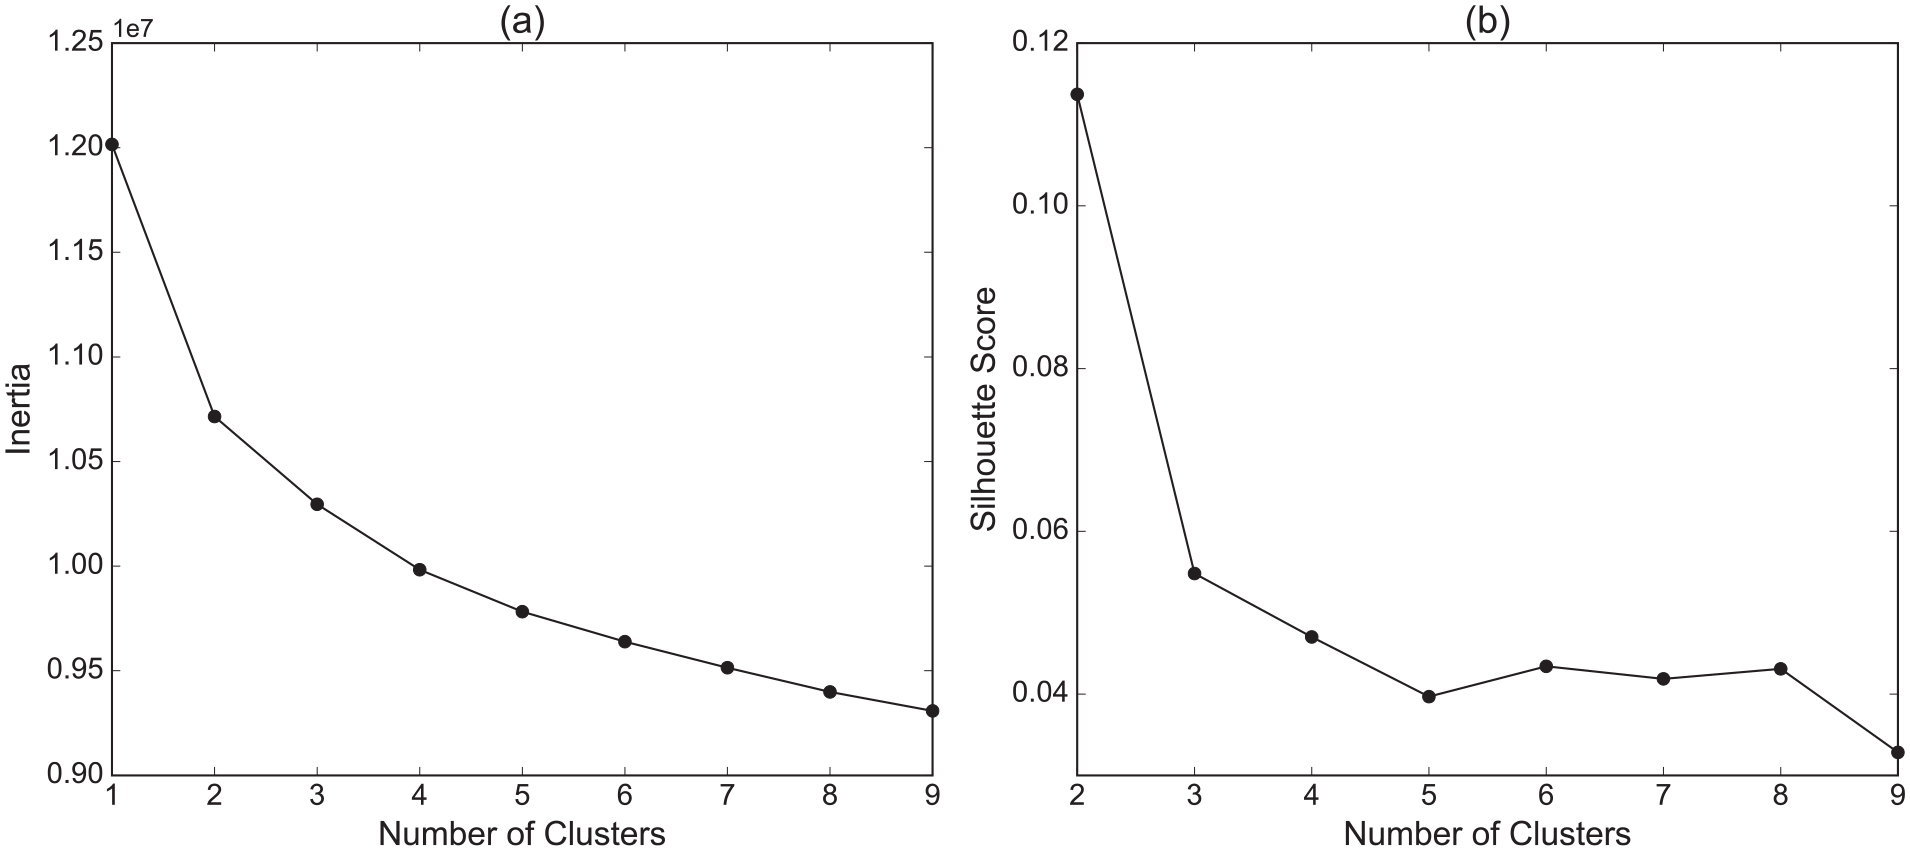
(a) Finding the optimal number of clusters using the elbow method and (b) the silhouette score method.
Content- and Pixel-Level Features of Instagram Photos
Features which shows the characteristics of a given photo were extracted at content and pixel levels. The content-level features include facial and OCR features, and the pixel-level features include pixel color and visual features. These features were utilized to compare the characteristics of photos among clusters. And they were examined in terms of their relationships with the public’s responses to the photos.
Facial features
Features regarding human faces in a photo were extracted. Facial features have been used to analyze visual materials in literature (Peng, 2018). This study employed Face API in Microsoft Azure Cognitive Services (https://azure.microsoft.com/services/cognitive-services/face/) for this purpose. For a given photo, human faces detected by the pretrained AI were returned with additional information about the faces including size, age, gender, and expressed emotions. Based on the information, the following features were used for analysis (Kim et al., 2020). First, number of faces was the number of faces appeared in a photo, closeup was the proportion of the biggest face in a photo and face ratio was the proportion of the sum of all faces in a photo. And age was calculated by averaging the ages of all faces, and gender was calculated by counting the number of female faces in a photo. The classes of expressed emotions were anger, contempt, disgust, fear, happiness, sadness, surprise, and neutral, and the sum of the eight emotions becomes one for a given face. Each emotion class on all faces in a photo was averaged respectively.
OCR feature
The number of words feature was calculated by counting the number of English words detected by OCR of CV API from a photo.
Pixel color features
Features about color information in pixels were extracted. Color in digital photos can be expressed by diverse color space models, whose representative examples are RGB and HSV (hue, saturation, and value). Using custom Python script and OpenCV library (https://opencv.org), following features were extracted from pixels in relevant formats.
First, the red, green, and blue in RGB and the saturation and value (i.e., lightness) in HSV were respectively averaged across all pixels in a photo and their variances were also obtained. As a results, the following features were extracted; red mean, red variance, green mean, green variance, blue mean, blue variance, saturation mean, saturation variance, value mean, and value variance. Concerning hue which is nominal, the shares of key colors instead of mean and variance were used. The total range of hue, which is 0 to 179 in OpenCV, was divided so that each interval corresponds to each key color: the divided interval was [7, 23, 35, 90, 136, 169] and corresponding key colors were red, orange, yellow, green, blue, and violet. Then, the share of pixels whose hue lie in each key color interval was determined (Kim & Kim, 2018). The extracted features were red share, orange share, yellow share, green share, blue share, and violet share. And the combined share of red, orange, and yellow was the share of warm colors and the combined share of green, blue, and violet was the share of cold colors. Additionally, the number of local maximums in hue histogram which was smoothed by kernel density estimation was counted to be the number of hue peaks (Kim & Kim, 2018); this metric is known to denote how monotonous or mussy a given photo is (Mao et al., 2003).
Visual features
Visual features were regarding visual attractiveness of a given photo. Features suggested by San Pedro and Siersdorfer (2009) and used in the literature (Messina et al., 2019; Yazdavar et al., 2020) were extracted. First, brightness stands for how bright a photo is, and it was calculated by the average of luminance (Y values in the YUV color space) in the pixels of the photo. Colorfulness designates how colorful a photo is, and it was calculated using the formula in the work of Hasler and Süsstrunk (2003). Naturalness denotes the degree of a photo’s correspondence to the human perception of reality, and it was calculated using the formula in the work of Huang et al. (2006). Contrast is about how local luminance variates in relation to the surrounding luminance, and it was calculated by the standard deviation of luminance in pixels divided by the number of pixels. RGB contrast was the extension of contrast into the RGB color space in three dimension. Sharpness stands for how clear and detailed a given photo is, and it was calculated using the formula in the work of Savakis et al. (2000). Additionally, two visual features concerning color were extracted. Color diversity denotes the degree of the colors’ being diverse in a photo, and fractal dimension, which has been used as a metric of color diversity (Kim et al., 2014; Kim & Kim, 2019), was employed as a measure using the box-counting method (Feng et al., 1996). And color harmony stands for the degree of harmony among the dominant colors in a photo, and it was calculated using the geometric formulations which the dominant colors generate on the color wheel. The hue histogram was generated and smoothed by kernel density estimation, and the hues where the top two highest peaks were located were identified as the dominant colors from the smoothed histogram. Color harmony was calculated by the internal angle between the dominant colors on the color wheel (Kim & Kim, 2019). Finally, pleasure, arousal, and dominance, which designate the affections from a given photo, were calculated using the formula in the work of Valdez and Mehrabian (1994).
The Public’s Responses
Engagement
Engagement, as the first measure of the public’s response to a given photo, was calculated by the sum of number of likes and comments, as in previous research (Park et al., 2015).
Comment sentiment
Comment sentiment, as the second measure of the public’s response to each photo, was measured by the average sentiment in the comments made to the photo. Sentiment of each comment was analyzed using Flair module (https://github.com/flairNLP/flair) used in Python language. The pretrained model classified the sentiment of each comment with confidence score between −1 and 1; the former represents most negative and the latter most positive.
Results
Visual Representation of #ShoutYourAbortion Instagram Photos (RQ1)
The content of photos (RQ1a)
Figure 2(a) shows that the photos in text category took the greatest share which was more than the half of the research sample. And Figure 2(b) shows that text was the content tag with the highest confidence score, and screenshot which is also a way of presenting texts has the second highest score. These results suggest that presenting texts on photos was the major way of delivering messages in #ShoutYourAbortion hashtag movement.

(a) Frequency (and share) of Instagram photos by content category and (b) content tags with the highest mean confidence scores.
Frequent words presented in photos (RQ1b)
The number of photos containing words was 8,680, and a total of 312,039 words were analyzed. The top 50 frequent words are presented in Figure 3. Words like “i” (my, me, we, our), “abortion” (abortions), “you” (your), “planned,” “parenthood,” “they” (their, them), “life,” “woman,” “child” (children), “right,” and “choice” appeared frequently in the Instagram photos with #ShoutYourAbortion hashtag. This result indicates that the texts presented in photos were mainly about stories told in first person point of view as a woman, and planned parenthood seemed to be one of the main objects discussed in the stories. Also, the words which may have contrasting meanings in the context of #ShoutYourAbortion were observed together: for example, “life” and “child” (children) versus “right” and “choice.” This observation indicates the possibility of “hashtag hijacking” (Ahmed, 2018; Kosenko et al., 2019) at least partially: #ShoutYourAbortion hashtag might be attached to the posts with anti-abortion stances as well as pro-abortion ones.

Top 50 frequent words presented in the Instagram photos with #ShoutYourAbortion hashtag.
Comparison Between Clusters (RQ2)
Comparison in terms of the content (RQ2a)
The upper row of Figure 4 shows that the first cluster comprised photos which contain texts on them. The photos in text category took the largest share which was more than 80%, and the average confidence score of text tag was almost 1. The texts seemed to appear on screenshots, graphics, and posters, which also were the content tags with higher confidence scores than others. In contrast, the lower row of Figure 4 shows that the photos in the second cluster contained photos about people and human faces in addition to the photos about texts. Persons appearing in the photos of the second cluster seemed to wear clothes, smile, and be located in outdoor and indoor, which were the content tags with high confidence scores. Two clusters had in common that text-embedded photos prevailed, but human faces were accompanied with texts in the second cluster.

(a) Frequency (and share) of photos by content category and (b) content tags with the highest mean confidence scores of two detected clusters.
Comparison in terms of the words presented in photos (RQ2b)
The number of photos containing words was 5,271 in cluster 1 and 3,409 in cluster 2, and Figure 5 shows the top 30 frequent words of each cluster. From the figure, we can see that the frequency of detected words was generally larger in the first cluster. And the words that appeared only in each cluster were compared: the words peculiar to the first cluster were “her,” “had,” “will,” “like,” “baby,” and “has,” and the words peculiar to the second cluster were “our,” “debate,” “tell,” “stories,” “normal,” “nor,” and “she.” From the comparison, we can infer that the presented words in the photos of cluster 2 were more about introducing debates or telling one’s stories than the cluster 1.
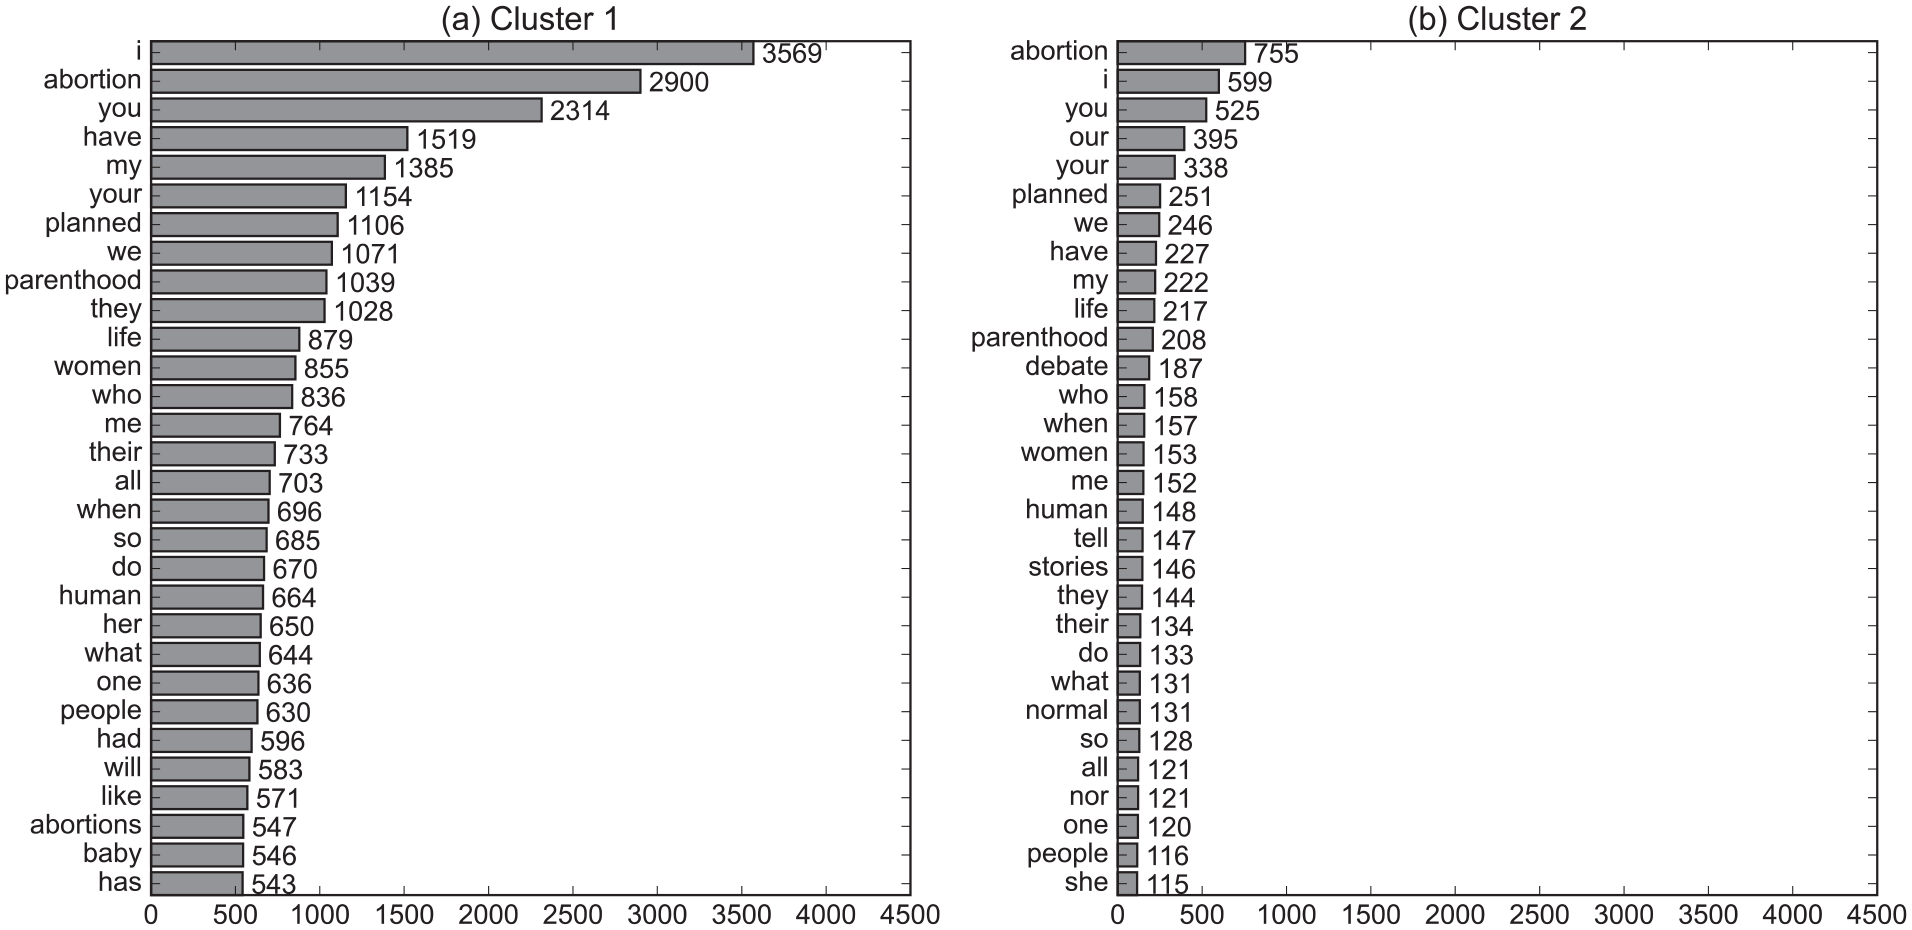
Top 30 frequent words presented in the Instagram photos with #ShoutYourAbortion hashtag in each cluster.
Comparison in terms of the characteristics at content- and pixel-levels (RQ2c)
The comparison of means by cluster for each photo feature is presented in Table 1. It shows that almost all features, except fear, red variance, violet share, contrast, RGB contrast, and color harmony, were different between clusters. For example, photos in cluster 2 contained more and bigger human faces which expressed stronger emotions, and photo in cluster 1 contained more words. And photos in cluster 1 were generally brighter: means of RGB were higher all together, value mean was higher, and brightness was larger in cluster 1. It can be due to the bright background of photos that show text materials. In contrast, photos in cluster 2 were generally more colorful: saturation mean were higher, share of all colors were higher, and colorfulness, color diversity, and naturalness were larger in cluster 2. It can be due to more humans in diverse settings in cluster 2 that would make the photos relatively more colorful than cluster 1.
Mean Comparison of Photo Features Between Clusters.

p < .05.
Relationships Between the Photo Features and the Public’s Responses (RQ3)
Correlational analysis (RQ3a)
Table 2 shows the results of correlational analysis. It indicates that some photo features were significantly correlated with both engagement and comment sentiment. For example, photos with bigger and larger human faces induced more engagement and more positive comments. Photos with more female faces and happier emotion also induced more engagement and more positive comments, and it was also the case in photos with larger share of warm colors. In contrast, photos with more number of words on them induced less engagement and more negative comments.
Correlations Between Photo Features and the Public’s Responses.

p < .05.
Some photo features were associated only with either engagement or comment sentiment. Concerning engagement, photos with more sad emotion had more engagement. And photos whose color were stronger generated less engagement: saturation mean, colorfulness, and color diversity were negatively correlated with engagement. Also, the negative correlations of pleasure, arousal, and dominance suggest that photos with stronger affections induced less engagement. Concerning comment sentiment, photos with more surprising emotion had more negative comments. Comment sentiment was negatively associated with the variances of red, green, blue, saturation, and value, and it was also the case with contrast and RGB contrast: these results indicate that photos with large differences and variations in terms of their pixels induced more negative comments. In contrast, the number of hue peaks and color diversity were positively correlated with comment sentiment.
Predictive analytics (RQ3b)
To see how accurately photo features predict the public’s responses, researchers built and analyzed predictive models. The root mean squared errors (RMSEs) of support vector regression models were calculated using 10-fold cross validation, as shown in Table 3. In order to determine their predictability, the RMSEs were compared with the means (and standard deviations) of engagement and comment sentiment. The average engagement was 179.518 (SD = 323.286), and the average comment sentiment was −0.013 (SD = 0.644). From the comparison, we can conclude that engagement was predicted from photo features with an acceptable level of accuracy because RMSE in engagement was relatively small. In contrast, comment sentiment was not predicted from photo features because RMSE in comment sentiment was relatively large.
Root Mean Squared Errors of Support Vector Regression Models Calculated Using 10-Fold Cross Validation to Predict the Public’s Responses.

Discussion and Conclusion
Hashtag is playing a significant role on SNSs, and hashtag movement became a major form of online movement. This is also the case in SNS photos, and various hashtags are attached to SNS photos as a way of social movement. In this study, Instagram photos with #ShoutYourAbortion hashtag were investigated in terms of what are visually represented in them. Also, the relationships between the photo features and the public’s responses, measured by engagement and comment sentiment, were examined.
Major Findings and Comparison With Previous Studies
First, text was the main type of content in the #ShoutYourAbortion Instagram photos. This finding suggests that, even on Instagram, a photo-centric SNS, key messages of the movement were presented via the texts embedded in photos. This may be because the texts embedded in photos are easier to draw attention; they are usually larger in size and more diverse in style than caption texts accompanied by photos, so text-centric photos have been reported to take the dominant share among general (Hu et al., 2014), organizational (Kim & Kim, 2020), and movement posts (Kim et al., 2020) on Instagram.
However, other results in this study indicate that this text-centric photos were not that effective in terms of the public’s responses: the photos with more embedded texts had lower engagement and less positive comments. While SNS photos were reported to draw more engagement than texts (Aramendia-Muneta et al., 2021; Lee et al., 2017), text-centric photos were found to have negative influences on engagement (Kim & Kim, 2020; Kim et al., 2020). The negative responses to the text-centric photos may be attributed to the discrepancy between texts and photos: they were reported to stimulate different cognitive processes (Gerě & Jaušcvec, 1999) and to be evaluated by SNS users based on different criteria (Huang et al., 2019). Thus, it seems that more efforts should be made in order to diversify the type of photos and make the photos less text-centered which would make the public’s responses more positive. For this aim, the photo features which were reported in this study to have associations with public responses would provide a hint for designing photos. For example, photos with bigger and larger human faces induced more engagement and more positive comments, while photos with stronger colors induced less engagement.
Next, the embedded texts on #ShoutYourAbortion Instagram photos were mainly about stories told in first person point of view as a woman. This result corresponds with the meaning of hashtag movement. Since hashtags make it easy both to share one’s own story and to find similar stories of others, it may link one’s personal experience with social movements (Dejmanee et al., 2020; Dobrin, 2020; Johnson et al., 2019). Also, the embedded texts contained words with contrasting meanings in the context of #ShoutYourAbortion movement, and hashtag hijacking (Ahmed, 2018; Kosenko et al., 2019) was supposed to occur at least partially. In fact, hashtag hijacking can be an inherent limitation of hashtag movement. A hashtag can be attached to a post regardless its original context, so its meaning can be easily transformed or contaminated; this applies particularly to a highly controversial issue such as abortion. It would be a topic for future research that how a hashtag was tried to be hijacked and whether and how it was successful.
Also, two clusters were observed from the Instagram photos with #ShoutYourAbortion hashtag. The first cluster comprised photos which exhibit text materials in them, while the second cluster consisted of photos which contained human faces with texts. This difference were reflected in both content- and pixel-level characteristics of photos. At content level, the embedded texts in the second cluster were more about introducing debates or telling one’s stories with human faces than the first cluster. Photos in the second cluster showed more and bigger human faces with stronger emotions than the first cluster. At pixel level, photos in the first cluster were brighter, while photos in the second cluster were more colorful. These results contribute to our understanding of the visual representation of #ShoutYourAbortion movement on Instagram. For example, human faces had an essential role in the visual representation of the movement. While the literature has contrasting reports whether faces have an positive impact on the publics’ responses (Bakhshi et al., 2014) or not (Kim & Kim, 2020), it still holds that human faces are the central elements in visual representation of social movements and this was also the case in #ShoutYourAbortion movement.
As far as we know, the comparison between photo clusters both in content and pixel levels are conducted for the first time in this study. Although a small number of studies have analyzed photos of hashtag movements (Ichau et al., 2019; McCosker, 2015; Stefanone et al., 2015), none of them has investigated how the photo corpus can be clustered based on their visual characteristics and examined the differences at content and pixel levels between clusters. Future research on hashtag movements via photos is expected to employ this analytical framework and explore how the photos can be grouped and how the resulting groups would differ. The results of this study would provide a basis for interpreting the results in future research and finding their peculiarities.
Finally, the public’s responses were found to be related to a part of photo features. More engagement and more positive comments were observed from the photos with bigger and larger human faces, with more female faces and happier emotion, and with larger share of warm colors. In contrast, less engagement and more negative comments were observed from the photos with more number of words. Some photo features were found to be associated with either engagement or comment sentiment only. More engagement was observed from the photos with more sad emotion, while less engagement was observed from the photos with stronger colors and stronger affections. More positive comments were observed from the photos with more number of hue peaks and more diverse color, while more negative comments were observed form the photos with more surprising emotion and with more variations in the pixels. Additionally, the photo features had an acceptable level of predictive power on engagement, but not on comment sentiment. Although the literature on hashtag movements mainly focused on the content or topics of SNS posts (Dejmanee et al., 2020; Li et al., 2021; Linabary et al., 2020; Van der Pijl et al., 2020; Xiong et al., 2019), it has been relatively understudied how the characteristics of posts in hashtag movement were related to the public’s responses. The results in this study were about a single case of a hashtag movement and cannot be generalized, but they can show an example that photos with certain characteristics played a significant role in receiving more positive responses from the public.
Implications
In theoretical aspects, this study advances the literature about hashtag movements on SNSs by focusing on their visual representations. The findings may help us to understand the visual representation of #ShoutYourAbortion movement: which objects were mainly represented, how key messages and narratives are presented, and which were the key clusters have been shown. These findings would help us to understand how hashtag movements are performed (Cappellini et al., 2019; Filieri et al., 2021; Kosenko et al., 2019) in the public health domain (Ahmed, 2018; Chatzopoulou et al., 2020) using visual media (Duggan, 2022). In the deeper level, this study suggests that the policy on social media platforms to adopt new functionalities, such as hashtag or photo uploading, can influence how the public express and perceive social issues. This study may have practical implications; the significant associations reported in this study between photo features and the public’s responses are expected to be utilized for making photos in hashtag movements more appealing to the public. In methodological aspects, this study has shown how clustering can be used to analyze photo data and how DNN-based and manually-extracted features can be used together for analysis. While DNN-based features are known to be effective for clustering (Curiskis et al., 2020), they have a weakness of being difficult for human to understand their meaning. Manually-extracted features which are more familiar with human understanding can mitigate the weakness and show the difference among clusters in terms of their visual characteristics.
Limitations and Future Studies
The major limitation of the present research is that it analyzed the photo data of a single movement. Future research may compare multiple hashtag movements and find their similarities and differences. Also, the occurrence and dynamics of hashtag hijacking may be investigated in more detail: whether and how a hashtag was tried to be hijacked and how the overall corpus of the movement was transformed. This study is limited by analyzing only English words presented in photos. The cultural differences which might have been manifested via diverse languages were not fully reflected, and these would be a fruitful area for further work.
Footnotes
Declaration of Conflicting Interests
The author(s) declared no potential conflicts of interest with respect to the research, authorship, and/or publication of this article.
Funding
The author(s) disclosed receipt of the following financial support for the research, authorship, and/or publication of this article: This work of Sunmi Lee is supported by a National Research Foundation of Korea (NRF) grant funded by the Korean government (MSIP) (NRF-2021R1A2B5B01002611).