
Abstract
Energy efficiency is a major area of attention in international efforts to prevent climate change and optimise resource usage since it is essential for fostering sustainable economic growth. This study investigated the impact of economic policy uncertainty on energy efficiency in OECD countries. Based on availability, data from 25 countries were collected from 1990 to 2020. The basic results indicated that economic policy uncertainty improved energy efficiency. Asymmetric analysis revealed that countries with higher efficiency were less influenced by economic policy uncertainty. Furthermore, environmental policy stringency weakened the positive effect of economic policy uncertainty on energy efficiency. Suggestions have been put forward to improve energy efficiency.
Keywords
Introduction
According to OECD (2023), the demand for oil, natural gas and coal had peaked before 2030. However, given the limited energy resources, enhancing energy efficiency has become a prominent issue in international affairs. Energy efficiency was dubbed “the first fuel” since it is widely available and inexpensive to extract (International Energy Agency, 2013).
Since increasing energy efficiency is essential to attaining sustainable development, it is important to understand its driving factors is therefore of significant academic and policy relevance. Although a lot of research has been done on the factors that affect energy efficiency—highlighting influences such as sharing economy (Dabbous & Tarhini, 2021), fintech (Teng & Shen, 2023), environmental technology (Paramati et al., 2022), and environmental tax (Yasmeen, Zhang, et al., 2023)—the potential impact of EPU has been largely overlooked. This represents a critical gap, especially considering that EPU has received increasing attention in environmental economics, where it has been shown to affect carbon emissions and ecological footprint (Aslan et al., 2024; Tee et al., 2023).
EPU measures uncertainty by analyzing the frequency of uncertainty-related terms in the EIU report. Theoretically, EPU may either promote or diminish efficiency. On one hand, technological innovation is influenced as EPU reduces additional investment in R&D (K. Li & Lin, 2016), which thereby reduces energy efficiency. Furthermore, energy price volatility is made harsher by EPU. Consequently, this affects investors' buying choices as well as consumers' energy-consumption tactics (Hafezalkotob, 2018). On the other hand, EPU is the driving force behind green innovation in a selection of Chinese businesses (Li et al., 2019), and firms will also improve their ability to handle this complex, dynamic, and unpredictable environment (Bag et al., 2020). In an atmosphere of uncertainty, energy suppliers would strive to enhance their energy efficiency. Since the nexus between EPU and energy efficiency remains generally unclear, a thorough and rigorous investigation is warranted. Therefore, when exploring the determinants of energy efficiency, scholars should pay greater attention to the role of EPU.
The OECD countries have a significant influence on global development due to their modernisation and economic and societal experiences. Additionally, these countries hold a significant position in the field of energy. In 2020, two-fifths of the world’s energy supply and approximately 80% of global trade originated from OECD nations (Yasmeen, Tao, et al., 2022). In fact, 40% of the world's energy is consumed by OECD member countries (Teng & Shen, 2023). Energy efficiency is also closely monitored in OECD countries.
Therefore, this study seeks to address three key questions. (1) Is energy efficiency impacted by EPU? (2) If yes, do the effects exhibit heterogeneity? (3) Does environmental policy stringency (EPS) moderate the impact of EPU on energy efficiency?
This research advances the pertinent literature as follows: This research contributes to the existing literature in several important ways. First, while previous research has examined the connection between EPU and energy efficiency at city-level (Wei et al., 2022) or analyse the impact of other types of uncertainty on energy efficiency (Han et al., 2025; Li, Zheng, et al., 2021; Pata, 2024), the nexus between EPU and energy efficiency has not received much attention in the context of OECD nations. Second, by using quantile regression to analyse heterogeneity, our work offers a more sophisticated comprehension of the asymmetric impacts of EPU on energy efficiency across various distributional levels. Lastly, most existing studies focus on analysing the direct effects of EPS, while its moderating effect has received little attention. This study provides fresh perspectives on how institutional factors influence the relationship between EPU and efficiency.
The structure of the article is organized as shown in Figure 1.

Structure of the article.
Literature Review
Literature on the Relationship Between EPU and Energy Efficiency
EPU, defined as the uncertainty arising from abrupt shifts in economic policies that disrupt organizational operating environments (Baker et al., 2016), has gained growing attention in energy-related research. Although the EPU-energy nexus is predominantly examined in the research currently in publication, little is known about how specifically it affects energy efficiency. Empirical evidence in this domain remains scarce, with only limited investigations to date. For example, research on G7 economies demonstrates economic activity is hampered by the uncertainty resulting from different economic upheavals, which in turn impedes the development of green energy (Su et al., 2022). This pattern extends to different energy consumption—Li et al. (2023)’s research identifies EPU as a dual-force driver that suppresses renewable energy adoption while stimulating non-renewable energy consumption. This can be attributed to traditional energy sources are relatively inexpensive and offer a more reliable supply during times of disturbance. Furthermore, EPU’s impacts extend to broader energy market dynamics: For instance, EPU may influence oil prices (Antonakakis et al., 2014) and energy operating costs (Afzali et al., 2020).
The studies most relevant to this article include the following. A cross-city examination of 39 Chinese municipalities found heterogeneous EPU effects on energy efficiency, with developed cities experiencing less negative influence due to their advanced economic structures and technological capabilities (Wei et al., 2022). Extending this analytical framework to other types of uncertainty, Chinese city-level evidence demonstrates that reduced trade policy uncertainty improve energy efficiency through dual mechanisms: lowering institutional barriers for foreign direct investment in clean technologies and accelerating localized diffusion of renewable energy solutions (Li, Hu, &, Zhang, 2021). On the contrary, Chinese city-level evidence indicates climate policy uncertainty reduce energy efficiency (Han et al., 2025). Green energy investment risks and profitability are impacted by frequent policy changes. The inability to forecast compliance costs may make it more difficult for businesses and municipalities to undertake energy-saving and emission-reduction strategies (Han et al., 2025). Another study by Pata (2024) examine the impact of energy policy uncertainty on energy efficiency in four countries with highest renewable research spending. Such uncertainty enhances energy efficiency, as policymakers are more likely to increase investments in fossil fuels and energy-saving technologies rather than channelling support toward specific energy sources.
Literature on the Relationship Between EPS and Energy Efficiency
There is ongoing debate regarding whether EPS increases or decreases energy efficiency. According to some academics, energy efficiency is negatively correlated with EPS. EPS produces a “compliance cost effect” that increases the financial burden of pollution control on enterprises and, as a result, reduces energy efficiency (Dirckinck-Holmfeld, 2015; Hancevic, 2016). Zhou and Feng (2017) examined the link between China’s use of fossil fuels and environmental rules and concluded that environmental regulations have dynamic direct consequences that result in a “green paradox” and high compliance costs. Nonetheless, some academics assert that EPS can increase energy efficiency due to the innovation compensation effect. Companies may be forced by regulations to innovate to increase energy efficiency and make up for any loss (Zhang, Liu, et al., 2017). Porter and van der Linde (1995) put out Porter’s hypothesis and contended that EPS forces companies to rethink their technology, spur innovation, and ultimately improve energy efficiency. While prohibiting the use of “dirty” technology, EPS can encourage the development of “clean” technology (Cohen & Tubb, 2018). This development of “clean” technology can contribute to enhanced efficiency.
With regards to empirical evidence, a large number of scholars have made significant contributions to this topic. Some formed the opinion that the stricter the rule, the higher the efficiency. Chen et al. (2020) examined the role of regulations in the manufacturing industry and concluded that stricter regulation improves energy efficiency significantly and leads to a higher ratio of clean energy use. The underlying nature of this phenomenon can be attributed to increased R&D inputs and the prevalence of high-energy-efficient enterprises. Cui and Cao (2023) argues that regulations can promote green technology innovation, optimise resource allocation, and reduce energy usage. Therefore, efficiency was improved. Zhang et al. (2020) analysed the regulation-energy nexus in China and concluded that regulations may encourage the replacement of energy with capital. Additionally, they may eventually result in energy saving, with technology advancement serving as the main catalyst.
Based on the data in OECD countries, Wang et al. (2019) investigated the impact of EPS on green productivity and concluded that the results confirmed Porter’s hypothesis. Up to a certain point, EPS increases productivity; however, beyond that point, the effect is the opposite. Similarly, the study conducted by Li, Zheng, et al. (2021) contended that reasonable regulations can foster the growth and creation of innovative activities, while unreasonable regulations will inhibit innovation. A U-shaped effect is also documented by Shuai and Fan (2020) in the context of China.
Gap
Even though the role of EPU in energy markets is receiving more scholarly attention, there are still important research gaps that need to be filled. First, existing research has primarily focused on the impact of EPU on energy markets. However, it is worth noting that EPU may also exert a significant influence on energy efficiency. While some studies by Wei et al. (2022) and Li, Zheng, et al. (2021) have recognized the importance of uncertainty and explored its relationship with energy efficiency, these investigations have been largely confined to the city level, leaving national-level dynamics underexplored. Examining the EPU–energy efficiency nexus at the national scale can therefore contribute to a more comprehensive understanding of this relationship. Second, potential moderating role of EPS in shaping the nexus between EPU and energy efficiency has been entirely overlooked.
Thus, this study put forth two hypotheses: first, EPU can influence energy efficiency (Hypothesis H1), and second, EPS can moderate the impact of EPU on energy efficiency (Hypothesis H2).
Data and Methodology
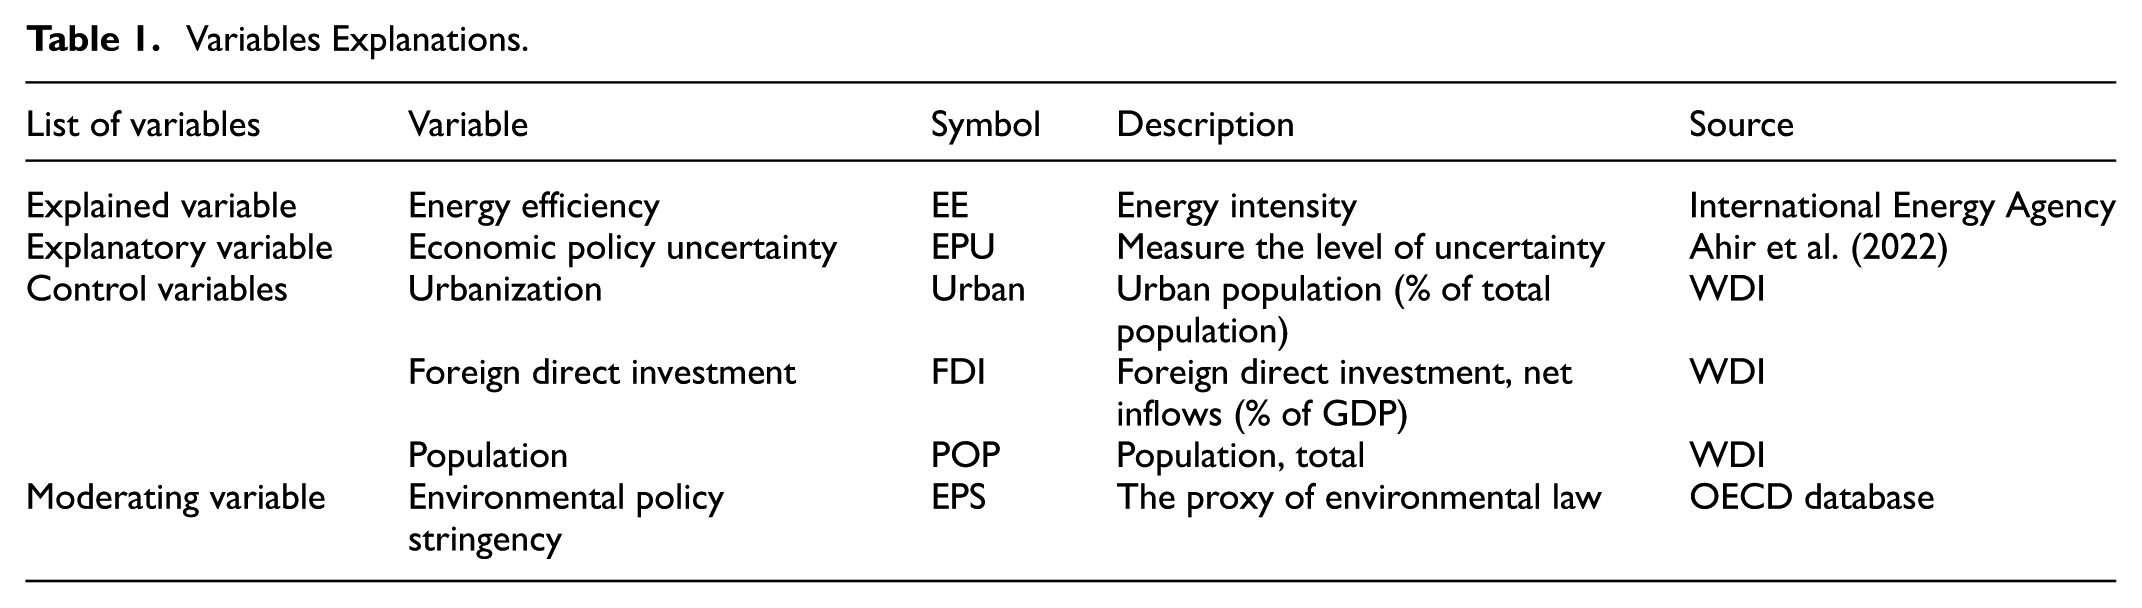
This study collect data from a variety of sources. Firstly, following the study of Su (2023), energy intensity was selected as a stand-in for energy efficiency. This index came from the IEA (2022). Secondly, the WUI index was chosen as a measure of EPU and served as the explanatory variable. Thirdly, control variables source from WDI. Finally, EPS from the OECD database as the moderating variable was chosen. After merging different datasets to create a balanced panel, the final dataset consists of 31 years of data from 25 countries.
Explained Variable: Energy Efficiency
Energy intensity provided information about how much energy was needed to generate 1 unit of economic output. A higher ratio implies that more energy was needed to generate a single output unit, which signified lower efficiency. Energy intensity served as the inverse indicator of energy efficiency.
Explanatory Variable: Economic Policy Uncertainty
The WUI was chosen as the proxy of EPU. Because WUI data is recorded quarterly, this study synchronised the time intervals with the explained variable and generated a yearly index. This study followed Bilgin et al. (2021) and Raza et al. (2024) and Shah and Albaity (2022) and created an annual index by taking the simple average of all quarters.
Control Variable
Previous research has indicated that the external macroeconomic environment has an impact on energy efficiency. Higher urbanization economics typically consume more energy (Shahbaz et al., 2020). Urbanisation also leads to a large concentration of people and a notable rise in energy use (Jiang & Lin, 2012). FDI can have a pollution halo effect on energy efficiency (Wang, 2017). When foreign companies enter a host nation, they introduce cleaner and greener technology. Thus, the energy efficiency of the host country is enhanced. With an increasing population and limited land, population density tends to rise. Individuals living in high-density countries are more likely to share energy consumption. The economies of scale in energy use also contribute to enhanced energy efficiency (Su, 2023). With reference to Dabbous and Tarhini (2021), Han et al. (2021), Lee and Ho (2022), Su (2023), this study select the following variables: (1) Urban proxied by urban population (% of total population), (2) FDI characterized by foreign direct investment, net inflows (% of GDP), and (3) population measured by the total population.
Moderating Variable: EPS
The EPS index developed by the OECD represents the costs of actions that degrade the environment, whether these costs are explicit or implicit. Higher index values correspond to higher expenses associated with environmental degradation.
The data for the variables above are summarized in Table 1.
Variables Explanations.
Econometric Model
In order to measure the impact between variables, this study sets the following model:

Where EI present the energy intensity. EPU reflect the level of uncertainty. CC is a group of control variable. ε is the error term. i stands for the country, while t represent time.
ε ijt = the error term
Three techniques—pooled Ordinary Least Square (OLS), Fixed Effect Model (FEM), and Random Effect Model (REM)—were used to analyse the data. If the BP and LM Chi-Square tests’ p-values are significant, then OLS is rejected. Then the model selection is based on the Hausman test: if the p-value is significant at the 1% or 5% level, the FEM is preferred; otherwise, REM is chosen. Figure 2 shows a flowchart that depicts this decision-making process.
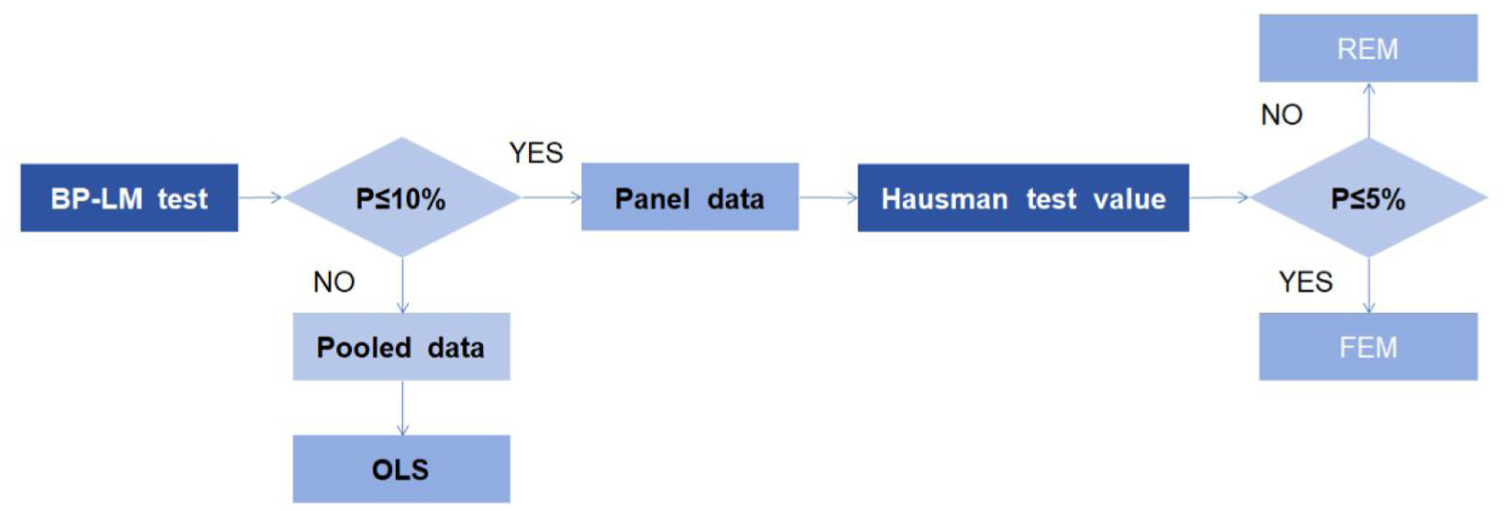
Model selection flowchart.
Empirical Results
Energy Efficiency
The average energy intensity for OECD countries was plotted in Figure 3. As observed, Canada occupied the top position, indicating the lowest efficiency, while Switzerland ranked at the bottom, signifying the highest efficiency.

Average energy intensity (1990–2020) level of OECD countries.
Primary Test
Table 2 presents the descriptive statistics as well as primary test. The correlation test and VIF test outcomes indicate that there is no severe multicollinearity, as the correlation coefficients are less than .8 and the VIF values are below 10.
The Descriptive Statistics and Primary Test.

Basic Results
The BP LM and Hausman test outcomes in Table 3 indicate the FEM should be the final result. A 1% increase in EPU led to a decrease in EI by .932%. This indicates that EPU can improve energy efficiency in OECD countries. This confirms hypothesis H1. The observed impact can be attributed to proactive responses to uncertainty and investments in sustainable infrastructure. Entrepreneurial firms that excel in turbulent environments seize opportunities for innovation and demonstrate increased responsiveness to volatility (Han et al., 1998). During the period of uncertainty, companies enhance their information processing skills to manage this volatile, unpredictable, and complicated environment (Bag et al., 2020). Uncertainty compels firms to engage more extensively with external partners and leverage a diverse array of resources to enhance innovation. This is driven by the imperative to seize fleeting opportunities, as failure to do so could result in their elimination from the market (Li et al., 2019). This positive response to EPU is also mentioned in Kong et al. (2022) and Li and Yang (2015)’s study, which suggest that firms may reduce their planned physical investments and instead allocate the saved resources toward business innovation as a strategy to cope with future uncertainty. On the other hand, countries could invest in environmentally-friendly infrastructure as a result of the uncertain economy. Politicians are highly susceptible to fluctuations in the price of electricity. Hence, countries can strategically direct resources towards sustainable infrastructure initiatives when energy prices rise due to uncertainty. For example, there was an increased interest in building new hydroelectric dams in northern Sudan when the value of electricity increased (Wu et al., 2016). Energy efficiency was frequently emphasised in these projects as a critical component that improved the nation’s overall energy performance. These results contradicted with the findings of Li, Hu, and Zhang (2021) and Wei et al. (2022), who argue uncertainty is negatively connected with energy efficiency.
Basic Regression Result.
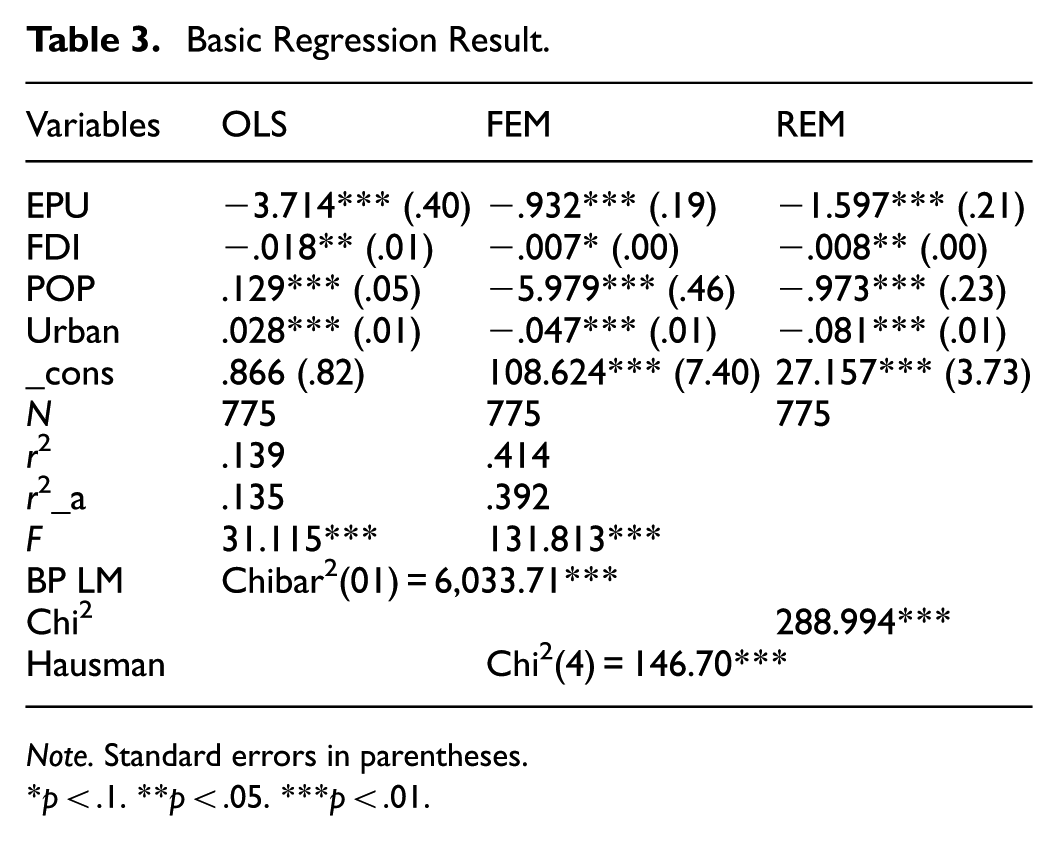
Note. Standard errors in parentheses.
p < .1. **p < .05. ***p < .01.
The results suggest a negative association between FDI, POP as well as Urban and EI. The negative signs indicated that FDI, POP and Urban were beneficial to energy efficiency. FDI brought cutting-edge energy-saving technology and knowledge of energy management, which was beneficial for energy improvement (Pan et al., 2020). This outcomes corroborate the work of Wang (2017). Regarding the positive effect of POP on energy efficiency, there may be a chance to attain economies of scale as the population grows. When these technologies are used widely, costs can decrease, which increases their accessibility. This result contradicted the findings of Dabbous and Tarhini (2021), who contended that population growth raised EI by influencing energy use, which resulted in decreased energy efficiency. Finally, urbanisation drove technological advancements and reaped the benefits of economies of scale, thereby enhancing energy efficiency (Wang et al., 2014).
Robust Test
To verify the fundamental conclusions, five robustness tests were carried out.
Add Extra Control Variable
If essential variables were missing, the validity of the empirical findings would be compromised. Thus, a new control variable was incorporated, and Equation 1 was rerun to determine if the parameter of EPU changes. Parallel with the research of Yao et al. (2021) and Ziolo et al. (2020), FD was added to the regression. FD was expressed as the portion of GDP attributed to domestic lending to the private industry. Funding for technology projects that achieved higher output with less energy input was sourced from an established financial market. The results presented in Table 4, based on the fixed effects model selected through model selection criteria, indicate that the coefficient for EPU remains negative, thereby providing further support for Hypothesis 1.
Robust Test 1: Add Control.

Note. Standard errors in parentheses.
p < .1. **p < .05. ***p < .01.
Lag of the Explained Variable
Secondly, the effect of the lag of the energy efficiency was considered in line with the study of Song and Han (2022) and Zakari, Khan, Tan, et al., 2022). The results presented in Table 5, based on the fixed effects model selected through model selection criteria, demonstrate the robustness of the baseline conclusion.
Robust Test 2: Lag of Explained Variable.

Note. Standard errors in parentheses.
p < .1. **p < .05. ***p < .01.
Replace Explanatory Variable
Following the method of (Bilgin et al., 2021), this study took only two quarters of WUI to construct EPU2. The baseline conclusions remain robust after replacing explanatory variable as indicated in FEM of Table 6.
Robust Test 3: Replace Explanatory Variable.
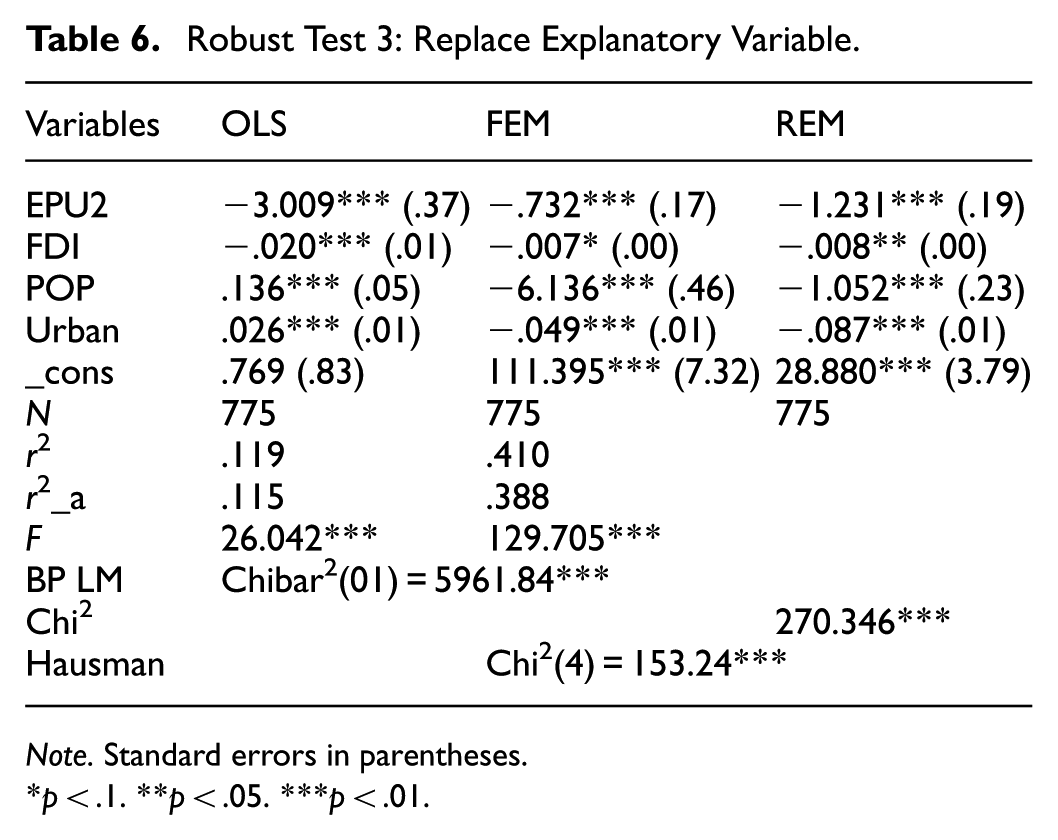
Note. Standard errors in parentheses.
p < .1. **p < .05. ***p < .01.
Other Estimate Techniques
Following the technique adopted by Abbas et al. (2024), this study employed feasible generalized least squares (FGLS) technique. This technique can solve issue of serial correlation and heteroskedasticity (Zakari, Khan, Tawiah, et al., 2022). In line with Omar and Hasanujzaman (2025), this study took DKSE (Driscoll Kraay standard errors) technique. This technique contributes to the production of trustworthy estimates by managing standard errors in autocorrelation and can handle heteroskedasticity issues (Shah et al., 2025). Outcomes reported in column (1) and (2) of Table 7 support the robustness of baseline conclusions.
Other Estimate Techniques.
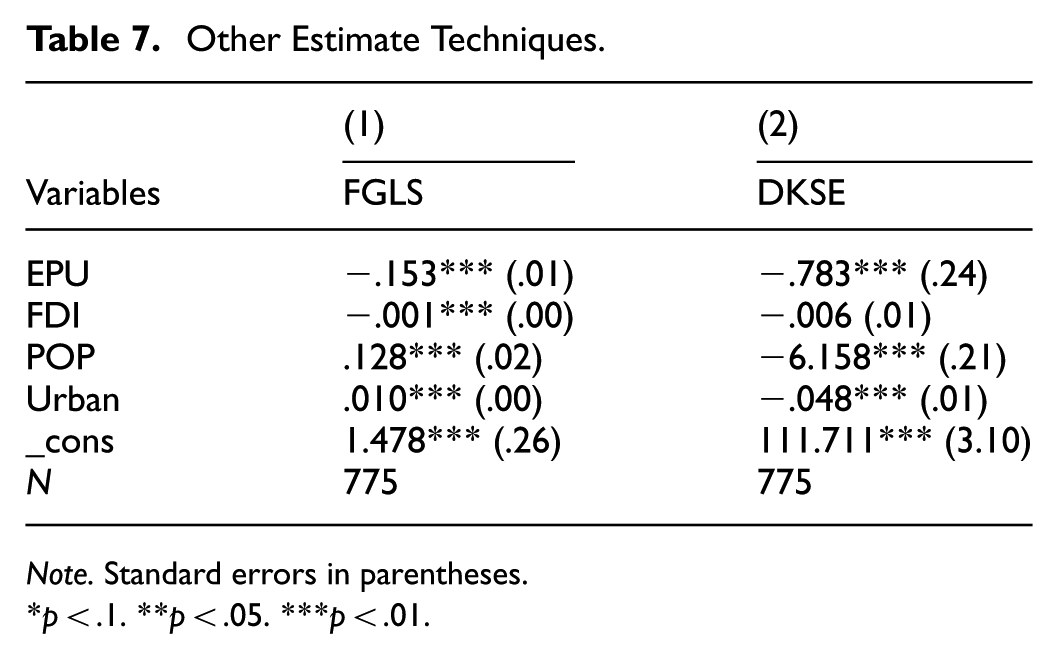
Note. Standard errors in parentheses.
p < .1. **p < .05. ***p < .01.
Deal with Endogeneity
Drawing on recent study of He et al. (2025), this study use instrumental variable two-stage least squares (IV-2SLS) estimation to alleviate endogeneity issues. Following the work of Elbahnasawy (2014) and Pang et al. (2024), this study choose the lag of the explanatory variable as IV, as it satisfies both the relevance and exogeneity conditions. Outcomes are reported in Table 8. Column (1) reveal EPU has a significant time dependence. Besides, both the Anderson canon. corr. LM statistic and the F-test exceed the critical values, supporting the validity of the IV. The results reported in column (2) show that EPU remains negatively correlated, indicating that the baseline conclusions are robust.
IV-2SLS Outcomes.

Note. Standard errors in parentheses.
p < .1. **p < .05. ***p < .01.
Asymmetric Analysis
Panel quantile regression was used to run asymmetric analysis in order to produce a more reliable result. This technique provided a more in-depth analysis for model estimate at different quantiles (Koenker, 2004).
Equation 2 is constructed as follows:
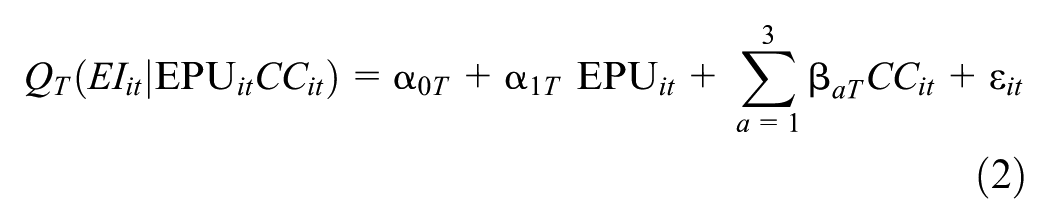
Where QT is the conditional quantile, T represents the quantile.
The outcomes of asymmetric analysis are reported in Table 9 and Figure 4. The magnitude supports the application of quantile regression as the impact of EPU on energy efficiency is heterogeneous across quantiles.
Asymmetric Analysis.

Note. Standard errors in parentheses.
p < .1. **p < .05. ***p < .01.

Graphical evaluation of coefficients of asymmetric analysis.
The coefficients of EPU were negative and significant across the distribution. Initially, a 1% rise in EPU leads to a 2.042% decrease in energy intensity at the 10th percentile of energy intensity (high efficiency). However, the elasticity soared to 5.019% at the 90th percentile (low efficiency). These outcomes revealed that the positive impact of EPU was more significant in higher quantiles (low efficiency), which was inconsistent with the work of Wei et al. (2022). The study of Wei et al. (2022) concluded that EPU reduced energy efficiency only among high efficiency cities. Hypothesis H1 was further validated through this analysis. The difference suggests that the influence of the EPU was determined by the level of energy efficiency. The growing effect at upper quantiles (lower efficiency) can be explained as follows. First, countries in higher energy efficiency quantiles have well-established mechanisms to cope with changes in the value of energy. When EPU increased, it caused fluctuations in the value of energy, and other mechanisms weakened the impact of the EPU. Nevertheless, the lack of developed domestic mechanisms in countries at lower energy efficiency quantiles that reacted to fluctuations in global energy prices brought about by the EPU made them more vulnerable to such pressures. Second, in the face of EPU, less efficient countries may find greater motivation to innovate. The necessity to adjust to the changing market dynamics and economic situations may encourage these economics to investigate and use more creative and effective methods. Thus, the effect of EPU increased.
In conclusion, the coefficients showed a rising tendency as the quantiles moved from lower to higher. This implied that EPU had a particularly significant influence on less efficient nations.
Moderating Effect of EPS
The impact of EPU on energy efficiency could be influenced by external factors, like the political and legal environment. The EPS, which serves as a proxy for environmental law, can also affect EPU’s influence on energy efficiency. Diverse results could arise from varying levels of EPS. High levels of EPS would drive up manufacturing costs and reduce an organisation’s ability to compete. To examine the impact mechanism of EPS, Equation 3 is constructed as follows.
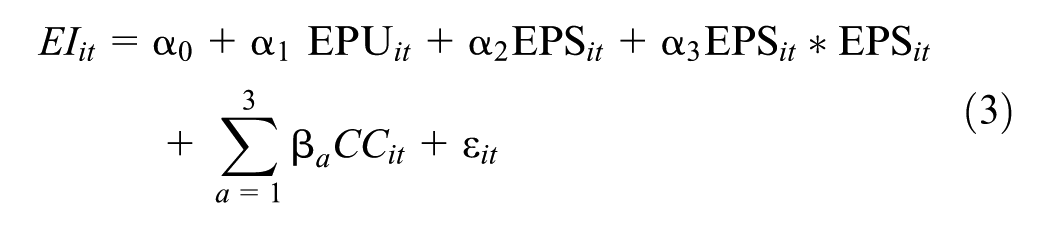
Where EPS present the environmental regulations.
The moderating outcomes is presented in Table 10. FEM is the final model according to BP LM and Hausman test. According to FEM, the interaction term (EPU * EPS) is significantly positive. This suggests that an increase in the EPS level may weaken the beneficial benefits of EPU on energy efficiency. Hypothesis H2 was validated. This weaken effect may be explained by “green paradox,” compliance costs crowding out innovation investment and amplified uncertainty over policy trajectory. First, high EPS denote government will complement stricter environmental legislation. Firms may speed up the exploitation of fossil fuels (such as coal and oil) in the short term to protect present earnings if they anticipate future increases in the price of carbon or more stringent technical requirements (Belfiori, 2021). Resource allocation is skewed by this behaviour towards immediate profits rather than long-term investments in energy-efficient technologies. Second, strict environmental regulations force businesses to incur high compliance expenses, like buying equipment to reduce emissions and paying carbon taxes (Fullerton & Muehlegger, 2019). These expenses lower the available funds for energy efficiency innovation. Third, firms get contradictory signals when high EPS and high EPU are combined—for instance, the simultaneous push for economic growth and the enforcement of strict emissions standards. This policy conflict increases uncertainty about the overall direction of regulation. As a result, businesses are more likely to postpone decision-making and adopt a “wait-and-see” approach, delaying long-term investments in energy efficiency.
Moderating Effect.

Note. Standard errors in parentheses.
p < .1. **p < .05. ***p < .01.
Conclusion and Policy Recommendations
Conclusion
Energy efficiency has gained importance and popularity in the modern era as more people have begun to realise the importance of maximising resource utilisation, minimising environmental impact, and advancing sustainability across a variety of industries. This article studied the impact of EPU on energy efficiency based on the data collected from OECD countries from 1990 to 2020. Outcomes reveal EPU can improve energy efficiency and several robust tests confirmed the basic results. Asymmetric analysis denotes this positive effect is particularly noticeable in nations with lower levels of efficiency. Finally, EPS weaken the positive effect of EPU on energy efficiency.
Policy Recommendations
This research has several implications for policy. First, the relationship between EPU and energy efficiency suggests that higher EPU may be beneficial to efforts that aim to improve efficiency. Governments should understand that in order for businesses to stay competitive, modest levels of uncertainty may encourage innovation. To assist businesses in turning uncertainty into a chance for energy-efficient innovation, policy tools like R&D tax credits, innovation grants, and green technology incubation programs might be created. Besides, EPU act as a catalyst for governments to boost spending on environmentally friendly infrastructure (such as clean energy, grid modernisation, and smart buildings). To stabilise long-term energy performance, governments should strategically direct funding into energy-efficient public projects during uncertainty times. However, it is important to note that excessive or poorly managed uncertainty may generate adverse effects, such as investment hesitation or short-termism among firms. As a result, sending out consistent regulatory signals is crucial for directing businesses towards long-term, efficiency-boosting decisions.
Second, the heterogeneous impact of EPU at different quantiles serves as a reminder to tailor economic policies according to specific circumstances. Policymakers should prioritise long-term, transparent, and stable efficiency strategies. In low-efficiency contexts, targeted subsidies, public procurement of efficient technologies, and capacity-building programs can reduce investment risks and accelerate adoption. In high-efficiency countries, stable carbon pricing frameworks and enhanced support for innovation are more effective.
Thirdly, policymakers can implement forward-looking measures like gradually raising carbon prices, eliminating fossil fuel subsidies, and introducing transitional support for low-carbon innovation to lessen the “green paradox” effect, which occurs when businesses increase their use of fossil fuels in anticipation of future stricter regulations. In order to increase credibility, governments should publish long-term roadmaps and match fiscal measures with climate goals in order to guarantee consistency across economic, energy, and environmental policies. In reality, this involves eliminating contradictory signals—for example, concurrently supporting fossil fuels while boosting renewables—and replacing them with coherent packages that support both growth and decarbonisation. Standardized reporting instruments and risk-sharing arrangements should also simplify compliance frameworks, reducing the regulatory burden on businesses and freeing up funds for energy-efficient technology purchases.
Limitation
First, this study sample was constrained by data availability. The dataset consisted exclusively of countries within the OECD countries where all the explained, explanatory, and moderating variables were available. The available data was only for 25 countries spanning from 1990 to 2020. Therefore, future research could change the sample to resource-rich economies, countries participating in the Belt and Road Initiative, leading manufacturing nations, and top energy-consuming countries.
Second, alternative efficiency measurement methods, such as DEA super-SBM and SFA models, could be employed to compute efficiency. These technologies can incorporate GDP and CO2 emissions as output indicators, as demonstrated by previous studies (Sarpong et al., 2022; Shah et al., 2023). This approach may yield more robust energy metrics.
Third, due to the spill-over effects of EPU, the Spatial Durbin Model can be employed to investigate the impact of energy efficiency in a given country. This analysis considers not only the intrinsic characteristics of the country but also the features of its neighbouring locations. Moreover, the integration of threshold effects of industrial structure and economic growth can provide valuable insights. By examining these threshold variables and identifying specific points at which their impact becomes more pronounced or starts to decline rapidly, a nuanced understanding of their influence can be gained. Finally, the short- and long-term relationships between the EPU and energy efficiency utilising econometric methodologies such as the CS-ARDL approach can offer constructive suggestions.
Finally, policymakers may find it useful to explore the moderating effects of additional noteworthy variables like economic complexity and technological innovation proxied by patent resident plus non-resident from WDI.
Footnotes
Funding
The authors received no financial support for the research, authorship, and/or publication of this article.
Declaration of Conflicting Interests
The authors declared no potential conflicts of interest with respect to the research, authorship, and/or publication of this article.
Data Availability Statement
The datasets used and/or analyzed during the current study are available from the corresponding author on reasonable request.