
Abstract
Environmental issues are becoming increasingly severe, increasing the urgency to address ecological and environmental pressures. This study explores the relationship between environmental policy stringency and environmental degradation using data from the 11 largest economies by GDP from 1992 to 2020. Additionally, it examines the existence of the Environmental Kuznets Curve (EKC) and the moderating role of economic policy uncertainty. First, the regression results show that environmental policy stringency helps reduce emissions. Second, both inverted U-shaped and N-shaped EKC patterns are observed. These findings remain robust after testing. Third, asymmetric analysis reveals that environmental policies are less effective in countries facing greater environmental pressures. Finally, economic policy uncertainty amplifies the reduction effect of environmental policy stringency. These findings provide practical implications for improving environmental quality while also broadening the theoretical scope of the EKC.
Keywords
Introduction
The problem of environmental sustainability has gained prominence as it is not only closely related to human health, but also integral to economic growth. Countries around the world have come to recognise the dangers of greenhouse gases and the significance of environmental sustainability. Hence, globally, many countries are committed to working together to address climate change. The Conference of Parties (COP 26), which calls for a reduction in emissions (Smil, 2022), is an example of this commitment.
Traditional measures of environmental degradation, such as CO2 emissions, only take into consideration emissions that are produced domestically, providing a narrow view. In contrast, consumption-based carbon emissions (CCO), which is derived from the Global Carbon Atlas, takes into account import emissions as well as the demands of government and household consumption, but excludes export emissions. CCO not only takes into account the global industrial chain but also pinpoints the sources of pollution and makes a distinction between economies that generate and consume pollutants (Peters et al., 2012). As a result, this measure provides a more accurate picture of environmental deterioration. In extant literature, many scholars have sought to examine the reasons for poor environmental quality (Dai & Du, 2023; Jiang et al., 2019; Udeagha & Muchapondwa, 2022; Zhuang et al., 2022). In addition, strategies for environmental sustainability have also been documented, such as renewable energy and fiscal policy (S. Li et al., 2023) and green innovation. Environmental policy stringency (EPS), for instance, includes tools for direct measurement, such as taxes on goods, which imply higher stringency by increasing the cost of pollution. EPS is designed to evaluate the consequences of environmental regulations on economic activities such as investment and international trade (Brunel & Levinson, 2013). Similarly, the consequences of environmental regulations on environmental degradation can also be evaluated. Existing literature has predominantly emphasised the role of EPS in the battle against environmental degradation for certain geographic or economic organisations such as Europe (Wolde-Rufael & Mulat-weldemeskel, 2023), the BRICST (Dai & Du, 2023), OECD countries (Albulescu et al., 2022), emerging economies (Wolde-Rufael & Mulat-Weldemeskel, 2021), as well as China and the United States (Assamoi & Wang, 2023). However, no empirical studies have empirically explored this association in the top 11 countries by gross domestic product (GDP) ranking (Brazil, Canada, China, France, Germany, India, Italy, Japan, Russia, United Kingdom, United States). All of these nations are established economies, which are linked to significant environmental deterioration. Since the use of fossil fuels is frequently associated with economic development (Alola & Onifade, 2022; Emblemsvåg, 2022), reducing CO2 emissions is essential to easing environmental stresses. Furthermore, despite research that have demonstrated the association between various heterogenous macroeconomic factors, there is no consensus on the impact of EPS on the environment. In this regard, determining the impact of EPS on CCO in these top 11 GDP-ranked countries is significant. Additionally, the literature review has revealed a scarcity of studies that specifically document the indirect impact of economic policy uncertainty (EPU), since the direct effects of EPU have been the focus of most studies (Khan et al., 2022; Y. Liu & Zhang, 2022; Romano & Fumagalli, 2018). Given the limited literature of this subject, a more in-depth analysis of environmental degradation based on national-level data of consumption-based carbon emissions is warranted.
The purpose of this paper is to investigate the connection between CCO and EPS in the top 11 GDP-ranked countries, while testing the validity of the Environmental Kuznets Curve (EKC) hypothesis. This EKC hypothesis suggests that economic growth initially harms but eventually enhances environmental quality as development advances. To advance existing literature, two critical dimensions were also incorporated: (1) asymmetric analysis effects of environmental regulations at different CCO levels, and (2) the moderating role of EPU in shaping policy outcomes.
Benchmark outcomes implied that EPS reduces CCO and EKC is valid. Asymmetric analysis further revealed a nuanced pattern: the emission-reduction impact of environmental regulations intensifies progressively as baseline emission levels decrease. The robustness tests echoed the benchmark outcomes. EPU enhanced the efficacy of environmental regulations, indicating that periods of macroeconomic instability may paradoxically create opportunities for accelerated emission reductions. By combining the aforementioned, this research contributes to theoretical knowledge while offering empirically supported approaches to environmental sustainability.
The following points distinguish the current study from previous empirical endeavours. First, this research focuses on the impact of EPS on CCO in the top 11 GDP-ranked countries, which addresses a gap in the existing literature regarding these economies. Second, an inverted U-shaped and N-shaped EKC were examined when CCO is considered as the proxy of environmental pressure in the top 11 GDP-ranked countries, which has not been extensively studied in previous research. Third, the asymmetric impact of EPS on CCO provides heterogeneous outcomes. Finally, the combined impact of EPU and EPS on environmental deterioration was investigated, addressing a gap in the literature as no such study has been done as of yet.
The following sections are organised as follows. The second section of this paper synthesises existing studies to establish the theoretical framework. The next section details the data sources, sample selection, and analytical techniques used in the study. The results are then presented, supported by relevant analysis and discussion. The final section summarises the key findings and offer practical approaches based on the study’s insights.
Literature Review
The Nexus Between Environmental Policy Stringency and Environmental Degradation
Theoretical Background
According to Shuai and Fan (2020), environmental regulations have a ‘production cost effect’ and an ‘innovative compensation effect’. EPS can hinder the promotion of non-green products by increasing their costs as documented by Neves et al. (2020). For the latter effect, Zhao (2007) pointed out long-term and medium-term technical innovation as being somewhat encouraged by environmental regulations. Similarly, environmental regulations can accelerate the adoption of environmentally-friendly practices in companies, leading to reduced environmental pressure (Porter & Linde, 1995).
However, costs related to EPS should also be taken into account, since EPS can discourage investments in environmentally-friendly innovation, which in turn worsens the environment (Mulatu, 2018). Additionally, EPS only promotes innovation in specific types of areas, resulting in a net productivity loss (Jaffe & Palmer, 1997).
Empirical Evidence
In past research, empirical evidence has remained inconclusive on whether EPS enhances environmental quality. Some scholars point out that EPS can alleviate environmental degradation. For instance, Wang et al. (2022) examined the impact of EPS on CO2 emissions for BRICS groups. They argue that EPS diminishes emission and plays a contributing role in improving environmental quality. Afshan et al. (2022) investigated the role of EPS in improving ecological sustainability in 27 OECD nations. The empirical outcomes indicate that rigorous regulations improve sustainability. The environmentally beneficial effects of EPS have also been documented in studies focusing on 20 European countries (Wolde-Rufael & Mulat-weldemeskel, 2023), BRICST countries (Dai & Du, 2023) and 32 OECD countries (Albulescu et al., 2022). Nevertheless, it has also been found that EPS can exacerbate environmental degradation, a phenomenon known as the ‘green paradox’ (Sinn, 2015), which refers to the phenomenon where the environment reacts unfavourably to stricter policies (Chu & Tran, 2022). In this case, the green paradox indicates that EPS could have unforeseen and undesirable consequences that exacerbate deterioration. As pointed out by Lodi and Bertarelli (2023), excessive regulations increase manufacturing costs, burdening businesses and decreasing their competitiveness, which is counterproductive to reducing carbon emissions. Similarly, in one study by Hao et al. (2018), the Generalised Method of Moments (GMM) results indicate that environmental regulations are unsuccessful in achieving the anticipated improvements in environmental quality. Higher environmental pressure is also found to have been caused by Asian environmental regulations (The Phan et al., 2021).
In addition to linear positive and negative correlations, an inverted U-shaped relationship between EPS and environmental degradation has also been documented. This suggests that while EPS increases initially aid in reducing environmental degradation, they may ultimately make it worse. For instance, according to Ouyang et al. (2019), there is an observed trend in 30 OECD countries that as EPS increases, PM2.5 emissions initially decreases. However, after reaching a certain threshold, additional increases in EPS results in a rise in PM2.5 emissions. Similarly, CO2 emissions have been found in the past to have an inverted U-shaped connection with EPS, which suggests that it takes time for EPS to take effect based on a study of seven emerging economies (Wolde-Rufael & Mulat-Weldemeskel, 2021) and BRIICTS countries (Brazil, Russia, India, Indonesia, China, Turkey, and South Africa; Wolde-Rufael & Weldemeskel, 2020).
Although the impact of EPS on environmental degradation has been studied, its effect on environmental degradation, as proxied by CCO, within the top 11 GDP-ranked countries remains unexplored. Thus, this study hypothesises that EPS may reduce CCO (Hypothesis H1).
Literature About EKC Hypothesis
Following the groundbreaking work of Grossman and Krueger (1991), scholars have proceeded to thoroughly examine the intricate nexus between economic growth and sustainability, mostly based on the EKC hypothesis. This hypothesis contends that early economic expansion is characterised by increased industrial activity and energy consumption, which worsen the environment. When a certain point of economic development is reached, additional growth results in better environmental quality. Different environmental proxies, sample countries, and econometric techniques all contribute to the ongoing controversy over the EKC hypothesis. CO2 emissions per capita (CE; Nuţă et al., 2024; Sarkodie & Adams, 2018; Shahbaz et al., 2019) and ecological footprint (Aydin et al., 2023; Hakkak et al., 2023) are often chosen as the proxy of sustainability. While some researchers (Aydin et al., 2023; Hakkak et al., 2023) have not found evidence to support the EKC hypothesis, others (Nuţă et al., 2024; Sarkodie & Adams, 2018) support it. Specifically, an N-shaped nexus was concluded for African countries (Ibrahim et al., 2021), Nigeria (Cosmas et al., 2019), Vietnam (Shahbaz et al., 2019), and the South Asian Association for Regional Cooperation (SAARC) region (Shekhawat et al., 2022). Meanwhile, a U-shaped nexus was identified in the studies of Majeed et al. (2022) for Pakistan and Bekhet and Yasmin (2013) for Malaysia. Besides that, an inverted N-shaped was documented in the studies of Y. Liu et al. (2016) for Chinese provinces, Farooq et al. (2024) for India, and Huang et al. (2023) for the Beijing-Tianjin-Hebei region in China, whereas an inverted U-shaped nexus was documented in the research of Chang et al. (2021) and Zheng et al. (2023) for China.
Although the EKC has been extensively examined in existing research, environmental degradation, as measured by CCO, within the top 11 GDP-ranked countries remains an underexplored area. Thus, this study hypothesises that an inverted U-shaped and an N-shaped EKC exist (Hypothesis H2).
The Nexus Between Economic Policy Uncertainty and Environmental Degradation
EPU arises from the unpredictability of official policies, particularly those that are related to fiscal and monetary policies. These policies are strongly connected to the daily operation of firms (Abbasi & Adedoyin, 2021). Nevertheless, there are inconsistent findings in the literature on the impact of EPU on environmental degradation. Some scholars argue that EPU exacerbates environmental issues. This can occur through the ‘policy change effect’ and indirectly through the ‘economic demand effect’ (Khan et al., 2022). For the former, policy uncertainty lowers research and development (R&D) and renewable energy programme investments (Al-Thaqeb & Algharabali, 2019). Furthermore, EPU places higher priority on stability, taking attention away from environmental regulations and hurting sustainability initiatives (Jiang et al., 2019). Because of EPU, businesses are opting for traditional, less costly energy sources for manufacturing, which leads to higher emissions and environmental deterioration (Y. Liu & Zhang, 2022). Some scholars conclude that EPU alleviates environmental issues. As noted by Romano and Fumagalli (2018), EPU can encourage investment in low-carbon technologies, thereby contributing to a reduction in CO2 emissions. In a similar vein, Anser et al. (2021) maintained that EPU affects economic actors’ choices and energy usage, which eventually lessens environmental strain. Based on firm-level evidence, J.-L. Liu et al. (2020) pointed out that EPU discourages investment in non-renewable energy companies but fosters investment in renewable energy enterprises.
Thus, this study hypothesises that EPU has a significant moderating impact on the EPS-CCO nexus (Hypothesis H3).
Literature Gap
In summary, prior research presents conflicting findings regarding the influence of EPS on environmental outcomes. This link has been hardly explored within the top 11 GDP-ranked countries, which are critical drivers of global environmental trends. While numerous studies have explored the EKC hypothesis, they have rarely utilised CCO as an environmental proxy, leaving a critical gap in understanding its applicability. Moreover, there is disagreement regarding the existence or the shape of the EKC, with some studies suggesting an inverted U-shaped relationship and others finding divergent patterns. Notably, the potential interactive effect of EPS and EPU on environmental outcomes remains largely unexplored, despite both factors being significant in influencing environmental degradation. Addressing these gaps by testing hypotheses H1–H3 offers a more thorough understanding of the dynamic interaction between environmental policies, EPU, and environmental degradation.
The conceptual framework is depicted in Figure 1.

Conceptual framework.
Data and Methodology
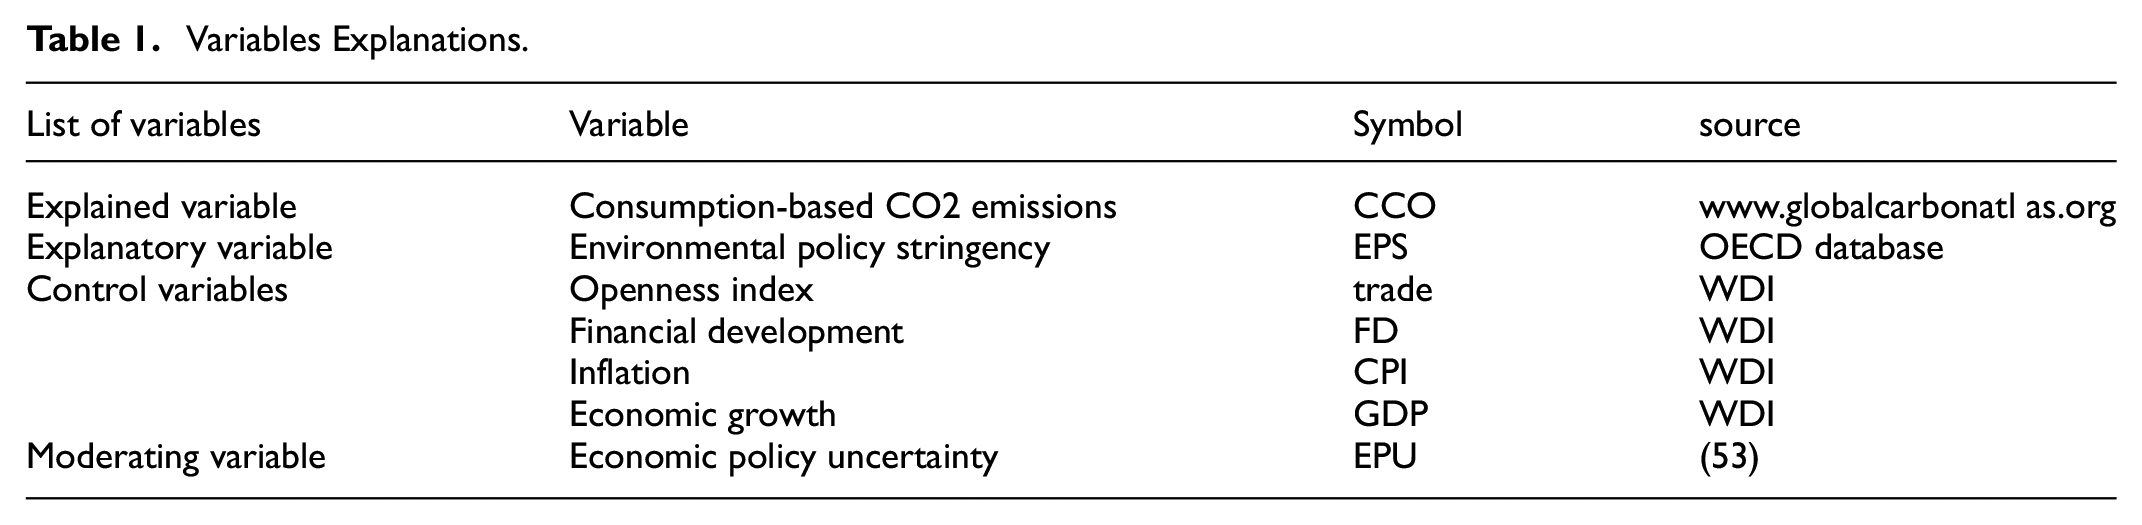
To analyse the influence of EPS on CCO in the top 11 GDP-ranked countries, data was collected from multiple sources. Firstly, CCO was chosen from the Global Carbon Atlas as the explained variable and EPS was derived from OECD database. Second, country-level control variables such as GDP, financial development, Consumer Price Index (CPI), and trade were gathered from the World Development Indicators (WDI). Finally, the World Uncertainty Index developed by Ahir et al. (2022), served as the proxy of EPU. The data for CCO spans the period from 1990 to 2022, while EPS data is available from 1990 to 2020. Additionally, data for China and Russia is recorded as 0 for 1990 and 1991. Consequently, this study selects 1992 to 2020 as the sample period.
Explained Variable: Consumption-Based Carbon Emissions
Adopting the approach used by S. Li et al. (2023), CCO data from the Global Carbon Atlas for the period of 1992 to 2020 was considered as the explained variable. A logarithmic transformation was applied to the CCO values to stabilise the variance and meet the assumptions of the statistical models.
Explanatory Variable: Environmental Policy Stringency
This study used the EPS index database constructed by OECD to measure the level of stringency of environmental regulations.
Control Variable
Trade enables countries to diversify their production and expand their trading portfolio to include more environmentally-friendly goods (Meng et al., 2022). In this way, trade contributes to an improvement in environmental quality. Elevated prices have the potential to diminish the government’s demand. Consequently, environmental sustainability can be enhanced (Ahmad et al., 2021). Besides, due to the crowding-out effect and higher prices driven by the CPI, people tend to purchase fewer goods. This decrease in demand significantly reduces production, ultimately mitigating environmental degradation (Jin et al., 2024).
Pollution levels can be diminished through the promotion of financial development, which facilitates greater accessibility to loans for clean energy projects (Danish et al., 2018). A decline in environmental quality is often a consequence of GDP growth, as it leads to an increased consumption of natural resources (Kazemzadeh et al., 2023a). Based on the above discussion and as shown in previous studies (Balsalobre-Lorente et al., 2023; Dehdar et al., 2022; Jamel & Maktouf, 2017; Kazemzadeh et al., 2022, 2023b; Kazemzadeh, Fuinhas, Shirazi, et al., 2023; Koengkan et al., 2019; S. Li et al., 2023; Meng et al., 2022; Raza & Shah, 2018; Saqib & Dincă, 2024), the following variables were selected: (1) openness index (trade) is a ratio of trade to GDP; (2) inflation (CPI); (3) financial development (denoted as FD) is domestic credit to private sector (% of GDP), and (4) economic growth (GDP). GDP per capita (log) is selected as the proxy of economic growth.
Moderating Variable: Economic Policy Uncertainty
This study followed Bilgin et al. (2021), Raza et al. (2024) and Shah and Albaity (2022) and used the four quarters’ simple average to create an annual EPU index.
The data for the variables above are summarised in Table 1.
Variables Explanations.
Econometric Model
The nexus between economic growth and environmental damage is commonly tested using the following equation:


where y is the environmental stress indicator denoted by CCO, and GDP is expressed by GDP per capita(log). GDP2 refers to the square of GDP, and GDP3 refers to the cubic power of GDP. Distinct conclusions regarding the EKC hypothesis are obtained from the outcomes of Equations 1 and 2, including the inverted U-shaped (Equation 1: α1 > 0 and α2 < 0), U-shaped (Equation 1: α1 < 0 and α2 > 0), inverted N-shaped (Equation 2: α1 < 0, α2 > 0, and α3 < 0), and N-shaped (Equation 2: α1 > 0, α2 < 0, and α3 > 0) patterns.
By incorporating other factors that will influence CCO, Equations 3 and 4 were proposed.


The moderating role of EPU was examined using Equations 5 and 6.


where CCO, EPS, trade, FD, CPI, GDP, GDP2, GDP3, and EPU represent the variables in Table 1. Besides, ε denotes the error term.
This study used the panel regression analysis by the pooled Ordinary Least Square (OLS), Fixed Effect Model (FEM), and Random Effect Model (REM). This study first performed the BP and LM tests to identify the best method for the analysis. These tests assist in determining whether panel data or pooled data is more appropriate. Panel data is favoured over pooled data if the p-value of the BP and LM Chi-Square (X2) tests is significant. FEM is favoured over REM if the Hausman test result is significant at the 1% or 5% level (Kamarudin et al., 2022).
Empirical Results
Descriptive Statistics
Table 2 shows the descriptive statistics results. The maximum and minimum values of EPS were 4.889 and 0, respectively, indicating varying levels of regulation. The average CCO level was 6.992 with a high standard deviation, indicating significant heterogeneity across the samples. The average EPU level was 0.194, accompanied by a standard deviation of 0.155. The average trade value was 46.02, with a standard deviation of 18.01. The average CPI stood at 91.49, with a standard deviation of 30.5. The mean FD value was 100.3, accompanied by a standard deviation of 51.79. Lastly, the average GDP was 9.697, with a standard deviation of 1.243.
Descriptive Statistics.

Table 3 provides the outcomes of the correlation matrix and variance inflation factor (VIF) test. There was no problem with multicollinearity since the highest Pearson parameter is less than 0.6. Besides, the matrix also indicated a negative link between EPS and CCO. The VIF test was also a crucial tool for testing and measuring multicollinearity between the model’s variables. The maximum VIF value was 2.22, which supports the conclusions drawn from the correlation matrix.
Correlation Matrix and VIF.

Benchmark Outcomes
In Table 4, the FEM was the final outcome. The results indicated that EPS and trade were negatively correlated with CCO, while CPI was positively correlated with CCO. EPS was negatively connected with CCO. Hypothesis H1 was confirmed by this empirical outcome. This can be explained by the following.
Benchmark Outcomes for Inverted U-Shaped and N-Shaped.

Note. Standard errors in parentheses.
p < .1. **p < .05. *p < .01.
Firstly, EPS encourages the use of cleaner technology by companies and consumers, which will lower the opportunity of emissions (H. L. Li et al., 2019). Secondly, EPS facilitates economic expansion and stimulates investments in creative approaches to advance environmental-friendly technologies (Razzaq et al., 2021), thereby reducing environmental pressure. Thirdly, EPS functions by building rules that increase the cost of environmental deregulation. These conclusions align with S. Li et al. (2023), who concluded that EPS increases environmental quality for BRICS countries by using the augmented mean group method. Afshan et al. (2022) demonstrated that EPS reduces CO2 emissions in OECD economies while Sezgin et al. (2021) found comparable emission reduction effects through EPS implementation in G7 and BRIC countries.
Regarding the EKC hypothesis, column (2) in Table 4 indicates that the parameter of GDP was positive while that of GDP2 was negative, confirming the inverted U-shaped pattern. This result echoes the findings of Chang et al. (2021) and Zheng et al. (2023). Column (5) in Table 4 reveals that GDP and GDP3 were positive while GDP2 was negatively associated with environmental degradation, indicating an N-shaped pattern. This conclusion is parallel to the study of Cosmas et al. (2019) for Nigeria, Shahbaz et al. (2019) for Vietnam, and Shekhawat et al. (2022) for the SAARC region. Fast economic growth can cause unfavourable environmental outcomes. These signs of parameters can be attributed to the composition effect and technical effect. Specifically, the positive coefficient of GDP is primarily driven by the composition effect: as the economy expands, there is a simultaneous increase in the consumption of non-renewable resources and a heightened level of environmental pollution accompanied by industrialisation (Bae et al., 2017). Income growth is prioritised in the economy, but there are no controls in place to mitigate the resulting environmental impact (Maduka et al., 2022). The negative sign of GDP2 can be explained by the acceptance of numerous green inventions and technologies (Ullah et al., 2024). The technical effect brought by economic growth alleviates environmental pressure. Finally, as highlighted by Fakher et al. (2023) and Ullah et al. (2024), the reduction in CCO achieved through innovation is outweighed by the increase in pollution driven by income growth, ultimately resulting in higher overall pollution levels. A similar N-shaped curve is documented by Ullah et al. (2024) for OECD countries and Fakher et al. (2023) for OPEC countries.
Regarding other control variables, trade was negatively correlated with CCO. This can be attributed to the technique effect, as described by Grossman and Krueger (1996), which states that when commerce grows, technological developments lead to the adoption of more environmentally-friendly industrial methods. This conclusion contradicts the findings of Ali, Ahmed et al. (2022), Ali, Xu et al. (2022), Dou et al. (2021), and Shahbaz et al. (2017). CPI aggravated emissions, which was demonstrated by Rahman et al. (2024). Inflation made the price of goods more expensive and results in costly renewable energy sources (K. Li et al., 2019). Finally, financial development was insignificantly correlated with environmental quality. While financial development stimulates green project investments(Tamazian et al., 2009) and foster innovation (Tadesse, 2005), this progress seems to be offset by significant increases in emissions brought on by the growth of small businesses (Zakaria & Bibi, 2019). In the end, this dual dynamic eliminates the possible environmental advantages, resulting in a neutral total effect on environmental quality.
Asymmetric Analysis
The asymmetric analysis outcomes are reported in Tables 5 and 6. As indicated in FEM of Tables 5 and 6, all the coefficients of EPS were negative with varying levels of magnitude in the selected quantiles. These findings strongly confirm hypothesis H1. The parameter of EPS declined from lower quantiles to higher quantiles. The Pollution Haven theory explains the declining parameter of EPS in the upper quantiles. Countries in upper quantiles of CCO are usually developing countries. Developed countries often move highly polluting companies to these areas to benefit from lower production costs (Levinson & Taylor, 2008). While this provides short-term economic growth and employment opportunities in countries with high carbon emissions, it also undermines the effectiveness of EPS in these countries. These results coincide with the work of Albulescu et al. (2022) and Chu and Tran (2022), who documented that EPS is more efficient in nations with better environmental quality, and when environmental deterioration increases, the efficiency of EPS decreases.
Asymmetric Analysis1.

Note. Standard errors in parentheses.
p < .1. **p < .05. *p < .01.
Asymmetric Analysis2.

Note. Standard errors in parentheses.
p < .1. **p < .05. *p < .01.
In addition, both an inverted U-shaped and an N-shaped EKC were supported by the results, as the parameters for GDP, GDP2, and GDP3 conformed with the EKC framework.
To summarise, a decreasing influence in the upper quantiles indicates that countries with severe environmental issues benefit the least from stronger environmental policies.
Robust Test
Robust Test 1: Lag the Explanatory Variable
This study re-ran Equations 3 and 4 by creating LEPS (lagging the explanatory variable by one period) and L2EPS (lagging the explanatory variable by two periods), in line with the research of Ding et al. (2023), who lagged the explanatory variable for robustness testing. The outcomes presented in Tables 7 and 8 indicate that the parameter of LEPS and L2EPS remained negative. In addition, the inverted U-shaped as well as the N-shaped EKC were also confirmed.
Lag Independent Variable for Equation 3.

Note. Standard errors in parentheses.
p < .1. **p < .05. *p < .01.
Lag Independent Variable for Equation 4.

Note. Standard errors in parentheses.
p < .1. **p < .05. *p < .01.
Robust Test 2: Change Estimate Technique
In line with Aslan et al. (2024) and Bashir et al. (2024), this study used the Driscoll-Kraay standard errors technique, which can deal with the issue of heteroscedasticity (Bashir et al., 2024). Column (1) in Table 9 validated Equation 3, where the main variable, EPS, remained negative. Additionally, an inverted U-shape EKC was observed. Column (2) in Table 9 validated Equation 4, where the main variable, EPS, also remained negative. Additionally, the existence of an N-shaped EKC was confirmed.
Change Estimate Technique.

Note. Standard errors in parentheses.
p < .1. **p < .05. *p < .01.
Causal Analysis
In line with Umar and Safi (2023), this research employed causality analysis (Dumitrescu & Hurlin, 2012) to confirm the causal nexus among the variables. Table 10 presents the granger causality analysis. The findings revealed a nexus between CCO and the explanatory and control variables. The results suggest that approaches focusing on these elements would significantly mitigate environmental degradation. By concentrating on these areas, the top 11 GDP-ranked countries can achieve their green development goals while also reducing emissions.
Causality Analysis.

Moderating Effect of EPU
In this section, the moderating role of EPU was examined. When economic uncertainty increases, the government’s efforts and investments in environmental protection can be halted or reduced, potentially leading to a weakening of the enforcement of certain environmental protection laws (Jiang et al., 2019). The interaction term (EPS × EPU) presented in Table 11 have a significant negative coefficient. This means that in circumstances when there is a lot of ambiguity, the influence of EPS on CCO is amplified. This finding provides empirical support for hypothesis H3, confirming that EPU can moderate the impact of EPS on CCO. Compliance with policies and policy signals provide an explanation for this. On the one hand, firms may be more cautious about non-compliance with regulations in a high uncertainty environment. A strict EPS supported by strong enforcement mechanisms can guarantee a greater degree of compliance, which has a more significant impact on CCO. On the other hand, businesses and industries can be more responsive to policy signals in a high uncertainty environment. When EPS is stringent, it clearly signals the direction of environmental policy, encouraging businesses to invest in cleaner technology. However, these results contradict the work of Y. Liu and Zhang (2022), who concluded that the positive relationship between environmental regulation and CO2 emissions was strengthened in an uncertain environment in China.
Moderating Effect.

Note. Standard errors in parentheses.
p < .1. **p < .05. *p < .01.
Conclusion and Policy Recommendations
Conclusion
To alleviate environmental pressures, reduce CCO, and achieve long-term environmental sustainability, policies must be implemented. This paper examined the impact of EPS on CCO in the top 11 GDP-ranked countries, the existence of the EKC, and the interaction between EPS and EPU with regards to CCO. The findings of this study indicate the following: (1) EPS significantly reduces CCO; (2) Both inverted U-shaped and N-shaped EKC patterns are observed; (3) Asymmetric analysis reveals that in higher pollution quantiles, the reduction effect of EPS is less pronounced; and (4) EPU amplifies the reduction effect of EPS on CCO.
Policy Recommendations
This study yields the following policy insights. First, the relationship between EPS and a country’s environmental degradation suggests that more stringent environmental regulations may be useful for lowering degradation. Stricter EPS should be implemented by governments to further encourage development, minimise pollution, and promote the adoption of cleaner technologies.
Second, policy makers should pay attention to efficiency and flexibility due to the asymmetric outcomes. The heterogeneous impact of EPS across different quantiles serves as a reminder that policies must be created, carried out, and enhanced in accordance with the unique conditions of every nation. Geographical areas with higher levels of pollution should be the focus of targeted environmental regulations. Stricter and sector-specific rules, including restrictions on pollution from foreign investments, emissions caps, and penalties for exceeding limits, can be effective in reducing emissions where they are most concentrated, especially since the impact of regulations tends to be weaker in high-emission nations.
Third, the government must work tirelessly to maximise EPU’s advantages and minimise its disadvantages. EPU increases the beneficial impact of EPS by halting environmental deterioration even though it may also discourage investment and consumption. Hence, establishing a strong monitoring system is essential for tracking economic uncertainty and how it affects environmental measures. Furthermore, tailoring environmental policies to accommodate varying degrees of economic uncertainty is critical. These regulations should be flexible enough to change as the economy changes. Such flexibility and adaptation are especially important in emerging countries, where economic volatility may be more noticeable. Policymakers can successfully negotiate the intricate link between EPU, environmental policies, and environmental quality by implementing these steps.
Limitation and Future Direction
This paper examined how EPS affects CCO in the top 11 GDP-ranked nations, however, it comes with some limitations. It should be noted that EKC may not hold true for all pollutants. The existence of the EKC may vary depending on the specific pollutant and other influencing factors, even though this study used CCO as a proxy for environmental degradation. Furthermore, few studies to date have used micro-level emission data. Future studies could use firm-level data to obtain more thorough results. Furthermore, EPS data are only available for OECD countries and a small number of non-OECD countries. In order to investigate the relationship and promote meaningful policy changes for a better environment, future research may look at other environmental policy indicators while taking into account less developing regions, like Africa. Finally, investigating additional mediator variables might also yield insightful information.
Footnotes
Funding
The authors disclosed receipt of the following financial support for the research, authorship, and/or publication of this article: This work was supported by the 2023 Fujian Provincial Education System Philosophy and Social Science Research Project (Grant NO. JAS23169).
Declaration of Conflicting Interests
The authors declared no potential conflicts of interest with respect to the research, authorship, and/or publication of this article.
Data Availability Statement
Data sharing not applicable to this article as no datasets were generated or analysed during the current study.