
Abstract
Based on the annual data of manufacturing enterprises and city-level data in China from 2009 to 2020, this paper employs the Dagum Gini coefficient decomposition method and the Markov chain method to conduct a detailed analysis of regional differences and the distribution characteristics of regional financial development (RFD) in China. It then examines the impact of the imbalance in the RFD structure on the green technology innovation (GTI) of manufacturing enterprises and its underlying mechanism. The study finds that China’s RFD exhibits a serious phenomenon of “strong-strong agglomeration” and “weak-weak agglomeration.” The imbalance in RFD structure exerts an inhibitory effect on the GTI of enterprises. Heterogeneity analysis reveals that this inhibitory effect is less pronounced for state-owned enterprises and large-scale enterprises, as well as for regions with strong intellectual property protection and stringent environmental regulations. Mechanism analysis indicates that the imbalance in RFD structure hinders GTI by causing excessive corporate debt. This study provides new empirical evidence on the imbalance of economic development and financial structure in China.
Keywords
Introduction
Over the past century, rapid global economic expansion has imposed a substantial environmental cost, with climate change—characterized predominantly by global warming—constituting a profound threat to human survival and long-term development. In September 2020, during the 75th session of the United Nations General Assembly, President Xi Jinping pledged that China aims to peak carbon dioxide emissions by 2030 and to achieve carbon neutrality by 2060. This commitment represents a strategic turning point in China’s response to climate change and establishes clear targets for national climate policy. Against this backdrop, the pursuit of a green economy and the acceleration of green transformation are imperative for sustainable development across all sectors in China. As a leading global manufacturer, China’s industrial sector—particularly its manufacturing firms—plays a central role in advancing a green, low-carbon, and circular economic system. While prior studies examine the impact of green credit (Z. Wang et al., 2022; Yu et al., 2022), ESG ratings (J. Wang et al., 2023), and environmental regulations (Bai et al., 2023) on corporate behavior, relatively little attention is given to how regional disparities in financial development, particularly those stemming from imbalances in financial supply structures, affect GTI in the manufacturing sector. This paper aims to address this gap.
Prior research indicates that the development of financial institutions and the deepening of financial markets facilitates corporate innovation (Tang & Wu, 2015). By easing credit constraints, well-functioning financial markets enhance firms’ access to capital, thereby encouraging greater investment in R&D and fostering more innovative outputs (L. Zhang, 2022). However, limited attention has been devoted to how the structure of financial supply affects firms’ GTI. In practice, regions with strong economic foundations and locational advantages often experience financial agglomeration, resulting in a disproportionate concentration of financial resources. In such areas, corporate sectors may face excessive leverage and overcapacity (Han et al., 2023). In contrast, many small and medium-sized cities in central and western China suffer from acute shortages of financial capital, and firms in these regions frequently encounter severe financing constraints (Zhao & Guo, 2024). These regional disparities in economic structure, stage of development, financial market maturity, and resource allocation create pronounced heterogeneity in firms’ access to financial services. The spatial concentration and diffusion of financial institutions and markets play a critical role in shaping how financial resources are allocated and utilized across regions (Jiang & Song, 2014). Despite its potential importance, the role of imbalances in the financial supply structure in influencing the heterogeneity and underlying mechanisms of GTI remains largely unexplored.
In light of these considerations, this study examines the regional heterogeneity and spatial distribution of financial development in China from the perspective of imbalances in the financial supply structure. It then further analyzes how these disparities influence GTI within the manufacturing sector. This paper contributes to the literature in several important ways. First, it applies a combined approach using the Dagum Gini coefficient decomposition and Markov chain analysis to conduct a comprehensive assessment of regional disparities and distributional patterns in financial development. This empirical strategy yields new evidence provides new evidence on the extent of regional economic inequality and structural imbalances in China’s financial system. Second, we investigate the impact of RFD on GTI from the lens of financial supply structure imbalance, incorporating heterogeneity at both the firm level and within the external environment—thereby contributing novel insights to the intersection of finance and green economic development. Third, while existing research has largely emphasized financing costs and risk mitigation channels in analyzing the role of RFD (Gu et al., 2025; Tao et al., 2017), this study highlights an alternative mechanism. Specifically, it explores how imbalances in financial supply may lead to excessive corporate leverage, thereby influencing the trajectory of GTI. This perspective enhances deepens our understanding of the channels through which RFD shapes firms’ sustainable innovation outcomes.
The rest of this paper is organized as follows: Section “Theoretical Analysis and Research Hypothesis” introduces theoretical analysis and research hypothesis. Section “Research Design” outlines the research design. Section “Results and Discussion” provides the results and discussion. Section “Further Discussion” presents further discussion. Section “Conclusion and Implications” concludes with the conclusions and implications.
Theoretical Analysis and Research Hypothesis
Spatial Distribution Characteristics of Financial Resources
Under conditions of market incompleteness, the geographic mobility and substitutability of financial resources remain inherently limited. On one hand, greater geographic distance reduces the frequency of communication between regions and exacerbates informational asymmetries. This is particularly pronounced for non-standardized “soft information,” which tends to degrade in quality as it is transmitted over longer distances (Hollander et al., 2016). On the other hand, increased spatial separation elevates the transaction costs and complexity of financial interactions, thereby intensifying market frictions. Tao et al. (2017) note that geographic distance not only raises the transportation and information costs associated with financial transactions, but also amplifies the underlying risks. As a result, financial institutions across different tiers tend to cluster geographically, giving rise to financial agglomeration effects (Hao et al., 2025; Nogueira et al., 2015). While financial agglomeration can foster the development of local financial markets—lowering financing costs and enhancing capital accessibility—it simultaneously contributes to spatial disparities in the allocation of financial resources. In particular, regions with locational advantages and stronger economic foundations tend to attract an overconcentration of financial capital, while less developed areas face chronic resource shortages. H. Zhang et al. (2016) attribute this regional financial heterogeneity to differences in financial service provision, social capital, and commercial culture across locations. These spatial frictions ultimately lead to persistent structural imbalances in the regional financial supply landscape. In the Chinese context, financial development remains highly uneven: core financial centers and adjacent urban clusters enjoy abundant capital inflows, whereas outlying regions suffer from severe financial underdevelopment. Based on these observations, this study proposes the hypothesis 1:
RFD and GTI
China’s financial system continues to exhibit significant structural imbalances in the supply of capital, often accompanied by regional misallocations. As noted by Cai (2020), conditions of both capital surplus and scarcity coexist, reflecting a deeply bifurcated financial landscape. In major financial centers, firms tend to enjoy an overabundance of credit, sometimes exceeding economically justified levels, which may lead to excessive leverage. Conversely, firms located in smaller or remote cities frequently suffer from acute financing constraints due to persistent underinvestment in local financial infrastructure. Empirical evidence supports these patterns. H. Li and Wang (2014) find that financial centers and their surrounding urban areas are endowed with abundant financial capital, significantly reducing the external financing barriers for local enterprises. In contrast, firms operating in peripheral or lower-tier cities often encounter substantial funding gaps. Similarly, Nogueira et al. (2015), using data from Brazil’s financial institutions, demonstrate that higher-tier cities concentrate financial resources, whereas lower-tier regions remain financially underserved—highlighting spatial heterogeneity in the distribution of financial capital. These regional imbalances in financial supply carry important implications for corporate innovation behavior. In capital-constrained regions, limited access to external finance restricts firms’ ability to invest in green R&D initiatives, thereby stalling progress in GTI. Paradoxically, even in capital-abundant regions, firms may experience what can be termed a “financial resource curse,” where greater credit availability is associated with lower innovation efficiency or diminished GTI outcomes (Huang et al., 2023). Based on this reasoning, we propose the hypothesis 2:
RFD, Excessive Leverage, and Corporate GTI
Imbalances in the structure of regional financial supply induce firms to accumulate excessive debt, which in turn hinders their GTI efforts. On one hand, external financing represents a double-edged sword, balancing risk and return: a moderate level of leverage optimizes this balance and generates firm value, while excessive indebtedness disrupts it by increasing interest burdens and magnifying financial risk. To mitigate such risks, corporate managers often reduce R&D expenditures, as the inherent uncertainties of innovation exacerbate financial vulnerabilities. Zeng et al. (2023) find a significant negative correlation between firms’ debt ratios and their R&D investment intensity. On the other hand, R&D activities are generally viewed unfavorably by creditors. If R&D projects fail, outstanding debts may turn into non-performing loans; if successful, creditors receive only fixed interest payments without benefiting from the upside potential. Consequently, creditors prefer firms investing in tangible fixed assets, which provide greater collateral value. Favara et al. (2017) demonstrate that creditors actively suppress firms’ R&D investments, with the degree of this suppression positively correlating with the proportion of debt held by creditors. Based on these considerations, this study proposes the hypothesis 3:
Research design
Research Methods
Dagum Gini Coefficient Method
We will use the Gini coefficient decomposition method proposed by Dagum (1997) to study and analyze the regional differences in RFD. Its specific formula is shown in Formula 1:

where G stands for the overall Gini coefficient. k represents the total number of regions (eastern region, central region, and western region), i and r represent the number of cities in each region, nj and nh represent the number of cities in regions j and h respectively, yjr and yhr represent the financial development level of any city in regions j and h respectively, and n represents the number of all cities. In this paper, n = 219,
Markov Chain Method
The Markov chain is a random process, and there is no aftereffect, that is, the conditional distribution of a variable Xt in the model only depends on Xt−1.

In Formula 2, d is the time span value of transition probability matrix. Pijt,t+d is the transfer probability of urban financial development level in a region from type i in year t to type j in year t + d. nijt,t+d represents the number of regions that belong to type i in year t but become type j after d in the sample period, and nit represents the number of regions that belong to type i in year t. If each city is divided into α types according to the level of financial development, then the α × α transition probability matrix can be constructed through the Markov chain method, and then the dynamic evolution process of each city’s financial development level can be analyzed through the relevant transition probability.
Sample Selection and Data
The empirical analysis in this study relies primarily on data drawn from several authoritative sources, including the China Research Data Service Platform (CNRDS), the RESSET database, the CSMAR database, the Wind database, the China City Statistical Yearbook, and the China Statistical Yearbook. Specifically, the CNRDS provides data on green patents filed by publicly listed companies, while the RESSET, CSMAR, and Wind databases supply firm-level information relevant to manufacturing sector listed firms required for the empirical investigation. Additionally, the China City Statistical Yearbook offers regional data at the provincial and prefecture-city levels. The empirical sample consists of two datasets covering the period from 2009 to 2020: (a) data from 219 prefecture-level and above cities across mainland China, excluding Taiwan, Hong Kong, and Macau; and (b) firm-level data on 1,944 publicly listed manufacturing companies. During data preparation, several screening procedures are implemented to ensure data quality: (a) exclusion of firms classified as ST, *ST, and PT, as well as cities and firms with substantial data omissions; (b) removal of firms listed as B-shares and H-shares; (c) elimination of firms with debt ratios below 0 or exceeding 1; and (d) winsorization of continuous variables at the 1st and 99th percentiles to mitigate the influence of extreme values.
Variable Selection
Dependent Variables
GTI (GInno). R&D expenditure, as a sunk cost, often lacks accuracy when used to directly measure a firm’s underlying innovation capacity (Hall et al., 2002). In contrast, patent counts provide a more objective and reliable indicator of innovation output (Y. Li et al., 2024). Accordingly, this study employs three proxies to capture GTI among manufacturing firms: the number of green invention patent applications (GInno_In), the number of green utility model patent applications (GInno_Um), and the combined total of these two measures, representing overall GTI output (GInno_To). Since firms do not publicly disclose green patent information in their financial statements, this study identifies green patents by matching patent data from the National Intellectual Property Administration with green technology classification codes issued by the World Intellectual Property Organization.
Key Explanatory Variables
RFD: Financial Level (FinL) and Financial Structure (FinS). To measure FinL, we adopt the concept of financial agglomeration across Chinese cities. Prior literature offers various approaches for quantifying financial agglomeration, including location quotient (H. Zhang et al., 2016), spatial Gini coefficient (Zhu et al., 2020), geographic density of financial activities (Tao et al., 2017), and the Ellison-Glaeser (E-G) index (Ellison & Glaeser, 1997). Given considerations of data availability and indicator interpretability, this study adopts the geographic density of financial activities as the preferred proxy. This is formally defined as:

where FinL denotes the level of financial development in city h at year t, FinA captures the volume of financial activity, and S represents the city’s built-up area. To characterize structural imbalances in financial supply, FinA is proxied by the year-end outstanding loan balance of financial institutions in each city, while S is measured by the size of the city’s built-up land area. The loan balance effectively reflects the vitality and maturity of local financial markets, whereas built-up land area, as a key component of China’s urbanization path, signals the spatial extent of urban development (Tao et al., 2017).
For FinS, the structure of RFD, we compute the share of each city’s financial institution loans relative to the national total. This indicator is defined as:

Control Variables
To mitigate the influence of other factors, referencing the studies of X. Wang and Wang (2021), Chen et al. (2022), and Shi et al. (2022), we select return on total assets (ROA), enterprise leverage (DAR), the proportion of independent directors (POID), the proportion of Operating Cost Ratio (OC), fixed asset ratio (Ppe), institutional shareholding ratio (Inst), cash ratio (Cash), the proportion of R&D expenditure (RD), and key monitoring (Kemo) at the enterprise level. At the macro level, the regional gross product growth rate (GDP) was selected. The individual fixed effect, province fixed effect, and industry fixed effect is controlled. The definitions of all variables are displayed in Table 1.
Variable Definitions.

Model Specification
In order to verify the impact of China’s RFD on the green technology of manufacturing enterprises from the perspective of financial supply structure imbalance. The model constructed is as follows:

In model (5), i and h represent the sample firm and the city. GInno_In, GInno_Um, GInno_To, and FinS represent the proxy variables of manufacturing GTI and RFD. X and Z are control variables at the firm and macro levels. β is the parameter to be estimated, α is the individual fixed effect, φ is the fixed effect of the manufacturing subdivision industry, δ is the provincial fixed effect, and ε is the random disturbance item.
Results and Discussion
Regional Distribution of Financial Development
To lay the groundwork for the subsequent model analysis, this study first examines the spatial distribution characteristics of RFD in China from a macroeconomic perspective. Figures 1 and 2 present the current status and temporal evolution of financial development across Chinese cities.

China’s RFD.

Financial development in Beijing, Shenzhen, and Shanghai.
Figure 1 indicates that the level of financial development in eastern China significantly outpaces that of the central and western regions, with the latter consistently remaining below the national average throughout the sample period. As illustrated in Figure 2, major financial hubs such as Shanghai, Beijing, and Shenzhen demonstrate development levels that far exceed even the average for the eastern region. These patterns highlight pronounced regional disparities in financial development across China. This heterogeneity largely arises from the concentration of foreign capital and key production factors in coastal areas with locational advantages and stronger economic foundations. This agglomeration effect drives the accumulation of financial resources in the eastern region, while the central and western regions continue to lag behind, with the development gap gradually widening over time.
Regional Disparities in China’s Financial Development
Dagum Gini Coefficient Decomposition
To assess the extent and sources of regional disparities in financial development, this study employs the Dagum Gini coefficient decomposition method. Using MATLAB 9.1, we compute the overall Gini coefficients and their decomposed components for China’s three major regions over the period from 2009 to 2020. The results of this analysis are summarized in Table 2.
Gini Coefficient Method Results.

(1) Overall Regional Disparities and Evolution in China’s Financial Development. Figure 3 illustrates the dynamic evolution of regional disparities in China’s financial development, as measured by the overall Gini coefficient. The results reveal a general downward trend over the sample period, albeit with some fluctuations. Specifically, the Gini coefficient reaches a peak in 2009 at 0.5353—the highest level observed during the sample period. Between 2010 and 2012, the coefficient declines steadily, registering a cumulative reduction of 14.83%. A modest uptick appears in 2013, with an increase of just 0.75%, followed by a continued decline through 2020, when the coefficient drops to 0.3662. Overall, the evidence indicates a gradual narrowing of regional disparities in financial development across China. This convergence is likely driven by several structural and policy factors. In the aftermath of the global financial crisis, China’s economy recovers and expands rapidly. Improvements in transportation infrastructure, the proliferation of internet connectivity, and the implementation of development-oriented policies in western regions strengthen inter-regional linkages and resource flows. These changes promote the growth of financial activity in central and western areas, thereby contributing to the reduction of overall regional disparities in financial development.

Gini coefficient of RFD.
(2) Decomposition of Intra-Regional Disparities in China’s Financial Development. ① Intra-regional disparities and their evolution. Financial development within the eastern region exhibits a three-stage pattern characterized by an initial decline, followed by an increase, and then a subsequent decrease. The intra-regional disparity in this area declines by 21.82% relative to the beginning of the sample period. The central region displays a consistent downward trend in financial development disparity, with a cumulative reduction of 41.64% during the sample period. The western region demonstrates a pronounced fluctuating decline, with an overall reduction of 33.19%. Further analysis reveals that the western region has the highest average intra-regional disparity (mean = 0.4569), followed by the eastern region (mean = 0.4054), and the central region shows the lowest disparity (mean = 0.3709). ② Inter-regional disparities decomposition. The inter-regional disparities among eastern-central, eastern-western, and central-western regions all follow fluctuating declining trends over the study period. Specifically, the eastern-central disparity follows a “decline–rise–decline” trajectory with a 32.34% reduction. Both the eastern-western and central-western disparities exhibit a “decline–rise” pattern, with reductions of 28.42% and 35.02%, respectively. Among these, the eastern-western gap remains the largest on average (mean = 0.4682), followed by the eastern-central region (mean = 0.4483), with the central-western gap being the smallest (mean = 0.4226). ③ Sources and contributions to regional disparities. The contribution of intra-regional disparities remains relatively stable throughout the observation period, consistently accounting for approximately 33% to 35% of the total disparity. In contrast, the contributions from inter-regional disparities and transvariation density show opposing trends. Overall, the contributions of intra-regional disparity, inter-regional disparity, and transvariation density are comparably significant, with mean shares of 34.00%, 30.52%, and 35.48%, respectively, indicating that all three components play important roles in shaping regional inequalities in financial development across China.
Markov Chain Results
We use Stata16 to calculate the Markov transition probability matrix of China’s RFD (Table 3).
Markov Chain Results.

Based on the results presented in Table 2, several key characteristics emerge regarding the evolution of RFD in China. Specifically:
Across different time horizons, the highest transition probabilities are consistently concentrated along the diagonal elements of the matrix, indicating that a city classified within a particular financial development category at time t has the greatest likelihood of remaining in the same category 1 to 3 years later.
As the time interval extends, the values along the diagonal decline progressively, suggesting that the persistence of financial development status diminishes over longer periods, while the probability of cities transitioning between different states correspondingly increases.
With increasing time spans, the probability of cities with lower financial development levels advancing to higher tiers gradually rises, as does the probability of high-level cities regressing to lower categories. Notably, cities classified at low and lower-middle levels exhibit a stronger tendency to remain below the upper-middle level, while upper-middle-level cities face a higher likelihood of downward transition. Conversely, high-level cities demonstrate a very high probability of maintaining their original status.
These patterns collectively illustrate a pronounced spatial clustering phenomenon within China’s regional financial landscape, characterized by “strong-to-strong” and “weak-to-weak” agglomerations. The upward mobility of lower-level cities is relatively limited, whereas high-level cities display significant persistence and stability. The only exception is the upper-middle tier, where cities show a notable propensity to slip to lower levels.
Benchmark Analysis
Table 4 presents the baseline regression results. Columns (1), (3), and (5) report estimates from models excluding control variables, while columns (2), (4), and (6) incorporate both firm-level and macroeconomic controls. The results consistently indicate that the structure of RFD (FinS) exerts a statistically significant negative effect on firms’ GTI, measured by the number of green invention patent applications, green utility model patent applications, and the overall volume of GTI. These findings align with those of Han et al. (2023), suggesting that imbalances in RFD lead to the simultaneous over- and under-supply of financial resources across regions, thereby hindering firms’ efforts in green technology R&D. This evidence supports H2.
Benchmark Results.

p < .01.
Robustness Tests
Alternative Measure for GTI
This study uses two additional measures to capture firms’ GTI. First, the logarithm of (the number of authorized green patents + 1) is used, represented by GInno_In2, GInno_Um2, and GInno_To2. Second, the logarithm of (the total number of patent applications + 1) is also used as an alternative measure (Inno), following the approach of Q. Li and Xiao (2020). The reestimation results are shown in Table 5. Re-estimation results show that the coefficient on FinS remains significantly negative at the 1% level, consistent with the findings reported in Table 4.
Robustness Tests (1).

p < .05. ***p < .01.
Alternative Measure for RFD
We use the proportion of deposit balance of urban financial institutions in the total national deposits to re-measure RFD. The reestimation results are shown in Table 6. The regression coefficient of FinS2 is still significantly negative, indicating that the conclusions in Table 4 are basically established.
Robustness Tests (2).

p < .01.
Consider the Green Patent Cycle
Given the inherent complexity, high innovation threshold, and extended development timeline associated with green patents, this study adopts the approach of He and Tian (2013) and X. Wang and Wang (2021), employing the number of green patent applications in years t+1 and t+2 as alternative measures of firms’ GTI. The model is re-estimated accordingly, and the results are presented in Table 7. The findings show that the coefficient on FinS remains significantly negative at the 1% level, supporting the robustness of the baseline results reported in Table 4.
Robustness Tests (3).

p < .1. **p < .05. ***p < .01.
Consider Sample Selection
To address potential inconsistencies resulting from the 2017 revision of patent classification standards, this study excludes data from 2017 to 2020 and re-estimates the model accordingly. As presented in Table 8, after omitting the 2017 and 2018 observations, the coefficient on FinS remains significantly negative at the 1% level, consistent with the baseline findings reported in Table 4.
Robustness Tests (4).

p < .01.
Instrumental Variable Method
For the selection of instrumental variables, this study employs the lagged values of urban–rural household savings balances and the number of employees in the financial sector at the city level. These instruments satisfy the exogeneity condition, as household saving behavior is primarily influenced by individual preferences and is not directly related to firms’ investment decisions. Similarly, employment levels in the financial sector are unlikely to be endogenously determined by firm-level GTI. At the same time, household savings serve as a key funding source for financial institutions, and their scale directly influences the extent of local financial development. Moreover, the number of financial sector employees is strongly associated with the magnitude of financial activity. Therefore, these variables meet the relevance criterion as well (Tao et al., 2017). As shown in Table 9, the instrumental variable regression results reveal that the coefficient on FinS remains significantly negative, consistent with the baseline findings reported in Table 4.
Robustness Tests (5).

p < .1. ***p < .01.
Further Discussion
Heterogeneity Analysis
Enterprise Characteristics
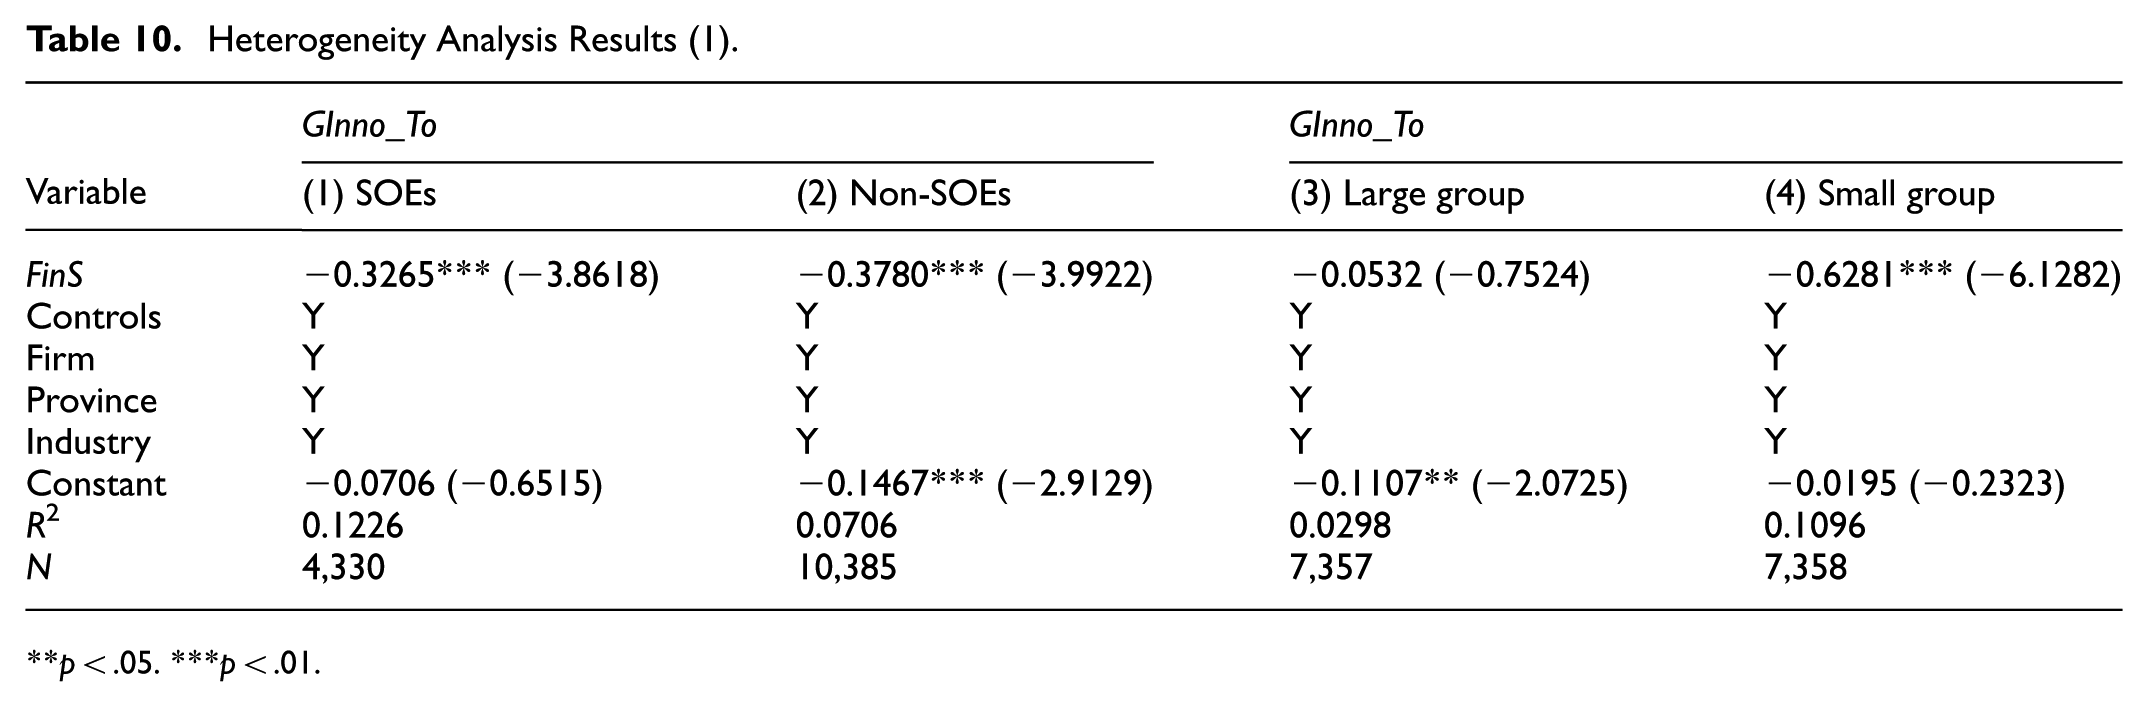
This study examines the heterogeneous impact of the green finance pilot zone policy on emission reduction, emphasizing differences arising from firm-specific characteristics. To explore this issue, the full sample is divided by firm size and ownership type, yielding subsamples of large and small firms, and state-owned and non-state-owned enterprises. The group-specific regression results are presented in Table 10.
Heterogeneity Analysis Results (1).
p < .05. ***p < .01.
For clarity, Regional Financial Development (RFD) refers to the overall state of a regional financial system, encompassing the efficiency of financial resource allocation, the institutional soundness of financial markets, and the balance of financial structures. In the empirical analysis, FinL and FinS serve as proxy variables for the level of financial resource allocation and the structural balance of financial resources, respectively. Green Technology Innovation (GTI) captures firms’ efforts in researching, developing, and applying environmentally friendly technologies, including energy-saving equipment and low-carbon production processes.
The results show that the coefficient of FinS on GTI is −0.3265 for state-owned enterprises (SOEs) and −0.3780 for non-SOEs, both significant at the 1% level. Moreover, the effect of FinS is statistically insignificant for large firms, whereas it is significantly negative and stronger for small firms, with a coefficient of −0.6281 at the 1% level. These findings suggest that implicit guarantees from governmental bodies and state-owned financial institutions may buffer SOEs against the constraints imposed by structural imbalances in regional financial development. Likewise, the diversified financing channels accessible to large firms appear to mitigate the adverse effects of such distortions in regional financial systems.
Enterprise External Environment
With respect to external environmental factors, this study further segments the sample based on regional variations in intellectual property (IP) protection and environmental regulation intensity. Specifically, regions are classified into subgroups characterized by high versus low IP protection and high versus low environmental regulation levels. The level of IP protection is proxied by the ratio of the number of IP-related court case closures to regional GDP, while the intensity of environmental regulation is measured by the total amount of pollution discharge fees collected at the provincial level. Table 11 presents the subgroup regression results.
Heterogeneity Analysis Results (2).

p < .05. ***p < .01.
The results indicate that in regions with stronger IP protection, the estimated coefficient of FinS is −0.4131, whereas in regions with weaker IP protection it is −1.9925, both significant at the 1% level. Similarly, in areas with stricter environmental regulation, the estimated coefficient is −0.1809, compared with −0.7639 in other regions, again significant at the 1% level. These findings suggest that the adverse impact of imbalances in RFD is substantially mitigated in regions with stronger IP protection and stricter environmental regulation, while the negative effect is more pronounced in regions with weaker institutional and regulatory frameworks. Stronger IP protection reduces the risk of misappropriation of innovation outcomes, enhances the expected returns on R&D activities, and facilitates the reallocation of financial resources toward high-tech and high–value-added sectors. Likewise, stringent environmental regulation increases the cost of pollution, thereby compelling firms to accelerate their green transformation.
Corporate Excessive Indebtedness
We draw on the practices of Denis and McKeon (2012) to further split corporate debt into reasonable debt level (FDAR) and excessive debt level (ODAR). The FDAR of an enterprise is determined by the growth rate of total assets (AssG), return on total assets (ROA), the ratio of fixed assets to total assets (Ppe), enterprise size (Asset), median industry debt ratio (MDAR), property rights (Soe), and the shareholding ratio of the largest shareholder (SH) lagging one period. The Tobit model is constructed as follows:

Use the model (6) to conduct annual regression on the manufacturing sample enterprises, and obtain the fitting value of the enterprise’s FDAR. Finally, we use the actual asset-liability ratio of the enterprise minus FDAR to obtain the company’s ODAR.
Table 12 reports the results of the mediation analysis that examines whether corporate over-indebtedness serves as a transmission channel. In column (1), the estimated coefficient of FinS is 0.0515 and statistically significant at the 1% level, indicating that distortions in the financial supply structure contribute to higher levels of corporate debt. In columns (2), (3), and (4), the estimated coefficients of ODAR on GInno_In, GInno_Um, and GInno_To are −0.3877, −0.2988, and −0.5029, respectively, all significant at the 1% level. Collectively, the results in Table 12 suggest that imbalances in RFD hinder GTI through the channel of increased financial leverage. These findings provide empirical support for H3, which posits that over-indebtedness constitutes a key mechanism linking financial structure distortions to GTI performance.
Mechanism Estimation Results.

p < .1. ***p < .01.
Conclusion and Implications
This study draws on annual data from Chinese manufacturing firms and city-level statistics spanning the period 2009 to 2020. Using the Dagum Gini coefficient decomposition and the Markov chain approach, it provides a detailed analysis of regional disparities and distributional dynamics in China’s financial development. Building on this foundation, the study examines how imbalances in the structure of financial supply influence GTI in the manufacturing sector. The key findings are as follows. First, RFD in China exhibits pronounced spatial disparities. Although the overall gap declines over time, it remains substantial. The distribution displays a “strong–strong” and “weak–weak” clustering pattern, reflecting persistent divergence and limited upward mobility for financially underdeveloped regions. Second, structural imbalances in regional financial systems significantly constrain GTI among manufacturing firms. Third, heterogeneity analysis indicates that the adverse impact of financial imbalances is less severe for state-owned and large-scale enterprises, likely due to more stable financing access and implicit guarantees. In addition, the negative effects are weaker in regions with stronger intellectual property rights protection and stricter environmental regulations, suggesting that institutional quality mitigates the consequences of financial structural distortions. Finally, the mechanism analysis reveals that excessive corporate leverage acts as a mediating channel through which financial supply imbalances inhibit GTI.
This study offers the following policy recommendations. First, it is essential to improve the spatial allocation of financial resources by promoting more balanced interregional capital flows. Fiscal transfers, tax-sharing arrangements, and performance-based incentives help channel financial capital from regions with strong financial agglomeration to underdeveloped areas. For instance, a regional financial cooperation fund may be established to support targeted initiatives such as green finance and technology-driven financial services in economically disadvantaged regions. Second, a differentiated policy approach is necessary to mitigate the adverse effects of financial imbalances on GTI. On the one hand, state-owned enterprises are encouraged to create GTI funds that support technological upgrading along the industrial value chain. These initiatives generate positive externalities and stimulate GTI among small and medium-sized enterprises through industrial collaboration and technological spillovers. On the other hand, policy priorities should focus on developing advanced financial segments—such as green finance and technology finance—and supporting the creation of regional centers for GTI. Enhancing interconnectivity among carbon trading markets also facilitates the expansion and integration of the green finance ecosystem. Third, the corporate financing environment should be optimized to reduce the risk of excessive leverage. Regulatory bodies are advised to implement real-time monitoring of leverage ratios within the manufacturing sector and restrict additional borrowing by highly indebted firms. Financial institutions should regularly perform stress testing to assess the potential impact of structural financial imbalances on corporate balance sheets. For green technology firms experiencing financial distress due to over-leverage, tailored support measures—such as judicial restructuring and debt reorganization—should be introduced to preserve core technological assets and sustain innovation capacity.
Nevertheless, this study has certain limitations. First, it focuses solely on the short-term effects of RFD structural imbalances on firms’ GTI, without examining potential long-term dynamics. Second, the analysis is confined to the manufacturing sector, leaving other industries and possible cross-sectoral differences unexplored. Third, with respect to methodological limitations, potential endogeneity issues in the model cannot be fully avoided. Moreover, the possibility of sample selection bias cannot be entirely ruled out, as firms included in the analysis may differ systematically from those excluded. These limitations do not undermine the validity of the findings but highlight areas for future research to strengthen causal inference and broaden the scope of analysis.
Footnotes
Ethical Considerations
This research did not involve human or animal participants.
Funding
This work was supported by the Research on the Mechanism and Impact Path of Green Finance in Promoting Green Transformation in the Manufacturing Industry (ZR2025QC767) and Research on the Model, Mechanism, and Incentive Policy for Artificial Intelligence-Driven Tiered Diagnosis and Treatment (ZR2025QC1256).
Declaration of Conflicting Interests
The authors declared no potential conflicts of interest with respect to the research, authorship, and/or publication of this article.
Data Availability Statement
All data generated or analyzed during this study are included in this article. What’s more, the data and materials used in this paper are available from the corresponding author on reasonable request.