
Abstract
The digital economy offers a strategy for grasping new opportunities in the latest technological revolution and industrial change. The study of location about digital industry is essential for the digital progress of the Yellow River Basin (YRB). Selecting 687,117 digital industry enterprises in YRB of China from 1994 to 2021 as a sample, this study uses a standard deviation ellipse, nuclear density estimation, average nearest neighbor index, and geographic detector to explore the digital industry’s spatial evolution scale in the YRB and its driving factors. The results indicate that (1) digital industry enterprises in the YRB have experienced the development process of “dispersal followed by agglomeration,” generally showing a trend of “east (slightly north) - west (slightly south)” agglomeration. It has apparent socioeconomic preferences, offering a core circular structure that gradually spreads to the peripheral regions based on provincial capital cities; (2) there is an obvious imbalance in the advancement of the service-oriented and digital manufacturing industries in the YRB. The trend of change in the aggregation degree of the manufacturing digital industry during 1994 to 2021 is slight, while the direction of change in the aggregation degree of the service-oriented digital industry is significant; (3) market potential factors such as the innovation development level, innovation, and entrepreneurship vitality, and digital agglomeration factors such as the informatization development level have a stronger impact on the spatial advancement of the digital industry in the YRB, while economic development level factors such as the economic fundamentals and industrial structure have a weaker impact.
Introductory
Owing to information technology’s development, the global digital economy is developing rapidly and has become an essential point of contention for new advantages in regional competition. The digital economy of China is increasing, and its scale will reach 50.2 trillion yuan by 2022, the total amount of which will rank second in the world, accounting for 41.5% of the gross domestic product (GDP) development value (CAC, 2022), thus becoming a key driver of China’s stable economic growth and a power source for regional high-quality development. As a significant strategic area in China, the Yellow River Basin (YRB) is the primary country’s strategy for environmental protection and high-quality products.
The Yellow River Basin has a unique geographical location and ecological characteristics, playing an important role in the national strategy for environmental protection and high-quality development. In 2021, the “Outline of Ecological Protection and High-Quality Development Plan for the Yellow River Basin” is released by the Chinese government. The outline explicitly states that it will vigorously push forward the new infrastructure construction, such as digital information, increase the industrial Internet penetration rate and drive the eco-friendly transition of conventional industries to inject new vitality into the higher quality development of the YRB through the digital economy. Digitalization is a key driver of the modern economy, with its foundation being the digital industry. The central government aims to inject new vitality into the high-quality development of the YRB through the digital economy.
The YRB flows through most of the northern provinces of China, there are many ecologically fragile and economically underdeveloped areas. The development of the digital economy in the Yellow River Basin is still lagging behind due to constraints related to ecological protection, geographical characteristics, and economic infrastructure.
It is observable that as the digital economy rapidly grows, the development gap between regions in China is also becoming more apparent, particularly the differences between the East and West, as well as the North and South. As an important region in northern China, the development of the digital industry in the YRB shows significant disparities compared to the southeastern coastal areas or the Yangtze River Economic Belt. Currently, the development level of digital economy in the Yellow River Basin is relatively low. Moreover, the development disparity within the basin is stark, with pronounced imbalances between different regions. In contrast, the southeastern coastal areas and the Yangtze River Economic Belt boast numerous digital giants and high-tech enterprises with large-scale digital economies, where the digital economy accounts for a higher proportion of GDP. The disparity in digital economic development across regions in China has further widened the overall economic gap, creating a larger economic divide. Given the significant importance of digitalization in economic development at present, researching the characteristics and driving factors of the digital industry in the YRB, is not only vital to the economic development of northern provinces but also holds significant importance for exploring balanced models of ecological protection, economic growth, and regional development in China.
The concept of digital industry emerges in the context of the digital economy. Tapscott (1996) first conceptualized it in the book whose name is “The Digital Economy: Promise and Peril in the Age of Networked Intelligence.” With the development of the information age, scholars worldwide have different understandings about meaning of digital economy. However, it is gradually becoming regarded as an economy that stems from digital technique (Carlsson, 2004; Williams, 2021). The digital economy is a combination of economic activities conducted to increase efficiency and refine the economic structure by considering digital instructions and information as important production factors, contemporary information networks as the leading carriers, and information and communication technology as the main driving force (Bukht & Heeks, 2018; OECD, 2017). The digital economy encompasses digital industrialization, which is ICT industry, regards data as a fundamental industry resource of digital economy, and industrial digitization, which promotes new business forms, modes, and development through the convergence and integration of data resources and industries (CAICT, 2020; Kallal et al., 2021). Based on the above discussion, we define the digital industry as industries driven primarily by digital technologies, encompassing fields such as information technology, the Internet, artificial intelligence, big data, cloud computing, and the Internet of Things. The digital industry leverages these technologies to enhance production efficiency, innovate business models, and optimize resource allocation, thereby driving economic growth and social progress.
A scientific portrayal of the evolution of the digital industry spatial pattern in the YRB is an essential necessary condition for promoting the digital industry’s development and accelerating industrial upgrading and transformation. Along with the wave of digitization, the evolution of digital sector spatial patterns and drivers have received wide attention from scholars. At the level of research methods, current research is primarily based on macro-statistical data, such as comprehensive index of digital economy development released by different organizations, or the constructs of a digital economy development indicator system using methods such as GIS spatial analysis (Luo & Zhou, 2022; Song et al., 2022). These studies lack comparative studies on enterprise microdata and different types of digital industries, and it is usually difficult to describe changes accurately in the spatial distribution of digital industries over time. In terms of research scales, existing studies have mainly focused on provincial, city (Luo & Zhou, 2022; M. Song et al., 2022), or economic basin like Yangtze River Economic (J. Zhang et al., 2022). As an important economic belt in northern China, the Yellow River Basin has not yet been discussed as an object of discussion.
Regarding the study of the driving factors for the digital industries' location selection, traditional location factors remain essential for locating digital enterprises. Conventional spatial location theory uses essential elements to explain the characteristics of digital industries distribution and evolutionary trends such as accessibility of location, market magnitude and potential, socioeconomic development level, and factor endowment, etc. (Z. Li & Liu, 2021; Narula & Santangelo, 2009; J. Wang et al., 2021; Xiao et al., 2023; J. Zhang et al., 2022; Zhu & Chen, 2022). For example, it has been found that information and communication technology (ICT) firms tend to choose locations near their former industrial agglomerations to fully exploit agglomeration effects (J. Wang et al., 2021; J. Zhang et al., 2022).
However, with the rapid development of ICT, the geographical limitations of capital and knowledge resources that are crucial to the digital industry have been broken (McCann & Sheppard, 2003). The explanatory power of traditional location theory for location selection in digital industries has begun to weaken (K. Wu et al., 2023). The importance of emerging location factors, such as human capital, regulatory framework, and innovation capacity, is gradually appearing, which can better interpret the s2pace distribution characteristics and the digital industry’s evolution trends (Ernesto et al., 2024; Forman et al., 2005; Kim & Park, 2015; Maurseth & Frank, 2009; Z. Song & Liu, 2013; Vicente & Suire, 2007; J. Wang et al., 2022). However, the specific motivating factors of digital enterprise site selection require further testing.
This study collected data on more than 680,000 digital industry enterprises in the YRB from 1982 to 2021. Geographical distribution features of the digital industry and evolutionary trends in the YRB were analyzed and explained using the ArcGIS spatial analysis method. It also analyzes the evolution and drivers of the digital industry structure in the YRB in terms of conventional and emerging location factors by establishing a geographic detector model. The research findings of this article will provide an essential rationale and policy reference for optimizing the spatial layout of digital industries in the YRB and facilitating the digital economy growth in the YRB.
The main differences and possible contributions between this article and existing research are mainly reflected in the following three aspects:
First, regarding the research subject, we focus on the digital industry in the Yellow River Basin. Most existing research has concentrated on issues at the national, regional, and urban levels (Corradini et al., 2021; W. Chen et al., 2023; Hellwig, 2023; Z. Li & Liu, 2021; Maurseth & Frank, 2009; L. Zhang, 2024; X. Zhang et al., 2023). In China, previous studies at the regional level have mainly focused on analyzing the development of the digital industry in the Yangtze River Economic Belt and the Pearl River Delta (W. Li et al., 2024; L. Zhang, 2024). However, there has been limited attention paid to the digital industry in the Yellow River Basin. As a crucial northern region of China, the Yellow River Basin urgently needs to seize opportunities for digital development to enhance its economic level and establish a development model that aligns with the Yangtze River Economic Belt. As the foundation for the development of the digital economy, discussions surrounding the digital industry are vital for elevating the digital economic level of the Yellow River Basin and promoting interregional balanced development.
Second, in terms of research data, we utilized a long-term firm-level data. Differs from others that utilize meso- and macro-level data, we compile a longitudinal micro-level dataset encompassing over 600,000 entries from 39 years (1984–2021). Due to the difficulty in obtaining micro level data, previous studies have mostly focused on analyzing meso- and macro level data, such as regional digital economy scale, industry output value, etc. (W. Chen et al., 2023; Z. Li & Liu, 2021). These types of research data are easy to collect and can provide insights into the development trends of digital industries or markets through analysis. However, they cannot explore the characteristics of enterprise distribution at the micro level. This article uses long-term data to provide a more comprehensive analysis of the development trend of the digital industry in the Yellow River Basin.
Lastly, regarding research content, this study emphasizes the synergistic effects of multiple factors, particularly the integrated influence of market potential, policy and institutional factors, and digital agglomeration. We also analyze the influencing factors of the digital industry sub-sectors. Previous studies have predominantly employed methods such as OLS and geographically weighted regression (GWR) to discuss influencing factors (Kashki et al., 2021; Shabrina et al.,2021; D. Wu, 2020). In contrast, we attempt to utilize geographical detector model (GDM) to analyze driving factors and discuss their interactions, which helps to gain a more comprehensive understanding of the complexity of digital industry development.
The others of this article are set up as follows. Section Study Area outlines the research areas, the Yellow River Basin (YRB). In Section Data and Method, the data and models employed in the study are presented. The spatial differentiation characteristics of the digital industry in the YRB are discussed in Section Spatial Differentiation Characteristics. The driving factors behind the digital industry location in the YRB are analyzed in Section Driving Factors of Spatial Divergence of Digital Industry Development. Finally, Section Conclusions and Recommendations summarizes this study.
Study Area
The YRB is a geological ecological area that is influenced by the Yellow River system from its origin to the ocean. The basin originates in the Bayan Kara Mountains in Qinghai Province, China, traverses nine provinces, including Qinghai, Sichuan, Gansu, Ningxia, Inner Mongolia, Shaanxi, Shanxi, Henan, and Shandong, and is ultimately injected into the Bohai Sea in Kenli District, Dong ying City, Shandong Province. It covers an area of approximately 795,000 square kilometers, or 8.52% of the country’s total land area. The total population of the YRB is expected to reach 421 million in 2022, accounting for 29.79% of the country’s overall population. Within the same year, the total gross domestic product (GDP) of the YRB was 30.70 trillion yuan, contributing to 25.37% of China’s GDP.
In view of the natural YRB, this study maintained the completeness of the geographical units as much as possible and respected the human environment of the YRB. Based on the principle of being radiated by the Yellow River and regional development being directly related to the YRB, we drew on relevant research results (Kong et al., 2024), According to the accessibility of data, 80 cities in nine provinces (districts) through which the Yellow River flows are listed as the scope of the analysis area. An overview of these specific regions is shown in Figure 1.
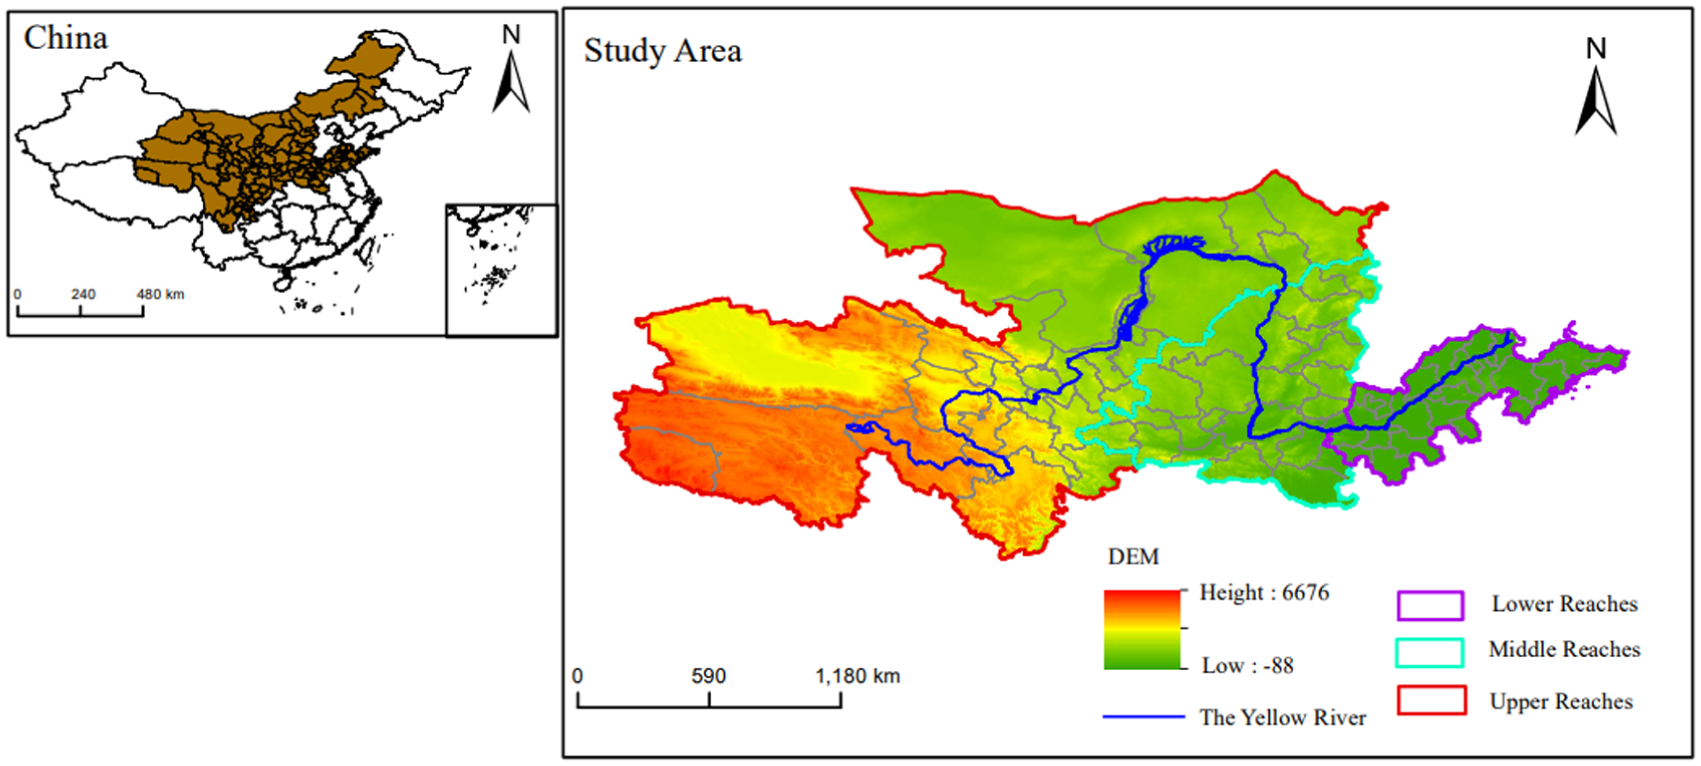
Schematic of the study area in the YRB.
Data and Method
Data
With its widespread spread and mushroom growth, the digital economy has turn into a new point of contention for regional competitive advantage. Digital industries are critical to the advancement of digital economy. Thanks to the variations in the degree of social and economic progress and the cultural background of diverse nations and regions, the conceptual connotation and statistical classification of the digital economy, especially the digital industry, have not yet formed a unified consensus, resulting in marked disparities in the digital economy scope as measured by distinct institutions (Ahmad & Ribarsky, 2018; Barefoot et al., 2018; Kevin et al., 2018; Mesenbourg, 2001; Mitchell, 2018). In 2018, the U.S. Department of Commerce’s Bureau of Economic Analysis defined the digital industry as (1) the digital infrastructure necessary for the presence and functioning of computer networks, (2) online transactions that occur through e-commerce systems, and (3) the content generated and browsed by users within the digital media of the digital economy (Kevin et al., 2018).
In 2022, the “White Paper on Global Digital Economy Development,” published by the China Information and Communication Technology Academy, emphasized that the digital industry is an information technology industry that is based on modern information technology and market-oriented and includes industries such as the electronic information technology manufacturing sector, the telecommunications sector, the computer programs and information technology services sector, and the Internet sector (Du et al., 2023). On this basis, considering the data accessibility, this study classifies enterprises in the digital industry into four broad categories: computer communications and other electronic device manufacturing industries, information transmission services industry, software and information technology services industry, and Internet and related services industry. The digital industry is further spilt into the following classification, manufacturing and services (Table 1), which describe the spatial development pattern of the digital industry and the different types of digital industry enterprises in the YRB.
Classification of Core Industries in the Digital Economy.

Note. The National Economic Industry Classification Code (GB/T4754-2017) is the national standard of the People’s Republic of China that specifies the classification and codes of economic activities for society as a whole.
The data processing of this study is as follows: First, based on the definition of digital industry enterprises and regional and industrial classifications, we obtained over 680,000 pieces of industrial and commercial registration information of digital industry enterprises in the YRB from “TianYanCha.com” covering 1982 to 2021. Second, via the Baidu API and Python software, we acquired the latitude and longitude coordinates of each digital enterprise, and further verified, screened, and removed invalid enterprise samples by cross-referencing with the YRB’s spatial scope. Finally, we used ArcGIS 10.6 to convert the geographic coordinates of 687,117 digital industry enterprises across 80 YRB cities into projected coordinate data. Data validity is discussed in Appendix B.
Method
Nuclear Density Estimation
To examine the spatial pattern of digital industry agglomeration in the YRB, this study uses projected coordinates of local digital industry enterprises as “points,” draws on the method of Zhang et al. (2021), and adopts kernel density calculation. When the kernel density value is high, it indicates a high degree of concentration of the point data, and vice versa, it indicates a low degree of attention. The formula used for this analysis is as follows:

where
Drawing on the YRB’s digital industry landscape, we chose a 3 km search radius. With kernel density mapping, we analyzed its agglomeration characteristics and type distribution.
Standard Deviation Ellipse (SDE)
We employed the standard deviation ellipse (SDE) method to analyze the spatial evolution of digital industry aggregation in the YRB (1982–2021), examining changes in gravity center, extent, intensity, and orientation. A smaller SDE area and reduced standard deviation between axes indicate stronger aggregation, while larger values suggest dispersion. The formula is defined as follows:

Where


where x and y are the element coordinates,
The sample covariance matrix is transformed into a canonical form, enabling its representation in terms of eigenvalues and eigenvectors. Thus, the normative deviations of the x and y axes are

This study measured the characteristic ellipse of digital industry distribution in the YRB using ArcGIS 10.6. The output ellipse was set to one standard deviation, covering 68% of input features. We analyzed the directional distribution, centers, and scale change trends of the YRB’s digital industry.
Nearest Neighbor Index (NNI)
We employed the NNI method to analyze the evolving spatial patterns of service-oriented and manufacturing digital enterprises in the YRB from 1982 to 2021, quantifying their characteristics and disparities. The spatial distribution pattern is evaluated based on the ratio of the observed nearest neighbor distance to the expected distance under the assumption of random distribution. The formula is as follows:

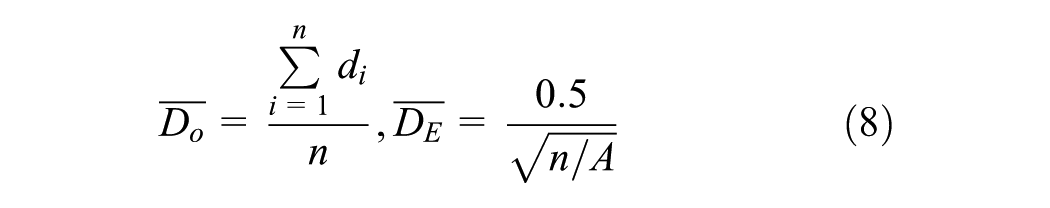
where ANN is the average nearest-neighbor index;
The average nearest neighbor index (ANN) is usually classified into three types:
If ANN < 1, it means that the elemental points tend to be clustered;
If ANN > 1, it means that the elemental points tend to be dispersed;
If ANN = 1, it means that the elemental points show a random distribution pattern.
In addition, to better reflect the degree of deviation between the measured average distance and the expected average distance, the normal distribution test was used to obtain the Z-value and p-value to effectively portray the proximity of the enterprise’s location to explore clustering degree of the digital industry in the YRB.
Geodetector Model (GDM)
The Geodetector model is a method to reveal drivers of spatial differentiation, with its basic idea based on the following assumptions (Ma et al., 2023; Y. Song et al., 2020): if an independent variable significantly affects the dependent variable, their spatial distributions should be analogous. This study primarily used factor identification and interaction detection in the model to identify key drivers of spatial disparities in the YRB’s digital industry enterprises, as well as interactions between different factors (Z. Li & Liu, 2021). Measured by the q-value, the expression is


where N and
Spatial Differentiation Characteristics
Analysis of the Development Stage
From 1982 to 2021, the number of corporations in the digital industry in the YRB will increase from 10 to 67,405, indicating a growth spurt. However, the magnitude of the change varies significantly from year to year and offers a clear developmental phase. As shown in Figure 2, the advancement of the digital industry in the YRB can be divided into four stages.

Number of enterprises in the digital industry in the YRB, 1982 to 2021.
Budding stage (1982–1993): Before the official linkup of China to the international internet in 1994, the digital industry was at an exploratory stage of development. During this period, the count of digital industry enterprises increased from 10 in 1982 to 1,191 in 1993, and the quantity of service-oriented digital industry was approximately the same as that of manufacturing-oriented digital industry enterprises.
Preliminary development stage (1994–2003): The official linkup of China to the international internet in 1994 led to the advancement of the digital industry in the YRB. Although the pace of growth slowed due to the impact of the Internet bubble in the United States in 2000, an increasing number of enterprises are still aware of the enormous development potential of the information industry. At this point, the quantity of service-oriented digital industry enterprises increased significantly (Z. Li & Liu, 2021).
Fluctuating development stage (2004–2011): As the digital industry continues to grow and develop in 2004, more than 15,000 digital industry enterprises were located in the YRB. However, in the following 8 years, development of the digital industry was limited by the subprime mortgage crisis.
Mature development stage (2012–2021): The number of digital economy enterprises in the YRB is increasing by more than nine times, from 11,637 in 2012 to 112,235 in 2019, with a significant increase in development speed. However, after 2019, a substantial decline in the number of digital industry companies occurred because of the pandemic (Du et al., 2023).
Owing to the limited number of digital industry enterprises in the budding stage, the data analysis results had significant errors and small reference values. Hence, this study selected five-time nodes, namely, 1994, 2004, 2012, 2019, and 2021, to delve into the spatial features of the advancement of the digital industry in the YRB. Simultaneously, due to the different evolutions of manufacturing and service-oriented digital industries, their share in the digital industry has also changed significantly. Therefore, the two are separated to further analyze the evolution and layout of the digital industry in the YRB.
Evolution of the Spatial Pattern
Basically, the distribution pattern of the number of digital industry enterprises in the YRB remained midstream and downstream>upstream. From the time dimension, the provinces in the YRB maintained a yearly upward trend, highlighting that the spatial differences in the 5 years of 1994, 2004, 2012, 2019, and 2021 did not change significantly. Regarding spatial dimension, the amount of enterprises in the digital industry in the five characterized years shows the characteristic of “midstream and downstream>upstream.”
In 1994, the quantity of digital industry companies in cities in the midstream and downstream of the digital industry in the YRB totaled 577 (85.86%), whereas 95 (14.14%) were located in the upper reaches. Compared with 1994, the quantity of digital industry enterprises in the YRB increased to 112,235 in 2019, of which 106,092 (94.5267%) were in the midstream and downstream and 6,143 (5.4733%) were in the upstream. The share of digital industry enterprises in the midstream and downstream of the YRB will decrease by 2022 (91.2974%), but it will still be higher than the share in the upstream (8.7026%). Although the quantity of enterprises in the upper, middle, and lower zones has expanded several times, the increase in the proportion of digital enterprises in the midstream and downstream and the decline in the percentage of digital enterprises in the upstream have made the “stepped” distribution pattern of the YRB more obvious.
Furthermore, from Figure 3, It is evident that the digital industry has apparent economic and social preferences, and provincial capitals have become the preferred places for enterprises. From 1994 to 2021, there is no notable change in the rankings of digital industry enterprises in the top regions of the YRB. The number of digital industry enterprises in provincial capitals is significantly higher than that in non-provincial capitals, and the number in better economic regions in the east is considerably higher than that in the more economically backward areas of the west. The number of digital industry enterprises in Zhengzhou, Qingdao, Jinan, and Weifang in the downstream region and in Xi’an and Taiyuan in the midstream region were ranked among the top 10 in the YRB. Xianyang in the upstream region and Liaocheng, Heze, and Zibo in the downstream area were among the top 10 regions in 2019 and 2021. Therefore, the distribution of the digital industry is highly consistent with the hierarchy and scale of the city, and regions with superior geographical locations, abundant human resources, and solid industrial foundations will become the preferred places for digital industry enterprises.

Spatial distribution of the number of digital industry enterprises in the YRB. (a) 1994; (b) 2004; (c) 2012; (d) 2019; and (e) 2021.
Spatial Agglomeration Characteristics
Agglomeration Development Dynamics
Overall, from 1994 to 2021, the digital industry in the YRB experienced an evolutionary process of “dispersion followed by agglomeration.” It is apparent that in the ellipse of standard deviation of the five characteristic years that the size of the ellipse of standard deviation of the digital industry in the YRB was largest in 2004 (591,933.90 km2), and smallest in 2019 (378,349.67 km2). This reflects the distinctive feature of digital industry agglomeration in the YRB from 1994 to 2019: “dispersion, followed by agglomeration.” However, the clustering trend of digital industries declined after 2019 owing to COVID-19 in 2019. In addition, as shown in Figure 4, the ellipse of standard deviation is not widely distributed but encompasses most of the midstream and downstream of the city, reflecting the apparent economic and social preferences of the digital industry layout in the YRB.

Standard deviation ellipse of the spatial distribution of digital industries in the YRB.
An analysis of the azimuthal angle of the ellipse of standard deviation revealed that the azimuthal arc of the ellipse of standard deviation increased from 88.31° in 1994 to 92.65° in 2012, and then descended to 85.19° in 2021. This shows that during the 28 years, the direction of digital industry enterprises in the YRB changed. Still, the magnitude is relatively tiny, basically maintaining the distribution trend of “east (a little north)–west (a little south).”
The center of the ellipse shows a “south then east” trajectory. In 1994, 2004, and 2012, the digital industry center in the YRB gradually migrated to the west; in 2019, it migrated to the south within Jincheng City (35.43°N, 112.46°E); and in 2021, it migrated to the northeast within Anyang City (36.04°N, 114.03°E).
In summary, through the standard deviation ellipse of five characteristic years of digital industry enterprises in the YRB, it is found that the digital industry in the YRB generally exhibits the agglomeration development trend of “east (slightly north)–west (slightly south)” (Figure 4).
Clustered Distribution Characteristics
Figure 5 shows the nuclear density distribution in the YRB. The result shows that the digital industry in the midstream and downstream of the YRB has formed a cluster distribution characteristic of “concentration in the midstream and downstream, and dispersed in the upstream.” A comparison of the kernel density maps of the digital industry in the YRB for the five characteristic years (1994, 2004, 2012, 2019, and 2021) revealed the following:
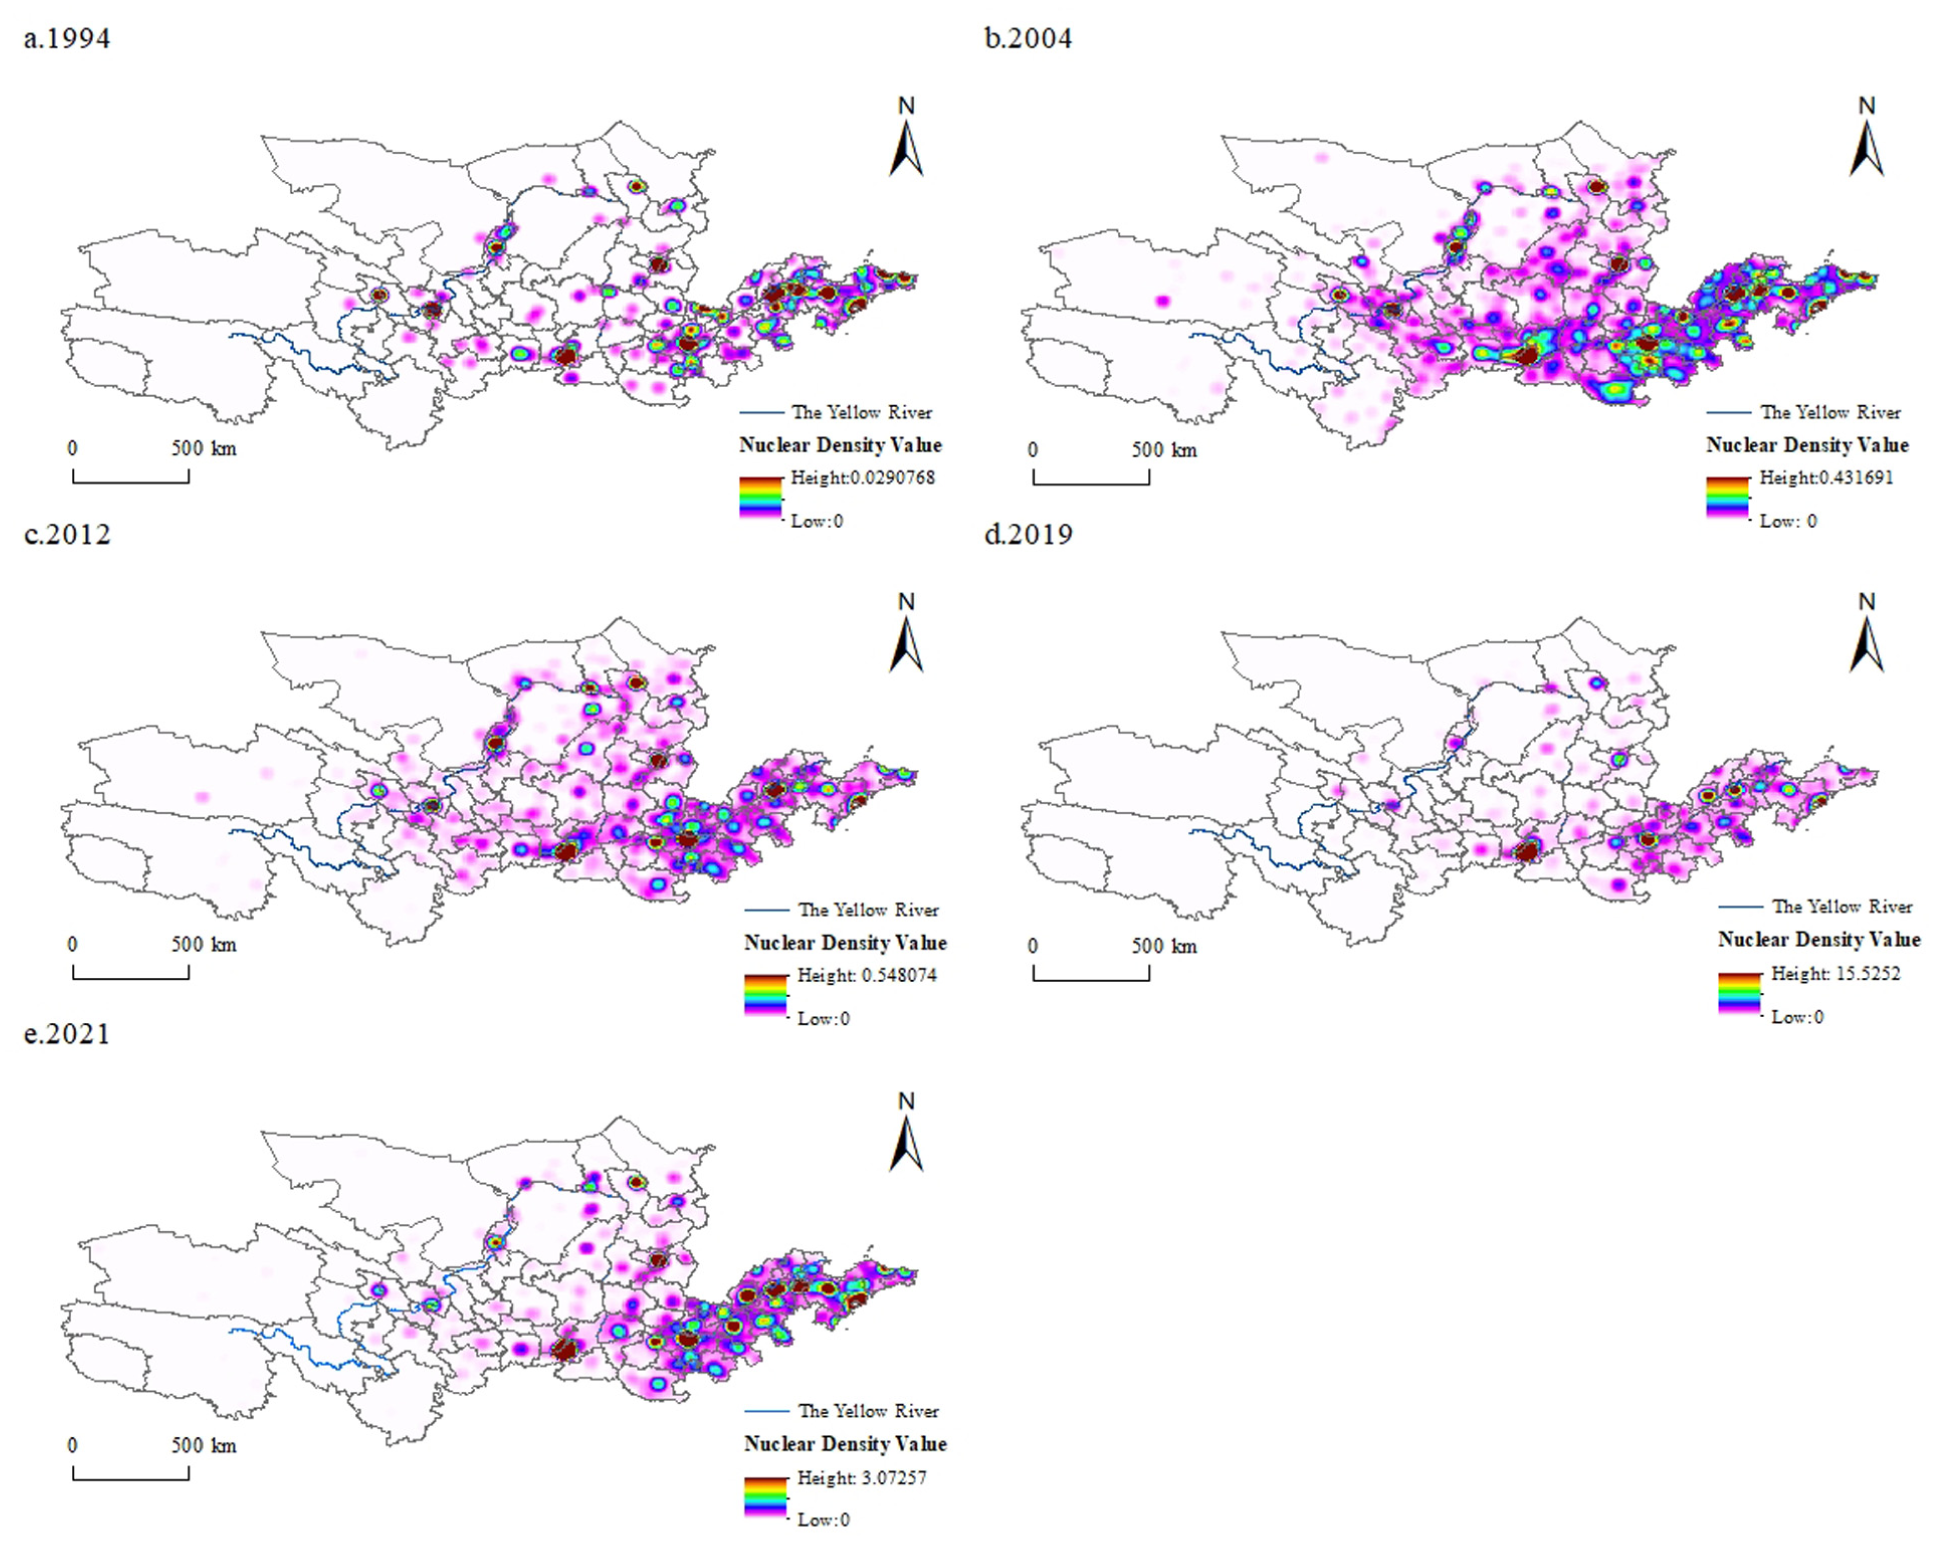
Nuclear density of the spatial distribution of digital industries in the YRB. (a) 1994; (b) 2004; (c) 2012; (d) 2019); and (e) 2021.
(1) The peak kernel density of the digital industry in the YRB is increasing, from 0.03 kernels/km2 in 1994 to 15.52 kernels/km2 in 2019. However, its kernel density is much lower than that of the Yangtze River Basin (J. Zhang et al., 2022), and its growth rate increases annually. In addition, there is a decrease in the value of digital industry kernel density in 2021, which may have been affected by COVID-19 in 2019.
(2) In the light of the distribution in space of digital industry agglomeration in the YRB, during the whole study interval, the high nuclear density areas are focused in the midstream and downstream of the city, and the four provinces of Shandong, Henan, Shaanxi, and Shanxi have formed a contiguous development trend with higher nuclear density values along the urban economic belt of the YRB. By contrast, cities in upstream provinces, such as Qinghai and Ningxia, have a comparatively small number of digital industry enterprises because of resource endowment issues, and their agglomeration characteristics are not prominent.
Circle Structure Characterization
After a thorough analysis of the spatial distribution properties, we found that the digital industry in the YRB presents a multi-core circle structure based on the “capital city” spreading from the center to the periphery and has a prominent economic and social orientation.
As shown in Figure 5, most high-value areas of nuclear density are located in capital cities of provinces, such as Xi’an, Zhengzhou, Jinan, Taiyuan, Hohhot, and so on, and show apparent distance attenuation; that is, the closer the distance to the provincial capitals, the higher the degree of digital industry agglomeration, and the reverse is also true. This suggests that the digital industry has location preferences for large cities. This is because the capital cities of the provinces have developed economies, concentrated populations, and frequent factor flows, which provide technology- and capital-intensive digital industries with the market, talent, and institutional environments necessary for their development.
In contrast, this feature was not evident in the cities of Shandong Province. In addition to the provincial capital city of Jinan, which is in the high-value nuclear density zone, Qingdao and Weifang have become core nodes of the digital industry agglomeration in the YRB. This study argues that this is because Shandong Province is adjacent to the Beijing-Tianjin-Hebei and Upper Triangle economic circles, which provide good location advantages and economic links, and offer favorable geographical conditions for developing digital industries in cities. In addition, factors such as balanced population distribution and more competitive cities are essential in shaping the characteristics of this aggregation.
Evolution of Spatial Patterns of Sub-types of Digital Industries
Nearest Neighbor Analysis
The outcome of the nearest-neighbor analysis of the spatial distribution of digital industry enterprises in the YRB (Table 2) show that the degree of digital industry agglomeration in the YRB has been increasing, and the service-oriented digital industry development trend is evident.
Nearest Neighbor Analysis of Spatial Distribution of Digital Industry Firms in the YRB (1994, 2021).
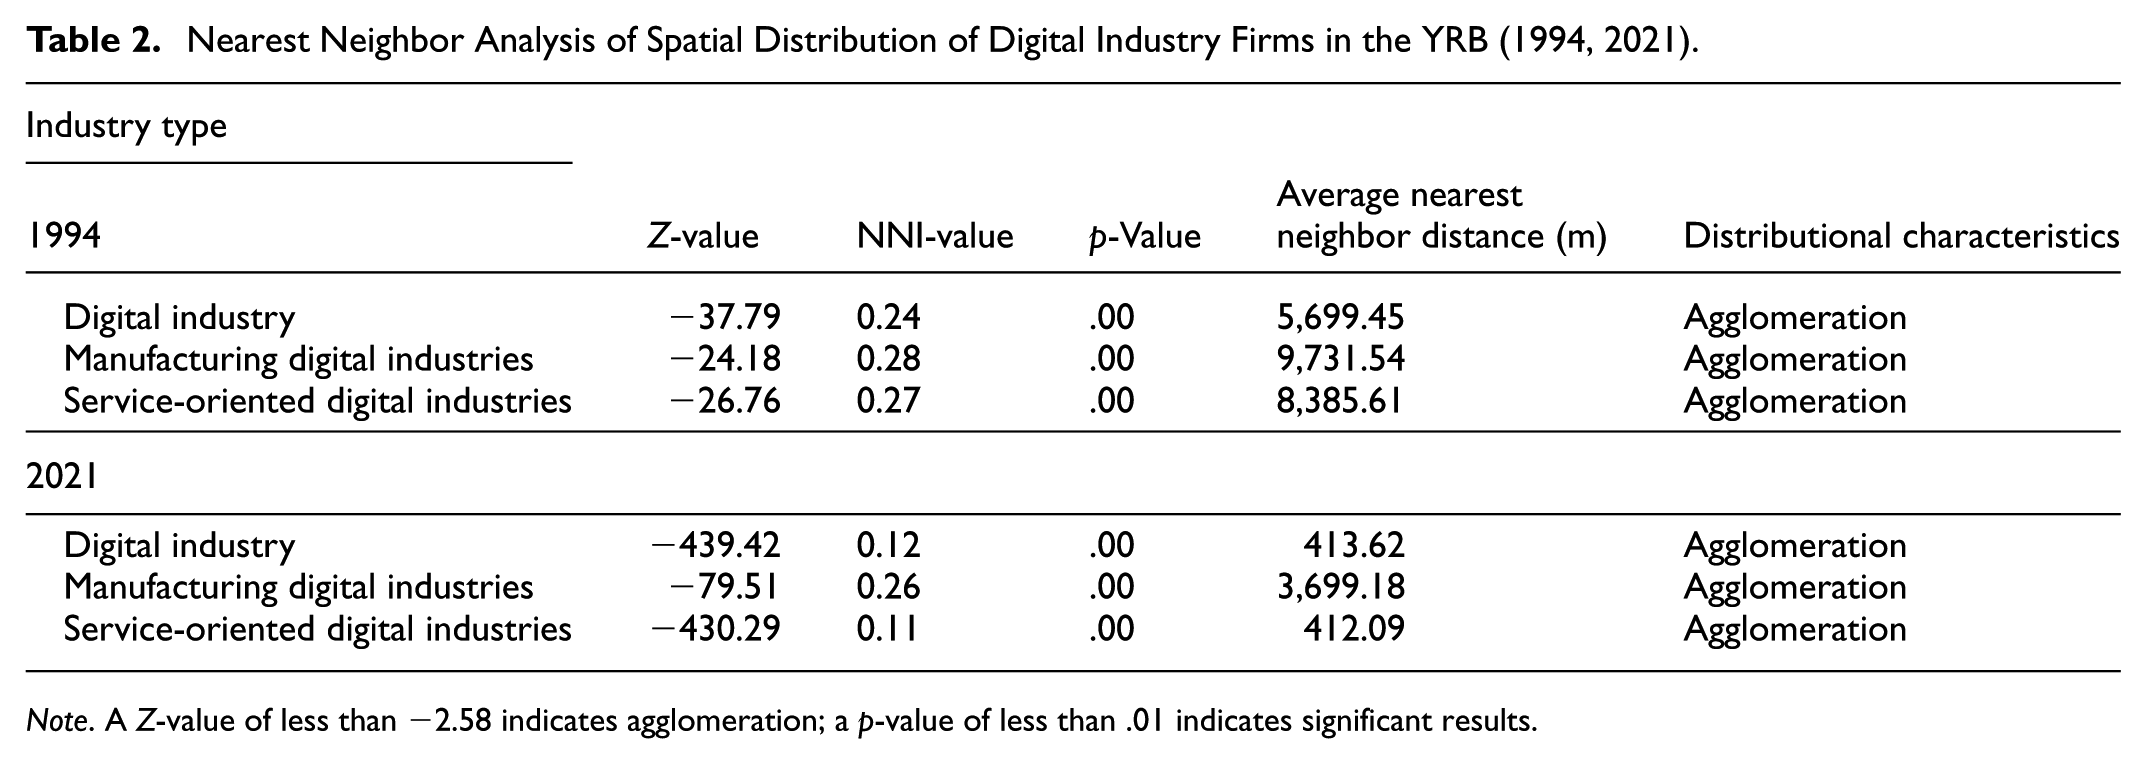
Note. A Z-value of less than −2.58 indicates agglomeration; a p-value of less than .01 indicates significant results.
During the period 1994 to 2021, the actual distances of enterprises in both manufacturing and service-oriented digital industries are under the theoretical nearest-neighbor distances, and the nearest-neighbor indices, NNI, are all less than 1; that is, the different types of digital industries have clustered distributions. In addition, from the results of the analysis between 1994 and 2021, it is evident that compared with 1994, the NNI of the overall digital industry, service-oriented digital industry, and manufacturing digital industry decreases by 0.12, 0.16, and 0.02, respectively. The overall digital industry and the two different types of digital industry agglomerations show a significant decreasing trend, and the NNI of the service-oriented digital industry figure declines the most, indicating that over time, the agglomeration trend of the service-oriented digital industry site layout is more prominent.
Additionally, the expansion of the two types of digital industry was not balanced within the study duration. The digital industry in the YRB was initially dominated by manufacturing digital industries such as computing machinery, communication apparatus, and other electronic gear, and then gradually shifted to service-oriented digital industries such as software and IT services, the web and associated services, telecom, receiver and television, and satellite communication services. In light of the above analysis of the quantity of companies in the digital industry in the YRB from to 1994 to 2021 (4.1). Despite a significant increase in the quantity of companies in the digital manufacturing industry in the YRB, their share declined from 45.83% in 1994 to 4.69% in 2021. The service-oriented digital industry will increase from 54.17% in 1994 to 95.31% in 2021, with the number of firms increasing dozens of times. This shows that, with the information and communication technologies sustained advancement and the increasing demand for digital services, the service-oriented digital industry has ushered in an opportunity for development and has become a new driver of economic expansion. The digital manufacturing industry is limited to the development of the YRB, owing to market factors and path dependence.
Traits of Spatial Distribution Agglomeration of Manufacturing Digital Industries
Further comparison of the spatial agglomeration pattern of the digital manufacturing industry in the YRB in 1994 and 2021 (Figure 6) reveals that, although the quantity of enterprises in the digital manufacturing industry has increased significantly, the change in its peak nuclear density is small. Only from 0.01 kernels/km2 in 1994 to 0.09 kernels/km2 in 2021. During the study period, there was a trend of gradual spread based on the high-value regions in 1994; however, the change in the high-value regions of nuclear density in the cities of the YRB was not apparent. Moreover, as demonstrated by Table 2, the nearest-neighbor index of the digital manufacturing industry declined only from 0.28 in 1994 to 0.26 in 2021, with an insignificant downward trend. This reveals that the digital manufacturing industry in the YRB has significant "path dependence.” In other words, digital manufacturing industry firms in the YRB tend to choose to locate existing industrial agglomerations.
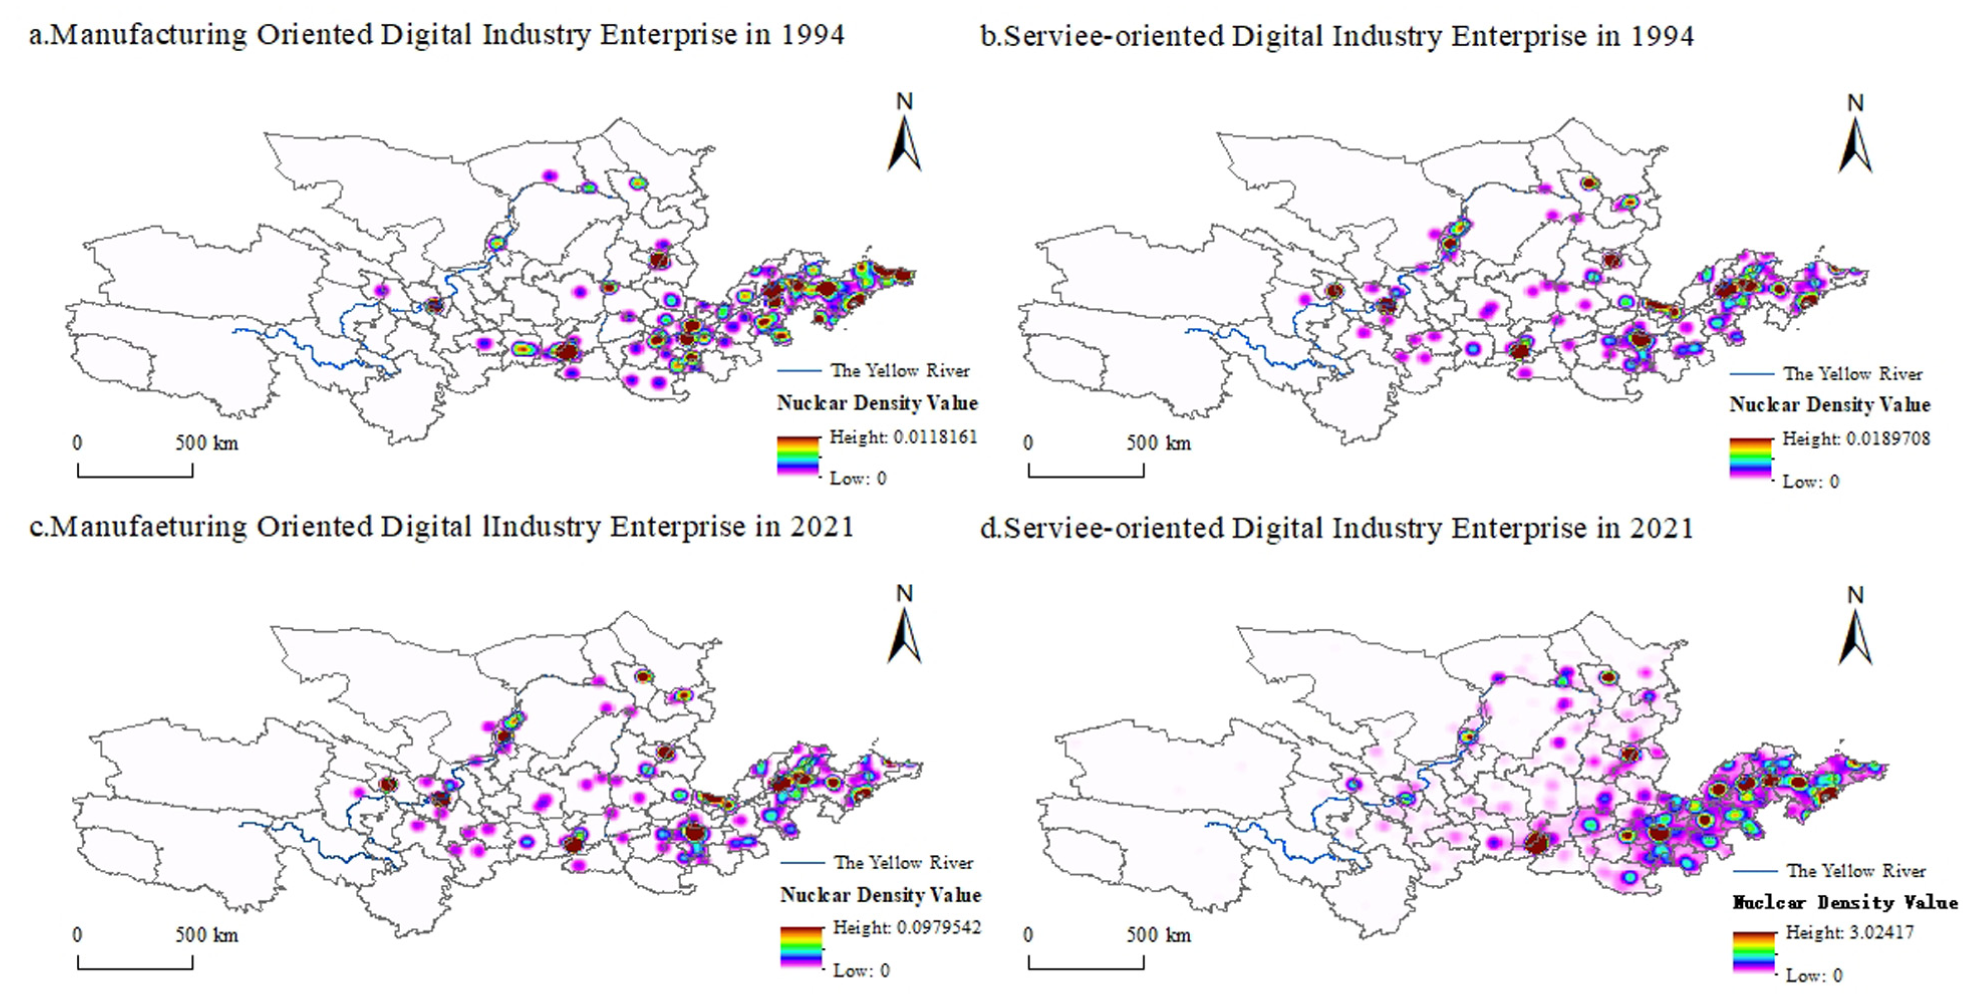
Clustering characteristics of two types of digital industries in the YRB in 1994 and 2021. (a) Manufacturing oriented digital industry enterprise in 1994; (b) Service-oriented digital industry enterprise in 1994; (c) Manufacturing oriented digital industry enterprise in 2021; and (d) Service-oriented digital industry enterprise in 2021.
Features of Spatial Distribution Agglomeration of Service-Oriented Digital Industries
In contrast to the manufacturing digital industry, the change of the spatial pattern of service-oriented digital industry firms in the YRB from to 1994–2021 is more pronounced. As can be seen in Figure 6, the peak kernel density of the service-oriented digital industry has increased from 0.02 kernels/km2 in 1994 to 3.02 kernels/km2 in 2021, and the nearest-neighbor index has also decreased from 0.27 in 1994 to 0.11 in 2021. This indicates that the service-oriented digital industry has the highest degree of aggregation and is the most apparent aggregation trend in the digital industry of the YRB. In addition, as shown in Figure 5, compared to the manufacturing and the service-oriented digital industry in 1994, the service-oriented digital industry in 2021 has a more prominent characteristic of taking the provincial capital city as the core node and extending to the periphery by radiation.
Driving Factors of Spatial Divergence of Digital Industry Development
Selection of Driving Factors for the Spatial Pattern of the Digital Industry
As technology-intensive enterprises, the development of the digital industry is a complex process influenced by multiple dimensions and factors. It is deeply influenced by socio-economic factors, as well as directly driven by market factors, and also requires support and guidance from agglomeration factors and regional policy systems.
For one thing, from the perspective of traditional location theory, a region’s economic foundation and market potential significantly influence the development of the digital economy. The economic foundation provides the basic conditions for the development of the digital industry. The construction of digital infrastructure requires a large amount of capital investment. Meanwhile, developed industries are conducive to the rapid dissemination of digital technology. The market potential provides innovative vitality and market size, driving the continuous innovation and development of the digital industry. Innovation drives the advancement of digital technology, while market size can reduce the cost of promoting digital technology and provide a fertile ground for its application
For another, from the perspective of new economic geography, the potential of informatization has emerged as a novel approach for the development of digital industries in less developed regions. Research has demonstrated that agglomeration factors and regional policy factors have a significant impact (Lin et al., 2017). The agglomeration effect in digital industries can lead to benefits such as resource sharing, knowledge spillover, and cost reduction, which contribute to enhancing the innovation capacity and competitiveness of digital industries. Meanwhile, regional policy frameworks provide guidance and support for the development of digital industries. By formulating industrial development plans, implementing preferential policies, and strengthening talent cultivation, creating a conducive environment for the growth of digital industry.
Based on these considerations, this study draws on traditional location theory and new economic geography to explore the driving factors of the digital industry. It focuses on two main aspects: socio-economic development levels and the potential for informatization, and selects corresponding factors from four secondary indicators—economic foundational factors, the degree of digital agglomeration, policy and institutional factors, and market potential factors—to analyze the results of the driving factors of the digital industry (Figure 7).
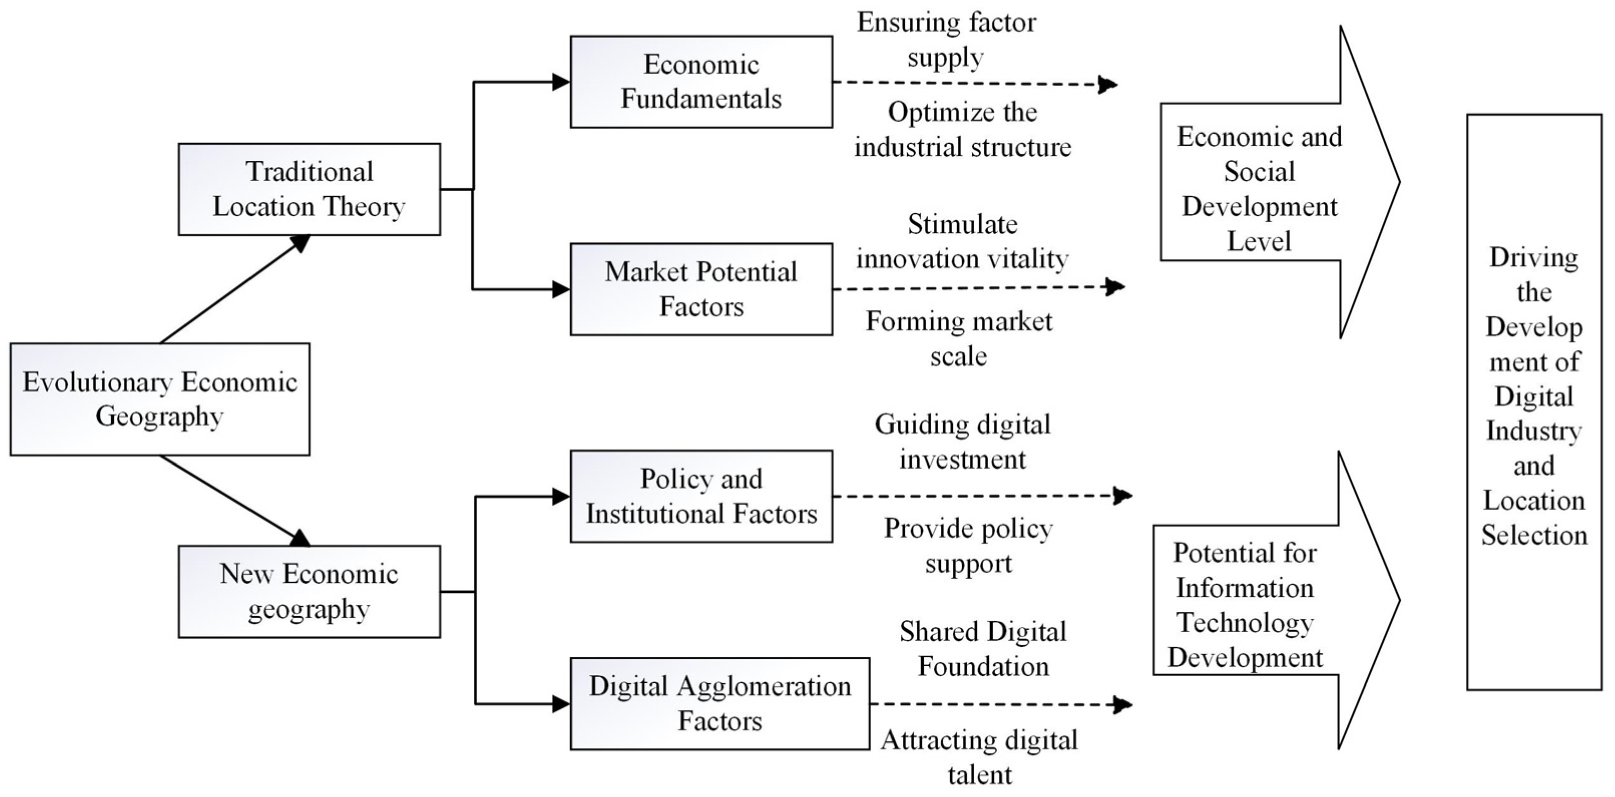
Analysis of the driving mechanism for the advancement of the digital industry in the YRB.
The Economic and Social Development Factors
First, from the conventional location theory and the theory of industrial development change, economic and social development level is considered the basis for developing the digital industry. Regions with high economic and social development provide the necessary economic foundations and market potential to develop the digital industry (Ernesto et al., 2024; Narula & Santangelo, 2009).
In Terms of Economic Development
Economically advanced regions offer a strong material foundation and market demand support for the substantial investments required for digital industry development. On one hand, developed regions have robust capital accumulation, well-established infrastructure, and abundant labor markets, which facilitate the initial R&D, technological iteration, and market expansion of technology and capital-intensive industries. On the other hand, with the improvement of economic development levels, the industrial structure continually optimizes and upgrades toward high-end and intelligent directions. The deepening integration of traditional and emerging industries provides rich application scenarios and cross-sector collaboration opportunities for the digital industry. This optimization of the industrial structure not only promotes the deep integration of digital technologies with the real economy but also stimulates internal innovation vitality within the digital industry. In summary, a higher economic development level signifies stronger economic strength, broader market space, and more optimized industrial structures, which can provide solid resource support for digital industry development and maintain competitive advantages.
Based on the above discussion regarding economic development levels, this paper chooses “per capita GDP” to represent regional economic development level (EL), and the ratios of “value added by the secondary industry to total output” and “value added by the tertiary industry to total output” to represent the development levels of the secondary and tertiary industries (TIS, SIS), thereby reflecting the driving role of advanced industrial structure on the development of the digital industry.
In Terms of Market Potential
Regions with high levels of economic and social development are often accompanied by higher purchasing power and demand for new products from consumers, creating enormous market space for digital products and services. At the same time, the demand for new technologies drives the market to constantly pursue innovation, thereby driving the development of the digital industry. In this context, enterprises are able to rapidly expand in a more favorable market environment, quickly reach the threshold of economies of scale, effectively reduce unit costs, and enhance market competitiveness. This process not only promotes the development and growth of the enterprise itself, but also maximizes the synergistic effect through the linkage of the upstream and downstream of the industrial chain. This positive cycle mechanism further catalyzes the comprehensive prosperity of the digital ecosystem and promotes the all-round upgrading from infrastructure construction to application service innovation.
In developed regions, the active atmosphere of innovation and entrepreneurship injects sustained innovation vitality into the digital industry, encouraging enterprises to constantly explore new technologies and models to meet the increasingly diversified needs of the market. At the same time, a digital consumer market that combines scale and efficiency not only provides a place for digital enterprises to verify their business models, but also screens digital enterprises through fierce market competition mechanisms, promoting the entire industry to develop at a deeper and higher level, ensuring that the digital industry occupies a leading position in global competition.
Based on the above discussion, this article selects “per capita retail sales of consumer goods in society” to measure residents’ consumption level (CP), uses “number of patent authorizations per 10,000 people” to represent market innovation and development level (DL), and uses “China Urban Innovation and Entrepreneurship Index” to measure market innovation and entrepreneurship vitality (MV), in order to reflect the driving effect of market potential factors on the development layout of the digital industry.
Informatization Development Latent Factors
With the comprehensive arrival of the information age, the potential for information development has become a key factor influencing the location choices of digital industries. This topic has garnered significant attention from new economic geographers and is gradually becoming a research hotspot in the field (Lin et al., 2017). Existing studies highlight two critical factors—policy frameworks and digital agglomeration—as significant influences on the spatial distribution of digital industries (Wu et al., 2018; Zhao, & Zhao, 2014). In terms of policy, governments create a favorable external environment for digital industry development through beneficial laws, regulations, and financial support. Meanwhile, the phenomenon of digital agglomeration emphasizes the high-density clustering of digital industries in specific regions, which enhances resource utilization efficiency and fosters innovation and knowledge sharing. In this context, delving into these factors is essential for understanding the geographical distribution patterns of digital industries and promoting the sustainable development of the digital economy.
In Terms of Policy and Institutional Frameworks
The development of the digital industry is closely linked to government policy support and technological investment. Policy support and technological investment in the digital industry can guide the inflow of high-quality capital, thereby promoting the formation of digital industry clusters and attracting the layout of emerging digital industries (Zhao & Zhao, 2014).
As an important force in guiding and regulating industrial development, policy and institutional factors provide a necessary policy framework and institutional environment for the rise and expansion of the digital industry. Additionally, by implementing a series of incentive measures such as tax incentives, innovation subsidies, and policies on data flow and protection, these factors significantly influence the location preferences of digital enterprises (Zhu & Chen, 2022). These policies aim to optimize resource allocation, promote technological innovation, thus creating favorable conditions for the agglomeration and diffusion of the digital industry.
In general, various cities leverage their inherent endowments to drive the development of the digital economy. Cities with higher administrative levels find it easier to access policies and possess superior resources that can support the development of the digital industry. Therefore, this study considers urban hierarchy and endowment levels as significant influencing factors. Specifically, this paper introduces a binary variable representing “urban hierarchy” (with capital cities assigned a value of 1 and other prefecture-level cities assigned a value of 0) to illustrate the effect of government resources on the development of the digital industry (CL). Additionally, “per capita scientific research financial expenditure” is employed to represent the level of government technological investment (GL), reflecting the driving force of policy and institutional factors on the development and distribution of the digital industry.
In Terms of Digital Agglomeration
As a key geographical economic phenomenon, centers on achieving efficient knowledge dissemination and rapid innovation iteration through a concentrated industrial and human resource allocation. A significant manifestation of agglomeration effects is knowledge spillover, which is particularly evident in the context of the digital industry. The complexity of digital technologies and their interdisciplinary nature make knowledge exchange and interaction the core driving forces of industrial innovation (X. Chen & Miao, 2021; J. Wang & Zhou, 2021). In agglomeration environment, enterprises and research institutions can share information and engage in technological collaboration more frequently, significantly shortening research and development cycles and enhancing product innovation levels.
Furthermore, digital agglomeration possesses the ability to attract and consolidate high-quality digital talent. The concentration of talent enables enterprises to secure adequate human capital support (J. Wang & Zhou, 2021). During the development of the digital industry, the quality and density of talent directly impact enterprises’ competitive advantages. The influx of high-quality talent not only enhances the region’s innovation capabilities and market responsiveness but also creates a virtuous cycle: increased attractiveness further draws more digital talent and innovation resources, thereby consolidating and enhancing the region’s position in the digital economy.
Therefore, digital agglomeration can effectively leverage knowledge spillover and labor market dynamics, facilitating the exchange and interaction of digital innovation knowledge, and providing a high-quality talent market for the digital industry, thereby promoting its development (X. Chen & Miao, 2021). Consequently, this paper selects “internet penetration rate” to represent the regional level of informatization (IL) and “the number of university students per ten thousand people” to signify human capital (HC), reflecting the impact of digital agglomeration factors on the development and distribution of the digital industry.
Analysis of the Results of the Detection of Digital Industry Driving Factors
In Section Selection of Driving Factors for the Spatial Pattern of the Digital Industry, based on the two driving mechanisms of levels of economic and social development and information technology potential for development, 10 driving factors were selected from four secondary dimensions: economic foundation, market development potential, government system, and digital agglomeration. We constructed a detection system about driving factor for the spatial disparity of digital industry advancement in the Yellow River Basin (Table 3).
Selection of Driving Factors for the Spatial Pattern of Digital Industry in the YRB.

According to the geographical detectors’ results, the magnitude of effect of every driving factor on the development of the spatial pattern of the digital industry in the YRB was analyzed, and the Table 4 displayed results.
Driver Detection System and Factor Detection Results.

Note. Data are from the China Urban Statistical Yearbook 2020 and the China Urban Innovation and Entrepreneurship Index 2019. ***, **, and * represent q-values that are significant at the 1%, 5%, and 10% levels, respectively.
Overall Analysis
Fourth column of Table 4 exhibits the results for the geographic detector of the entire digital industry. The conclusions indicate that the market potential factor has the most significant influence among the three indicators, except for the level of consumption of residents (0.14), level of innovation and development (0.49), and innovation and entrepreneurship vitality (0.30), which have a significant and greatest influence on the digital industry’ spatial pattern in the YRB. In addition, among the policy and institutional factors, city class (0.16) has a remarkable beneficial effect on digital industry choice on location. However, the level of S&T investment (0.13) drivers had the least significant effect. Digital agglomeration factors’ influence on the location selection of digital industry enterprises in the YRB is second only to the power of market potential factors, where the level of the informatization base (0.28) has a significantly favorable influence on the digital industry’s distribution in the YRB. However, the effects of the three indicators of economic fundamentals—the level of economic development (0.16), development of the secondary industry (0.14), and development of the tertiary industry (0.17)—on the selection of the location of digital industries in the YRB are all small, and none are significant.
The above results show that a favorable innovation and entrepreneurship atmosphere, a digital consumer market with both scale and efficiency, and urban resources are significant attractions for the choice of digital industry location in the YRB. This also proves that the distribution of digital industry agglomeration in the YRB has formed a multi-core circle structure based on the “central city” and spreading from the center to the periphery.
Economic fundamentals are at the bottom of the list of probes. This study suggests that this may be because, first, the economic factors and river transport capacity of the YRB intersect when competing for firms in several other essential regions in China, such as the Yangtze River Delta and the Pearl River Delta. This may lead to the digital industries’ development in the YRB, which are constrained by economic, logistical, and transport costs, thereby limiting the role of economic factors in driving the evolution of its spatial pattern. Second, the YRB generally focuses on agriculture and traditional heavy industry as the main economic pillars, and the proportion of digital industry in the overall industrial structure is low. This makes it likely that the digital industry in the YRB will face relatively low local market demand and will not be able to attract firms, even if better economic fundamentals exist. Finally, developing digital industries often requires more policy and environmental support, including tax policies, entrepreneurship support policies, and research institutions. This makes it likely that digital industry firms will be more inclined to locate in regions with relatively friendly policies and environments rather than prioritizing the regional economy.
Analysis by Sub-types of Digital Industries
Table 4 columns 5 and 6 is the results of the probes for manufacturing and service-oriented digital industries. The results of the examinations for the drivers of location choice for firms in service digital industries are basically the same as those for digital industries as a whole. But differ significantly from those for manufacturing digital industries.
First, economic development’s level (0.30), among the economic base factors, has a notable positive impact on firms’ locations in the digital manufacturing industry, which is different from the service-oriented digital sector.
Second, the market potential factors of consumption level (0.35), innovation development level (0.71), and innovation and entrepreneurship vigor (0.65) in the digital manufacturing industry probes were significantly improved compared to the service probes.
Finally, regarding the potential dimension of informatization development, except for human capital (0.28), which has no significant effect on the digital industries’ distribution in the YRB, city class (0.11), level of S&T investment (0.43), and level of informatization foundation (0.34) all have significant positive effects. All were significantly higher than the effects on service-oriented digital industries.
In response to these results, this study argues that, relative to the service-oriented digital industry, the manufacturing digital industry is at the primary end and usually requires large-scale infrastructure such as physical equipment, production lines, and supply chains, which are capital-technology-intensive, whereas the service-oriented digital industry is mainly at the application end and is less dependent on the economy and resources. Consequently, digital manufacturing industries require economic, policy, aid, and consumer cooperation. By contrast, service-oriented digital industries are more susceptible to local policy environments and other influences. This makes the dependence of the manufacturing digital industry in the YRB on each of the driving factors significantly higher than the dependence of the service digital industry on each of the factors. In contrast, the reliance on government resource support is significantly lower than the dependence of the service-oriented digital industry on this factor.
In addition, this study argues that digital manufacturing industries are primarily concerned with the process of manufacturing and producing products. Their development and evolution are often closely related to the local market demand. However, the economic structure of the YRB is relatively biased toward manufacturing, the hefty industry, and infrastructure development, which makes it likely that market demand in the YRB will be more focused on manufacturing products. Thus, economic base factors and market potential factors are more powerful in explaining the transformation of the spatial patterns of digital manufacturing industries.
Analysis of the Interaction of Digital Industry Drivers
Geographic detectors were further utilized to identify the different driving factors’ interaction, that is, to assess whether two factors (
Classification of Interactions.

Analysis of Interactions Overall Industry
Based on the above calculation method, geographic detectors were further used to obtain the interaction between different drivers under the two dimensions of social and economic advancement levels and informatization development potential, and Table 6 displays the results. Based on the results in Column 2 of Table 6, the interactions for all drivers of the digital industry are either bifactor or nonlinear enhancements. The impact of the interaction among diverse factors of influence on the development and patterns of the digital industry is far more significant than that of a single element, although there are some differences.
Results of Driver Interactions.

Note. NE = nonlinear enhancement; BE = bi-factor enhancement.
For the digital industry as a whole, although the level of S&T investment has a weak influence on the digital industry pattern in the YRB, the explanatory strength of the interaction between the level of S&T investment and the tertiary industry’s development (0.98), the degree of innovativeness and development (0.99), and innovation and entrepreneurial vigor (0.99) is more significant than 0.90, suggesting that all three pairs of driving factors can significantly influence the pattern of the digital industry’s development in the YRB.
Moreover, the interplay between human capital and the level of innovation development (0.67), the level of the informatization base, the secondary industry’s development (0.60), and the development of the tertiary industry (0.60)—that is, the interaction of the level of advanced industrial structure–also had an indispensable influence on the spatial pattern of the evolution of digital industrial enterprises in the YRB.
Analysis of Interactions by Sub-Types of Digital Industries
Columns 3 and 4 of Table 6 show the interaction between the manufacturing and service-oriented digital industries in the YRB. The interactions between the service-oriented digital industry development elements are essentially the same as the overall digital industry development interactions. However, digital manufacturing industry interactions are quite different.
According to the interaction detection results, the explanatory strength of the interaction of factors influencing the spatial pattern of the digital manufacturing industry in the YRB was generally heightened than that of the service-oriented digital industry, with four pairs of drivers having an explanatory power greater than 0.90. The levels of innovation development, S&T investment (0.97), human capital (0.92), and information technology base (0.91) ranked first in terms of the explanatory strength of the three pairs of driving factors. The interplay between the level of S&T investment, innovation, and entrepreneurship dynamics (0.92) strongly influenced the transformation of the spatial distribution of digital industries in the YRB.
This study argues that innovation and entrepreneurship are the driving forces behind the sustainable advancement of the digital industry. Simultaneously, regions with high levels of S&T investment can better support technological innovation and product R&D in digital manufacturing industries, and high levels of human resources can also contribute to the innovation and development of digital industries. Additionally, the foundation of informatization is an essential source of innovation and advancement in the digital industry, and the level of innovation and development and the three influences promote each other, thus enabling the upgrading and improvement of the spatial advancement pattern of the digital industry.
Built upon the above analysis of the results of the interaction between different types of digital industries, the coordinated and healthy advancement of the digital industry in the YRB should stimulate the innovation capacity of digital manufacturing industries, while increasing investment level in science and technology to enhance the vitality of innovation and entrepreneurship within the zone.
Conclusions and Recommendations
Conclusions
This study describes and analyzes the development features and driving factors of the spatial pattern of digital enterprises in the YRB using enterprise microdata of the digital industry in the YRB from 1994 to 2021, using the standard deviation ellipse, kernel density estimation, nearest-neighbor indices, and geographic detection model, and the following main conclusions are drawn.
Evolution of Spatial Patterns in the Digital Industry in the YRB
Firstly, the digital industry in the YRB has experienced explosive growth over the past two-plus decades, with the overall distribution pattern of enterprise count remaining “midstream and downstream regions > upstream regions,” alongside distinct socio-economic preferences.
Secondly, the YRB’s digital industry has followed a development trajectory of “dispersion followed by agglomeration,” generally exhibiting an agglomeration trend from the east (slightly north) to the west (slightly south).
Thirdly, the YRB’s digital industry features a core-periphery circular structure centered on provincial capitals. This characteristic is more pronounced in the Yellow River’s midstream and downstream regions. In contrast, upstream provinces exhibit weaker agglomeration due to inadequate resource endowments.
Finally, both service- and manufacturing-type digital industries in the YRB are agglomerated and distributed. However, the uneven development of these two digital industries is becoming increasingly apparent. Meanwhile, the changing trend in the degree of aggregation of manufacturing-type digital industries in the YRB was minor and depended on the development path. By contrast, the change trend in the degree of aggregation of service-type digital industries is significant.
Factors Driving Spatial Patterns of the Digital Industry in the YRB
According to the Geodetector model’s results on the driving role of each factor, we find that market potential factors, such as innovation development level, consumption level by residents, and digital agglomeration factors, such as human capital, have a more notable impact on the spatial advancement of digital industries in the YRB, while the economic development level factors, such as the economic fundamentals level and the structure of the industry, have a weaker impact. This reflects that, under the wave of digital economy development, setting up a reasonable policy system to stimulate the growth of innovation and entrepreneurship, attract talent, and upgrade the basic level of information technology has turn into a vital measure for promoting the advancement of the digital industry and optimizing its layout of digital industry in regions with a weak economic foundation.
Policy Recommendations
In view of the results, subsequent policy recommendations are proposed for the development of the digital industry in the YRB.
Optimize Digital Infrastructure Development, Implement Regionally Differentiated Policies, and Advance Coordinated River Basin Development
Our study reveals unbalanced development across the YRB, particularly in upstream regions, where economic underdevelopment has led to inadequate digital infrastructure. Enhancements should focus on the following key areas:
First, accelerate digital infrastructure development in upstream regions. Given the comparative underdevelopment of digital infrastructure in these areas, targeted increased investment should prioritize advancing broadband networks, data centers, and cloud computing platforms, thereby providing robust support for the digital industry.
Second, implement differentiated development strategies. Policies for digital industry development should be tailored to the resource endowments of different regions. Midstream and downstream regions should leverage their market advantages and industrial foundations to drive digital industry agglomeration, while upstream areas should attract projects compatible with local resources through supportive policies, fostering distinctive digital industry clusters.
Third, strengthen the leading role of provincial capitals. Our study indicates that the digital industry has formed a core-periphery structure centered on provincial capitals. Provincial capitals serve as hubs of digital industry agglomeration and boast the strongest innovation and entrepreneurial dynamism within their regions. Thus, it is essential to leverage the resource advantages and industrial foundations of provincial capitals and key nodal cities to develop core digital industry clusters.
Refine Talent Policies for the Digital Industry
Our study indicates that informatization level and human capital exert a significant impact on the spatial development of the digital industry. As an underdeveloped region, the YRB faces talent outflow. Thus, in advancing the digital industry in the YRB, emphasis must be placed on the role of talent.
First, a systematic, efficient talent attraction and cultivation mechanism should be established. Policies should be developed to cultivate and attract digital professionals with practical skills, market acumen, and innovative spirit, thereby building a talent pool for the industry. Second, governments should forge close collaborations with higher education institutions, research organizations, and private enterprises to develop an industry-academia-research integrated talent cultivation mechanism.
Fully Account for Differences in Location Selection Patterns Across Digital Industry Types, Optimize the Digital Industry Structure, and Cultivate Agglomeration Advantages
Our study indicates that manufacturing-type digital industries are often subject to path dependence, leading to their clustering in existing agglomeration areas. These areas typically have mature supply chain systems, abundant talent reserves, and comprehensive industrial support services, creating a conducive environment for the growth of manufacturing digital industries. Thus, policymakers should focus on optimizing and upgrading these agglomerations, enhancing their industrial competitiveness through technological innovation and targeted industrial policies, and ultimately driving industrial chain upgrading and intelligent transformation.
Additionally, this study finds that service-oriented digital industries tend to cluster around provincial capitals as core nodes, exhibiting more pronounced preferences for economic conditions, talent, and markets. Central cities generally have strong information exchange capacities, highly concentrated innovation resources, and dynamic market environments—all critical to the development of service-oriented digital industries. To foster their healthy development, policy efforts should focus on cultivating a favorable innovation and entrepreneurship ecosystem, providing policy support and market incentives to attract and cultivate more digital service enterprises, thereby strengthening digital industry agglomeration advantages.
Establish an Interregional Collaborative Mechanism to Guide Planning and Optimize Spatial Patterns
Given the specific context of the YRB, a medium- to long-term digital industry development plan should be formulated, with special emphasis on ecological protection in the region. An interregional industrial development collaboration mechanism should be established to tackle challenges in the digital industry’s growth. Each region should capitalize on its unique strengths to develop distinctive digital industries: for example, the YRB’s upstream could prioritize integrating clean energy with digital technology, while the midstream and downstream could advance digital transformation driven by agriculture and manufacturing.
Limitations and Future Implications
This study also has limitations. First, its scope is restricted to analyzing characteristics of core digital industry enterprises (e.g., information transmission, software technology), failing to fully cover critical dimensions such as digital transformation of traditional enterprises and emerging digital business forms, which may limit the comprehensiveness of depicting regional digital development. Second, data constraints have hindered deeper exploration of cross-sectoral or cross-regional variations, restricting the generalizability of findings to some extent.
These limitations point to clear directions for future research. First, integrating multi-source data (e.g., enterprise operational data, regional policy documents) to refine enterprise attribute identification will enhance the depth of analysis on diverse digitalization trajectories (including traditional enterprises and new forms). Second, cross-regional comparative studies (e.g., with the Yangtze River Economic Belt, Pearl River Delta) can reveal differential patterns of digital industry development, providing more targeted insights for regional policy-making. Third, exploring the synergistic mechanisms between digital and green development in the YRB—given its dual role as an ecological barrier and economic hub—will offer theoretical and practical guidance for high-quality regional development.
Footnotes
Appendix
Funding
The authors disclosed receipt of the following financial support for the research, authorship, and/or publication of this article: This work was supported by National Social Science Found of China (21CTJ023).
Declaration of Conflicting Interests
The authors declared no potential conflicts of interest with respect to the research, authorship, and/or publication of this article.
Data Availability Statement
All data included in this study are available upon request by contact with the corresponding author.