
Abstract
This article examines the predictions of crime pattern theory in a unique neighborhood type. It tested potential crime attracting facilities against street robbery data from 2009 to 2013 in the Police Districts I & II in Downtown Houston. The analysis modeled the four daily human routine periods described in the American Time Use Survey (ATUS). Generalized linear simultaneous negative binomial regression model was used to determine the size of the influence of the variables (beta coefficients) and their significance for each model outcome. The findings show some distinct patterns of street robbery due to the immediate and lagged effects of the variables relatable to the study environment’s unique setting. Two variables, geographic mobility, and barbershops were particularly significant across three of the outcome models. The results suggest that the physical and social structure of neighborhoods determined by land-use regulations would enhance understanding of the time-based influence on robbery patterns due to crime-attracting facilities.
Introduction
The evaluation and prediction of the pattern of robbery incidents is a vital step in understanding the functions of spatial variables such as potential crime attracting or generating facilities on the concentration of robbery incidents. Crime pattern theories explain that crime does not occur randomly but in a pattern defined by opportunism and tracking of targets—at the intersection of an offender and a victim’s activity spaces (Brantingham & Brantingham, 1995). Studies on crime pattern theory have found that specific facilities have a different time-related impact on a street robbery in distinct spatial and ecological zones. These studies have primarily focused on large areas like cities and towns (Bernasco & Block, 2011; Bernasco et al., 2017; Haberman & Ratcliffe, 2015; Stewart, 2005). The purpose of this study is to revisit spatial categorization as a significant factor in crime pattern theories predictions of time-dependent outcomes. Because it is debatable if broad spatial areas such as a city or state-wide research can adequately explain these facilities’ impact on crimes like street robbery. According to crime pattern theories, differences in the spatial functioning and temporal evolution of neighborhoods and districts in cities, towns, suburban, and rural areas are relatable to victims and offenders’ human daily activity patterns at those locations (Brantingham & Brantingham, 1995). Most research on time-dependent robbery outcomes has overlooked eclectic city neighborhoods’ dimensions and differential land-use policies (Anderson et al., 2013). For instance, the structure and functions of a Downtown area within a city differ from other inner-city business districts and, therefore, affect offenders and victims’ activity paths. The environmental backcloth (Haberman & Ratcliffe, 2015) of most Downtown areas in the United States uniquely comprise grid-like street networks. Beavon et al. (1994) note that the accessibility of street networks and their potential targets affect property crimes. Street networks influence people’s movement in an area and how quickly an offender can get to a destination. Land use in Downtown areas is relatively similar—concentrating significant business and commercial interests in a city. Still, zonal planning laws differ between cities—as such, the mix of residential and commercial properties would vary—as may, their likely impact on crime rate (Anderson et al., 2013). Bevis and Nutter (1977) observed that less accessible street layouts had reported lower burglary rates at the census tract level. “The character of the built environment, clustering of land uses and the temporal routines of daily life cluster nodes, channel movement, and force a convergence of uncountable individual paths into a limited number of actual paths between nodes” (Brantingham & Brantingham, 1995, p. 10). Thus, it may be essential for intervention purposes to focus on smaller and contained spaces where patterns may be less discernable but localized. This study adopts similar principles and assumptions found in the broad city-wide studies of time-based generators and attractors of robbery. These studies include Haberman and Ratcliffe’s (2015) examination of Philadelphia and the study of Chicago by Bernasco et al. (2017) but examines these relationships among crime attracting places in a city Downtown area. A Downtown area is a smaller, more distinct, and homogeneous space. By implication, city-wide studies may likely obscure the effects of the heterogeneous structures and functions of the different spaces that lie within the single city space. Moreover, Houston, Texas—the study area, has not been extensively examined for the implication of crime pattern theory on the time-geography of robbery. The study explores the conceptual basis of crime pattern studies upon which foundation the covariates and parameter estimates of predictors of the street robbery counts are constructed and analyzed within a general linear statistical model. It also compares the time-dependent robbery outcomes examined in previous studies against the time-independent outcomes. The subsequent sections discuss these conceptual and methodological processes and the results and draw policy and research-relevant conclusions.
Theory and Literature
Traditionally, a combination of routine activities (RATs), rational choice, and crime pattern theories explain the activity pattern of criminal offenders and the patterns of crime on a spatial and temporal scale. Crime pattern theory models the tangents of the locations where individuals conduct their daily living, work, and recreational activities to the paths or routes which connect them to those areas. These business nodes and the roads required to reach them create a geographic pattern that represents the activity space unique to an individual (Brantingham & Brantingham, 1995). Each person’s activity space embellished by the areas at its edges or peripheries creates a complex of attached regions which form the individual’s awareness space. Within the daily process of navigating an activity space, both victims and offenders create a cognitive map of this patterned area. Time geography theories underscore the restricting impact of time on the compartmentalization and concentration of human activities (Haberman & Ratcliffe, 2015).
Human activity patterns are isolatable by time in the day when those activities occur. Robbery patterns vary by daily routine events and a reasonable degree by nonroutine social functions that concentrate people at a location but occur mostly during weekends (Monk et al., 2010). Activity pattern clusters by place, a period of the day, and day in the week, crime pattern theories explain that robbery patterns will also cluster in the same way. Human daily RATs determine the opportunities and availability of lucrative robbery targets. In agreement with RATs, the openings for crime shifts in time with the densities of offenders, victims, and the guardians (Ratcliffe, 2010). A significant proportion of robberies occur on the streets—along the arteries of substantial pathways—some known for the types of activities or services that they host. An offender would most likely look for high-value targets at a manageable level of risk. Crime attractors refer to facilities such as bars, barbershops, check-cashing shops. On the contrary, crime generators include large-scale public congregation places such as transport stations and shopping malls (Bernasco & Block, 2011). Crime generators and attractors in urban areas present significant security and legal challenges for both residents and local public administrators (Eck & Weisburd, 1995). They are often legitimate and income-generating entities. However, a location may extend beyond the immediate spatial parameters of a facility. The site could refer to an apartment complex, a shopping mall, or an entire block or block group. The functions of the crime attracting facilities attract crime incidents (Eck & Weisburd, 1995).
Traditionally, the function of our daily routine (Cohen & Felson, 1979; Felson & Boba, 2010) and the spatiotemporal distribution of crime attracting places explain the distribution of crime (Brantingham & Brantingham, 1995). Crime generators concentrate offense because many people aggregate at such sites, and crime attractors focus crime by the nature of their peculiar functions to store and exchange valuables. Furthermore, an offender anchor point measures the proximity of an offender’s home or place of activity or illegal business, such as gang activity, to a robbery incident location (Bernasco & Block, 2011).
In addition, the structure and functions of the neighborhood determine the influence of these services on the robbery. The Downtown areas, for instance—are the drivers of the business and commercial activities in a city. The different times of the day, workdays or weekends provide varied opportunities for crime (Roman, 2005) in a Downtown area. Various types of victims and offenders potentially increase the liability of different kinds of crime attractors and generators (Haberman & Ratcliffe, 2015), since the seasons (Falk, 1952), days, and periods of the day and the level of guardianship influence the concentration of potential offenders and victims at particular places (Haberman & Ratcliffe, 2015). Previous studies have found variations in the level of robbery activities within the vicinity of a diversity of potentially criminogenic facilities, services, and activities (Barthe & Stitt, 2009; Groff & McCord, 2011; Groff et al., 2009; Ratcliffe, 2010; Roman & Reid, 2012). Robbery victimization rates in the United States are higher in urban areas than suburban areas (Monk et al., 2010). These potentially criminogenic facilities could vary between different sections of the same area (Anderson et al., 2013), embedded in the physical layout, proximity to services, and land use characteristics of an area (Greenberg & Rohe, 1984).
In a test of crime pattern theory in the City of Chicago, Bernasco and Block (2011) used daily robbery incident data recorded in census blocks from 1996 to 1998 to study the impact of crime attractors, generators, and offender anchor points on robbery distribution. They examined businesses and illegal markets such as bars, restaurants, food stands, barbershops, liquor stores, grocery stores, general merchandise shops, gas stations and illegal drug markets, and gambling. The effects of the immediate and the spatially lagged effects of the variables were estimated using negative binomial regression models. Controlling for constructed ethnic heterogeneity, poverty, household population variables, they found that blocks containing crime attractors, crime generators, and offender anchors had higher robbery counts than blocks that had none. The results suggested that proximity to an attractor, generator, or offender anchor point determined the count of robbery incidents in a census block. For example, each liquor store in a unit increased the count of robbery incidents by 67%. Although, the effects of all the lagged variables compared with the immediate effects of the variables, the spatially lagged variants of the variables had fewer effects than the variable’s immediate spatial effects. In a related study, Ceccato and Uittenbogaard (2014) observed that the crime rate at underground train stations shows daily, seasonal, and time of day-based variations. Irvin-Erickson and La Vigne (2015) found that the potential to generate or attract crime varies between the Washington DC Metro stations. The types of crime involved differ by characteristics of the locations, accessibility, and the level of activities surrounding the areas. Haberman and Ratcliffe (2015), in the City of Philadelphia, examined the time-dependent impact of facilities that attract and generate crime on block-level robbery incident distribution from 2019 to 2011. They tested these facilities’ impact across four time periods: Morning, Daytime, Evening, and Late-night, and controlled for four constructed demographic variables (population effect, racial heterogeneity, geographic mobility, and concentrated disadvantages). They used simultaneous negative regression analysis to estimate the effect of the facilities on the four outcome models. Haberman and Ratcliffe hypothesized that six of the facilities would increase robbery counts, notwithstanding the time of day. However, only ATMs and banks, corner stores, and fast-food restaurants significantly increased robbery incidents across the four outcome models. The spatially lagged effects of corner stores and fast-food restaurants also increased the count of robbery across the four outcomes. ATM and banks were associated with higher robbery outcomes during the morning and daytime hours. The spatially lagged and immediate effects of check cashing stores were significant across all outcome models except during the morning. Of the facilities hypothesized to have unique effects, alcohol stores were insignificant across all periods. The immediate effects of bars were not significant at any period. Nevertheless, bars had a significant spatially lagged effect during the daytime and late-night period. High schools had an immediate significant positive effect during the daytime, evening, and late-night period. Furthermore, high schools also recorded a positive significant spatially lagged effect during the morning, daytime, and late-night period. The immediate and lagged effect of pawnshops was only significant during the daytime. They found that the effects of the examined demographic variables varied between the four time-dependent outcomes. The spatially lagged effect of the population was significant during the daytime, evening, and late-night period. Higher residential mobility or racial heterogeneity increased robbery count during the evening and late-night period. Following these results, in 2017, Bernasco and Block published another study where they examined 1996 to 1998 robbery incident data recorded by the City of Chicago police department. They tested the time-dependent effect of crime attractors, generators, and offender anchor point on the distribution of incidents across census blocks using a conditional logit model. Bernasco and Block estimated the time-based effect of the facilities in 12 2-hour intervals. They found that the influence of the facilities and offender anchor points on time of day distribution of robbery were not significant for 17 of the 18 variables tested. Many of the facilities produced a significant effect on the block-level incident distribution, but their time-based variation was not significant. For instance, Barbershops and beauty salons had a significant impact except during the Morning hours between 8 and 10 am. Blocks with barbershops and beauty salons attracted robbery even during the evening and late-night hours. Bernasco and Block found that other retail businesses such as pawnshops, cash services, general merchants, and liquor stores had positive and significant effects. However, the variation of these effects across time was not significant. The effects of schools showed a significant impact during school hours from 6 am to 4 pm. Their effect did not vary across the week’s days—except for high schools, which proved less-attractive robbery targets during weekends than weekdays when schools are open.
A significant number of these studies of time-dependent effect of potential criminogenic facilities and activities on robbery patterns have attended to large city areas—incorporating diverse neighborhood types. Thus creating space for interrogating these activities in smaller, structurally, and functionally similar spaces.
Current Study
This study examines the relationship between time of day, presence of crime attractors, and the count of robbery incidents in the city of Houston Downtown area. This Downtown area’s 45.57 square miles space has witnessed significant challenges to law and order from a street robbery in recent years, with growing concern among residents about its possible impact in eroding the vitality of Downtown life in Houston created by more than decade-long transformation efforts by property developers. The city of Houston Downtown area is about one-third, and one-sixth of the size of the cities of Philadelphia (Haberman & Ratcliffe, 2015) and Chicago (Bernasco et al., 2017), respectively. A city’s Downtown boundary is spatially undefined because they expand to encompass other settlements. The central business area in Houston makeup police patrol districts I and II located between Interstate Highways 69, 10, and 45. This area has a total street length of 1,243.29 miles and comprises 222 U.S. census block groups.
Previous studies have used the U.S. census block and block group as units of analysis for small-scale analysis of crime patterns in cities and towns. Although, census blocks are a much smaller unit of analysis compared to census block groups, which could comprise between 600 and 3000 residents (Bernasco & Block, 2011; Bernasco et al., 2017; Haberman & Ratcliffe, 2015). Most U.S. census demographic data are recorded in census block group delineations. A likely question relatable to data availability is the use of demographic data delineated in terms of census block groups. Habermann and Ratcliffe (2015) used census block data. It is important to note that population data, including its other demographic constructs, are not recorded in the U.S. Census in terms of census blocks. In addition, the American Community Survey (ACS; the source of population and housing information) data are delineated based on block groups and not blocks. Therefore, all complimentary data used in the study were bound in block groups. These considerations were necessary because the spatial lag analysis estimated the individual predictors’ spatial lag effect in terms of geographic delineation. The data were used as retrieved from U.S. census sources and did not involve a personal aggregation of data from a smaller areal unit to a larger scale or disaggregation of data from a larger size to smaller groups. Thus avoiding the inherent problems of modifiable area units.
Like many Downtown areas in the United States, the Houston Downtown area has a Manhattan grid street format. Since the physical environment changes and evolves with the functions of an area—the types of activities and services that an area offers are functions of the demands of cities, towns, and neighborhoods designated by policy planners. The activity maps of offenders would likely have certain similarities in Downtown areas than other city neighborhood types. Beavon et al. (1994) note that urban planning and zoning laws determine the urban environmental backcloths of street networks and city neighborhoods’ structure. In this study, the city of Houston Downtown is considered a city neighborhood area. Street robbery incidents occur along street paths and corners, alleys, parking garages, apartment hallways, public parks, and transportation nodes. The frequency of robbery depends on local circumstances (Monk et al., 2010; Weisburd et al., 2012), and the other structures of the physical environment (Eck & Weisburd, 1995). Crime pattern theory addresses the implication of crime attractors and generators in determining crime sites along these pathways and nodes in an area, thus suggesting that these crime-attracting places would influence the rate of crime at specific locations in the two City of Houston Downtown districts. In addition, in spatial analysis, it is essential to examine the impact of neighboring spatial units on each other to avert bias and uncertainties. The possibility of bias exists because nearby spaces are interdependent (Tobler, 1970). The count of robbery in one block group may be influenced by an adjacent block group’s activities, as illustrated in crime displacement studies (Eck & Weisburd, 1995; Monk et al., 2010).
This study follows Haberman and Ratcliffe (2015)’s use of the American Time Use Survey (ATUS) data. The data designate four distinct periods of RATs in the United States. These periods reflect when people conduct specific routines. Most likely, the periods would vary across the country. The Houston Police Department has a crime reporting system. This system provided the basis for the daily regular human activity periods adopted in this study. They are 6:00 AM to 10:00 AM (Morning time), 10:00 AM to 4:00 PM (Daytime), 4:00 PM to 10:00 PM (Evening time), and 10:00 PM to 6:00 AM (Late-night) (See Pred, 1981; Ratcliffe, 2006). For instance, 6:00 AM to 10:00 AM period’s commuting pattern involves morning rush hour school and work routines. While the 10:00 PM to 6: 00 AM late-night to early morning hour’s commonly consists of commuting for Evening outings. The four periods in the day, approximate the ATUS change-point regression models adopted by Habermann and Ratcliffe (2015). The study also examines and compares the aggregate daily robbery count data against the ATUS time-disaggregated data. Four primary factors informed the choice of criminogenic facilities in this study. These factors include the facilities’ functions, the facility’s position about major transportation pathways, the facility’s location, and its placement against other facilities and demographic variables (Brantingham & Brantingham, 1998). For instance, a Pawnshop is a crime attractor because it is an outlet for burglars. Similarly, a liquor store comprises all large-scale wine, spirits, and beer-selling outlets. These products are consumed offsite. In a city Downtown area, potential crime attractors include general merchant stores, barbershops, check cashing stores and bank ATMs. Others would include corner stores, and crime generators—nightclubs, subway stops, high schools, and parks (See Bernasco et al., 2017; Habermann and Ratcliffe, 2015). Five crime attractors selected for this study based on macro-level research in the study area are check-cashing shops, liquor stores, pawnshops (Bernasco et al., 2017; Habermann and Ratcliffe, 2015), and general merchant shops, barbershops (Bernasco et al., 2017).
Figure 1 illustrates a hypothetical example of a person’s daily activity pattern according to the period in the day that the activities occur. Nodes (A–G) within this activity map link each other through divergent pathways. The pathways within a human activity map are numerous. So are the likely points at which an offender would intersect a victim moving back and forth those routes at different times within each period in the day. There are potentially thousands of combinations of the nodes, paths, and the four periods in the day that any offender X can intersect a victim Y. The locations and pathways could be similar or may differ in different degrees depending on specific RATs. However, of primary significance is that the likelihood that a victim’s activity pattern would intersect the would-be offender’s activity pattern is unlimited and challenging to compartmentalize. According to Haberman and Ratcliffe (2015), the locations and pathways weave an environmental backcloth within which the variables that influence robbery incidents operate. Rational choice theories explain that the precision of the decision making depends on the offender’s cognitive rationalization of the rewards of committing the crime. This rationalization is limited by the knowledge available to the offender or the ability to acknowledge and process the available knowledge.

Model of a human activity pattern by time of day. The model also spatially describes an activity space. The connectors to the nodes describe the activity paths.
Method
Hypothesis
This study addressed the question: do criminogenic places, aggregated demographic themes, and period in the day, explain the distribution of robbery incidents in Downtown Houston Texas police districts I and II? The earlier sections have explained the distribution and risk of robbery as a function of criminogenic places based on crime pattern theories. This section of the paper models and analyzes the time-based spatial interaction of the crime generating and attracting places and their influence on the distribution and risk of robbery in the study area (Bernasco & Block, 2011; Tobler, 1970; Weisburd et al., 2012).
The bases of the study’s assumptions are the crime patterns and time-geography theories and explanations explored under theory and literature (see Brantingham & Brantingham, 1995; Haberman & Ratcliffe, 2015; Monk et al., 2010; Ratcliffe, 2010). Generally, the study hypothesizes that robbery in Downtown Houston is associated with potential criminogenic facilities; the impact of these services would depend on the period in the day; the effect of each predictor would differ between the periods in the day. The morning hours and the daytime operational hour would have the most significant impact because this is when RAT is high, and victims and offenders concentrate around activity centers. The late-night period would witness the least impact on robbery. The following sub-hypothesis use store hour’s information of the five potentially criminogenic facilities obtained from an internet search of the City of Houston Yellow pages (see Haberman & Radcliffe, 2015). (a) General merchant shops in the city are open between 8:00 AM and 7:00 PM. (b) Check-cashing stores—9:00 AM to 7:00 PM. (a) Pawnshops—9:00 AM and 7:00 PM. (d) Liquor stores—10:00 AM and 9:00 PM. (e) Barbershops—9:00 AM and 7:00 PM. The general hypotheses are that these facilities’ presence would increase robbery incidents during their daytime operational hours. However, some specific patterns are assumed. The general merchant shops would increase robbery count during the daytime and the evening hours when people leave work and have time to transact personal businesses (see Bernasco et al., 2017). The check-cashing stores will attract robbery throughout the three periods (morning, daytime, and evening) when they are open. It would have the highest effect during the evening period when workers have time to transact personal businesses. The pawnshops will increase robbery outcomes during the morning, daytime, and evening hours, but the daytime outcome would be highest. The presence of liquor stores would increase robbery count during the daytime and evening hours because liquor stores are at the peak of their operations at both times. Liquor stores would be least active during the morning and late-night hours when they close. Nevertheless, it would potentially have the highest effect during the evening hours (see Haberman & Ratcliffe, 2015). The impact of barbershops in the evening period would exceed the morning and daytime period due to increased patronage from customers returning from work during the later period. Each spatially lagged variable would have the same impact as the nonlagged variable.
The control variables (geographic mobility, concentrated disadvantages, racial heterogeneity, and total population) will predict the count of robbery across the four designated daily periods. Also, the impact of the predictors would not differ between the four outcome models. Although demographic predictors influence robbery counts, the differences between individual demographic predictors’ levels of effects are not established (see Haberman & Ratcliffe, 2015).
Description of Research Design
The study’s research design included the boundaries of 222 U.S. census block groups, which form the units of analysis. The data accessed from the Houston Police Department (HPD) website open-source database comprise 834 robbery incidents recorded by the department within 222 block groups from 2009 to the end of April of 2013. The HPD robbery incident addresses are rounded to the 100 block. These data are geocoded to the Downtown district map with the ArcGIS 10.3 mapping software. It created a spatial data model that links the count of robbery incidents per block group to the criminogenic facilities and the demographic control variables. Two outcome data groups adopted for the study are in group 1 (four models I-IV). Models I-IV form the dependent variables compartmentalized as four periods in each 24 hour day. Morning (6 AM–10 AM), daytime (10 AM–4 PM), evening (4 PM–10 PM), and late-night (10 PM–6 AM). These times represent approximate periods when people go through normal RATs in the day (Haberman & Ratcliffe, 2015). Group 2 (Model V) comprised the block group’s aggregated daily robbery count as the single outcome variable.
Dependent Variable
The univariate statistics for the outcome variable indicated that the robbery count within the block groups was over-dispersed (Table 1). Table 1 shows the mean count of robberies, the standard deviation, and the minimum and maximum count of robberies in the analytic units or block groups. Figures 2 and 3 show the frequency by the time of day and the percentage of block groups with zero incidents. The morning time (Model I) robbery outcome on the average recorded a mean count of 0.22 incidents (SD = 0.69), Table 1, and 86.9% of the block groups during the morning period recorded zero robbery incidents (Figure 3). The individual block group counts within this period ranged from 0 to 5. The daytime period (Model II) data showed a mean robbery count of 0.64 (SD = 1.26). They recorded zero robbery incidents in 70.27% of the block groups. The evening period (Model III) count of the robbery was much higher (M = 1.46, SD = 3.90). Model III had zero robbery incidents in the least number of block groups (63.96%). The average robbery count was highest during the late-night (Model IV) period (M = 1.99, SD = 5.45). Late-night recorded zero robbery incidents in 65.31% of the block groups. The late-night period also recorded the highest number of robbery incidents (50) in a single block group followed closely by a maximum number of 43 events recorded during the evening hours (Table 1). The daytime had a maximum number of eight incidents in a block group. Each outcome period had a minimum of zero robbery incidents. Approximately 71.61% of the block groups during each period recorded zero robbery incidents. The highest frequency of reported events occurred during the late-night. At the same time, the lowest incidence happened in the morning period (Figure 2). A block group in the aggregated model V recorded the maximum count of 90 events, with a mean count of 4.31 events, and a standard deviation of 10.246 (Table 1). On average, block groups with barbershops recorded a robbery incident count of 0.62—the highest average number of incidents recorded for any of the examined crime attractors per analytic unit. Barbershops were followed by 0.39 incidents for general merchant stores, against 0.23 for liquor stores. The units containing pawn shops attracted the least number of robbery incidents (0.09). Similarly, the number of incidents recorded for the lagged variants of the attractors followed the same pattern. Figure 4 indicates that a majority of the incidents concentrated in approximately one-third of the block groups.
Univariate Descriptive Statistics of Demographic, Place, and Dependent Variables for Models I-IV (Disaggregated Time Count) & V (Aggregated Time Count).


Frequency of robbery incidents in Downtown Houston by time of day.

Percentage of block groups with zero robbery incidents.

Aggregate frequency count of robbery incidents per block group.
Independent Variables
A list of five crime attractors and four control variables determined from literature and macro-level research to have a potential impact on the distribution of robbery (Bernasco et al., 2017; Haberman & Ratcliffe, 2015) form the independent variables. The addresses of the predictors obtained from the yellow pages directories (yellowpages.com) geocoded to specific spatial coordinates—resulted in a successful geocoding of 99% of the facilities to their locations. The crime attractors examined for their influence on robbery count in Downtown Houston are general merchant shops, pawnshops, liquor stores, check cashing stores, and barbershops. The study’s primary interest is the time-dependent effects of these variables on the count of robbery in Houston Downtown spatially delineated by block groups. The U.S. census data files 2010 to 2015 community survey provided information about the demographic control variables (U.S. Census Bureau, 2010). The constructed demographic control variable, which includes geographic mobility, concentrated disadvantage, and racial heterogeneity, influences crime rates in communities and neighborhoods (see Haberman & Ratcliffe, 2015). Geographic mobility is the frequency with which people change their residential location. It is a measure of the stability of community social organization and social efficacy. The U.S. Census Bureau’s ACS (2010–2015) estimates incorporate variables for calculating residential mobility. Furthermore, communities with less homeowner turnover would witness a reduction in the crime rate. The residential mobility value for a block group is the percentage of the population not in the block group housing units the previous year. This value is the U.S. Census value of the proportion of the total population that has lived at that location for more than 1 year (Boggess & Hipp, 2010). “Concentrated Disadvantages” is a standardized population scale estimated for each block group as an average z-score (normalized) value of five factors. These factors are the percentages of the population on welfare, living below the poverty threshold, single female-headed families, unemployed individuals, and below 18 years. A higher value of concentrated disadvantage represents a higher likelihood of crime in a neighborhood (Bollens, 1997; Sampson et al., 1997). The value of racial heterogeneity is the squared proportion of five factors. These are the population percentage of the racial variables; White, Black, Hispanic, Asian, and all other races. Racial heterogeneity is the subtraction of the average of the squared proportion of these factors from 1. The racial heterogeneity increases from 0.0 to 0.80, which forms the boundaries of the index. The fourth control variable—is the total population count—estimated as the overall population per block group spatial unit. This variable is an indicator of the exposure of geographic space to robbery. Ordinarily, this vulnerability should also include the transient population. Nonetheless, as noted by Bernasco and Block (2011), the influence of this community on the street robbery is an indirect estimate of the effect of crime attractors which invite such transient population into the neighborhoods.
Statistical Model
The size and significance of the variables (beta coefficients) for each model were determined using the IBM, SPSS, version 24, software generalized linear negative binomial regression model. All the predictors were entered simultaneously for all Model I-IV, and in Model V. The negative binomial regression model incorporates a log link function that allows for the modeling of linear relationships between the predictors and the transformation of the dependent variables. The one-sample Kolmogorov–Smirnov test estimated the overdispersion in the regression model of robbery counts per period in the day. The analyses examined the hypothesized influence of time of the day on the association between crime attractors and the risk of robbery in Downtown Houston. It also tested overdispersion in the aggregated outcome model. When the models were tested against a Poisson distribution, the test was highly significant (p < .0001), indicating an outcome variable’s overdispersion. Thus adopting the negative binomial regression model to test the study’s hypothesis. The analysis considered the zero-inflated model. In this case, a conventional negative regression model was a good fit for the overdispersed data. It was also much more comfortable to estimate and interpret. Therefore, it was not necessary to adopt the zero-inflated model.
The analysis included an omnibus test of the full model against a null model (without predictors). The omnibus test parameter estimated the individual predictor variables’ unique influence on the variation due to the independent variables. The omnibus test result indicates that the fully fitted models (I–V) fit the data better, and the difference was statistically significant (p ≤ .05). The predictors accounted for significant differences in the outcome—time in the day count of robbery events. The Ex (B) or incident rate ratio (IRR) estimates the percentage change in the outcome variable using the IRR value for every predictor. (1-IRR) 100 is the percentage decrease when the predictor beta coefficient is negative (meaning that the outcome’s log count is decreasing by the value of the coefficient for every unit increase in the predictor). (IRR-1)100 is the percentage increase when the predictor beta coefficient is positive (meaning that the outcome’s log count increased by the value of the coefficient for every unit increase in the predictor).
Finally, the study tested for regression significance using the Wald chi-squared test. Since we cannot assume the homogeneity of error variances in the models (Wuensch, 2016), the study examined the pairwise differences between the beta coefficient of variables with significant omnibus tests for the outcome models. This analyses used a z-score test of significance based on the difference between the coefficient of the paired variable divided by the square root of the sum of the squared standard errors of the factors (n > 25): z-score = β1−β2/√(Ɛ12+Ɛ22) (Weaver & Wuensch, 2013; Wuensch, 2016). In a pairwise comparison of the beta coefficient of variable x for models “a” and “b,” β1 and Ɛ1 are the beta coefficient and standard errors for variable x in model “a.” Similarly, β2 and Ɛ2 are the beta coefficient and standard errors for variable x in model “b.” A test of significance of the z-score value determines the importance of the differences between both coefficients.
Spatial Lag Effects
The presence of the same types of crime attractors or generators in adjacent census block groups required examining spatial dependence. Close by places are more likely to show more significant similarities compared to more distant locations (Tobler, 1970). The spatial lag tests examine whether a predictor located within a block group effects robbery counts in adjacent block groups. The concept of spatial dependence derived from Tobler’s law undermines the notion of statistical independence. A spatially dependent effect means that the impact of a variable on robbery count in a block group is not independent but also influenced by the variable’s values in adjacent block groups.
Therefore, following Haberman and Ratcliffe’s (2015) analysis, it was also necessary to examine how observations of the independent variables in neighboring block groups within the study areas influence each other. The examination of spatial dependence involved the construction of spatially lagged variables for each of the separate variables. Spatial lag analysis test this effect and improve the negative binomial regression model fit by representing the facility’s availability in a block group with “1” and representing the absence of a facility with “0.” Spatial lag leads to inaccurate and inconsistent estimates of regression models. It could thus invalidate the significance of the results of the negative binomial regression model. This study also used the latest variant of Luc Anselin’s Geoda 1.14 software to determine the effect of spatial lag on the count of robbery incidents in the block groups within the study area. The Geoda software is particularly useful for exploratory spatial data analysis (ESDA). It provides explicit information on spatial and statistical distribution at the neighborhood level (Anselin et al., 2006). The spatial weight matrix adopted for the analysis is the arc distance between any two block groups. It resulted in a threshold distance of 5596 feet estimated by Geoda. This threshold distance ensures that each incident has one or more neighbors. The study estimated the spatial lag effect (spatial autocorrelation) of the outcome variable with the global Moran’s I test. The test examines the clustering of similar robbery count values in the block groups (See Moran’s I values in Table 2).
Simultaneous Negative Binomial Regression Results of Time-Disaggregated (Models I–IV) Robbery Counts per Block Groups in Houston Downtown Districts I and II, 2009–2013.

Note. B = beta coefficient; SE = standard error; IRR = incident rate ratio; VIF = variance inflation factor.
p < .05. **p < .01. ***p < .001.
The Moran’s I values for the count of robbery in the block groups showed sparse clustering of similar events in the outcome models. The Moran’ I values ranged from 0.1563 to 0.3051. The Moran’s I test was significant for all the four outcome models. Based on the Moran’s I results, the data showed a limited presence of spatial autocorrelation. Also, a test of the collinearity of the predictor variables using the variance inflation factor (VIF) produced a VIF ranged from 1.030 and 1.349. Collinearity in regression analysis suggests a correlation between the predictor variables and not just with the outcome variable. A VIF below 3 is a commonly accepted collinearity level between related variables (Bernasco & Block, 2011). The VIF was determined iteratively.
Results
The result of the analysis presented in two categories is—model I to IV (Table 2), which comprises the disaggregated time-dependent outcomes. The second is model V (Table 3), the aggregated time-independent outcome. The tables detail the IRRs, significant coefficients, the percentage change of outcomes (Table 4), and pairwise comparison of significant variables’ coefficients (Table 5).
Simultaneous Negative Binomial Regression Results of Time-Aggregated (Models V) Robbery Counts per Block Groups in Houston Downtown Districts I and II, 2009–2013.

Note. B = beta coefficient; SE = standard error; IRR = incident rate ratio.
p < .05. **p < .01. ***p < .001.
Percentage Change for Coefficient of Variables (Models I–V) with Significant Wald’s Tests.

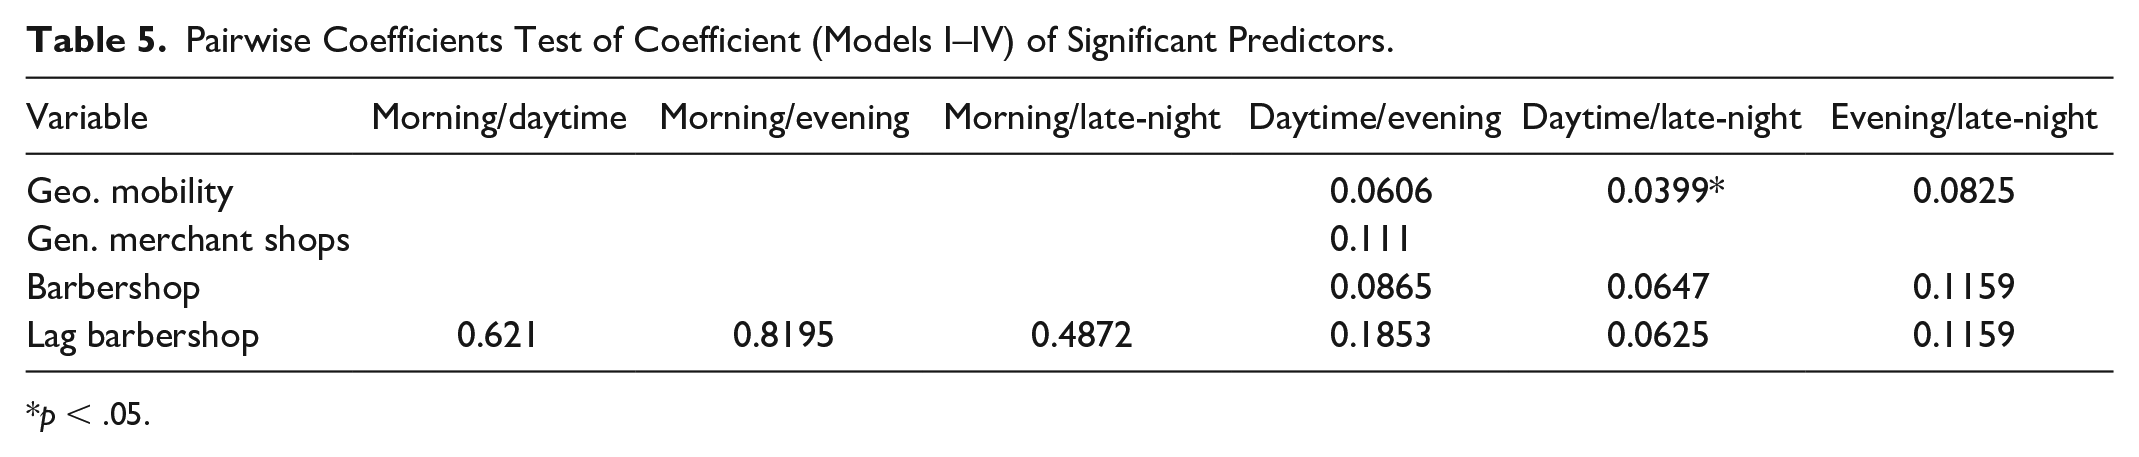
Pairwise Coefficients Test of Coefficient (Models I–IV) of Significant Predictors.
p < .05.
As hypothesized, the day’s period impacted the predictive power of each of the variables in a unique way (Table 2). The spatially immediate variables and the control variables did not significantly affect robbery across all the four outcome models. The control variable geographic mobility and the spatially immediate barbershops were significant across the daytime and evening time as predicted. Geographic mobility—as predicted, significantly influenced the late-night outcome. The prediction that check-cashing stores and pawnshops would increase robbery count during the morning period was not validated. The daytime period results support the hypothesis that the presence of general merchant shops, check-cashing shops, pawnshops, liquor stores, and barbershops would significantly increase the count of robbery during the daytime. Concerning the demographic control variables, only geographic mobility significantly affected robbery count during the daytime.
In agreement with the studies hypothesis, barbershops’ impact on robbery count was significant during the evening. In contrast to the hypotheses, liquor stores’ effect on the evening outcome was not statistically significant. The significance of the general merchant shop effect during the evening period was validated. The results differed with the late-night period prediction for barbershops since this facility had a significant positive effect. The results did not support the general hypothesis that the late-night period will have the least impact on robbery counts. Instead, the morning time witnessed the least impact of the predictors on the number of robberies.
Table 3 shows the simultaneous negative binomial test for the aggregated block group count of robbery incidents. This model V analysis was not time-dependent with the events aggregated for each block group within 24 hours. With this analysis, only 3 of the 14 predictors were significant. Spatially immediate geographic mobility and spatially lagged barbershops were highly significant (p < .0001) even though barbershops’ immediate effect was not significant. This result compares with the result of models I to IV time-disaggregated analysis where lagged barbershops were highly significant across all the four outcome periods. Spatially immediate geographic mobility was significant for three outcomes except for the morning period. The immediate effect of liquor store reduced robbery count in the aggregate analysis. This immediate effect was just significant (p < .05). In contrast, liquor stores’ lagged effect had a positively significant outcome (p < .001).
Percentage Change Analysis
The IRRs values estimated the percentage change in the independent and control variables for the outcome models. The study predicted that the spatially lagged variables would have the same impact as the spatially immediate variables. In models I to IV, the spatially lagged general merchant shops, and the spatially lagged barbershops significantly increased robbery count as hypothesized—during the daytime and the evening. The lagged barbershop was the only significant predictor across the four periods.
Among the spatially immediate predictors for the disaggregated data, barbershops produced the least robbery incident rate increase. However, the lagged variable produced the highest incident rate increase of all the predictors. Only the lagged barbershop (IRR: 280%) was positively significant during the morning (model I). Generally, for all the significant predictors, the evening and late-night periods provided the most substantial incident rate increases of robbery in that increasing order. It appears as if, the latter the period in the day, the more significant the percentage increase in the incident rate of robbery. For instance, barbershops produced about 15% change in IRR from daytime to evening period and about a 20% change from evening time to late-night. During the daytime model II, the check-cashing stores created the highest percentage increase in robbery incidents—followed closely by pawnshops and liquor stores. Interestingly, while the spatially immediate barbershops outcome had the least incident change in the daytime compared to the other four facilities, lagged barbershops produced the highest incident rate increase of all the predictors. The lagged barbershops incident rate change is about six times the rate change of general merchant shops during the daytime, and three and half times during the evening period. Although the morning and evening periods recorded the least number of significant predictors, the IRR of the lagged barbershops were highest at these periods—morning (280%), evening (143%), and late-night (236%). The demographic control variable—geographic mobility, had a single-digit increase. This variable recorded the smallest robbery incident rate percentages, which are approximately similar across the four periods (Table 4). This result agrees with the prediction that the impact of the demographic variables will remain the same across the outcome models. In the aggregated outcome model V, among the significant predictors, the liquor store’s immediate effect decreased the count of robbery by 67.5%. In contrast, the spatially lagged liquor store increased the robbery events count by about 486%. The percentage change in geographic mobility for this aggregated outcome was merely 3.2 %. This aggregated count result reflects the average percentage change values for geographic mobility across the daytime, evening, and late-night periods, in the time-disaggregated models II to IV. Similar to the time-disaggregated model outcomes, the spatially lagged barbershop (model V) recorded a high percentage change value (190.8%).
Pairwise Coefficients Test
As hypothesized, that the magnitude of the facilities’ effects between the periods in the day would differ, the study tested the null that there would be no difference between any two periods. Four variables (spatially immediate geographic mobility, general merchant shops, barbershops, and spatially lagged barbershops) showed time-dependent outcome variation. However, only geographic mobility produced a significantly different effect on the count of robbery between the daytime and late-night period (p = .0403) (Table 5). Model V, which is a single aggregated outcome, did not test for pairwise comparisons.
Discussion
Tests of crime pattern theories are based on the influence of potentially criminogenic facilities in space and time. The tests generically provide city-wide patterns of robbery distribution. These general assumptions have been the central focus of various spatial studies of urban robbery patterns (Block & Block, 1995; Bernasco & Block, 2011, Bernasco et al., 2017; Haberman & Ratcliffe, 2015; McCord & Ratcliffe, 2007). The results of city-wide studies could subsume the unique impacts of the facilities in diverse neighborhood types. Since an assortment of patterns may exist that links the type of spatial neighborhood and the impact of crime attractors or generators to the time of day distribution of street robbery within every kind of geographical area. Thus this study investigated the influence of criminogenic facilities on a much smaller space—a city Downtown neighborhood—structurally defined by unique activities and land use planning.
Disaggregated Outcome Analysis (Models I–IV)
The findings on the relationship of the predictors with block group robbery count in models I to IV, to some degree, are consistent with Haberman and Ratcliffe (2015). Haberman and Ratcliffe’s large-scale study based on data from the City of Philadelphia found that the impact of the crime attractors on robbery rates was unique across the time-dependent outcome models. In a related study, Bernasco et al. (2017) found that the significance of crime attractors on the distribution of robbery incidents in the City of Chicago did not extend to temporal variation. While in this study, only geographic mobility, predicted robbery outcomes significantly among the demographic predictors, Haberman and Ratcliffe (2015) found that spatial lagged population, racial heterogeneity, and residential mobility positively influenced robbery outcomes. The pairwise coefficient comparison of the outcome models in this study was limited to very few cases because none of the spatially immediate facilities and demographic control variables significantly impacted robbery across the four periods in the day. Only spatially lagged barbershops were significantly associated with the four time-disaggregated outcomes. Only geographic mobility resulted in a significant difference between any two outcome models (daytime and late-night outcomes). Habermann and Ratcliffe (2015) observed that the usage pattern of the criminogenic facilities impacted guardianship around the vicinity of the premises—the movement and density of people at different locations and times. Therefore, each service type would tend to have a unique effect on the robbery count and its temporal distribution. Being that street robbery is an opportunistic crime, RAT explains that place guardianship is a critical platform to explain the predictors’ impact during any period in the day. The present findings indicate that the theorized effect of guardianship by RATs theory on the response of robbery counts to the predictors does not hold in the study area. Despite the level of guardianship, the opportunity seems to be the primary determinant of robbery for the offender (See Bernasco et al., 2017). For instance, liquor stores’ effect was generally at variance with the prevailing notion that liquor stores impact robbery during the evening and late-night hours around its immediate vicinity (Gorman et al., 2001). Similarly, the attraction of general merchant’s stores to the robbery was significant during the Evening when the facilities close. Each of these predictor’s effects on the robbery was particularly notable during the daytime—peak hours of operation—when population density would be highest and expected to provide greater guardianship. The spatially lagged general merchant stores were significant during the daytime. These results suggest that general merchant stores in adjacent block groups influenced the distribution of robbery incidents in spatially immediate neighborhoods during the daytime but not during the morning, evening, or late-night periods.
Haberman and Ratcliffe (2015) observed that the peak hours of operations would provide a more precise explanation of the predictors’ impact on robbery outcomes. Bernasco et al.’s (2017) test of this assumption with a 2-hour interval model did not provide significant supporting evidence because they found that the importance of criminogenic facilities on robbery count did not depend on either time in the day or the day of the week. In this study, though general merchant shops and the other criminogenic facilities examined open during the morning hours, the morning period was not a significant predictor of robbery. A likely explanation is that morning is not a peak period of the facility’s operations. A sum of the activities around the peak periods, including the nonpeak period, may best account for their noticeable impact on robbery outcomes (Bernasco et al., 2017).
As hypothesized, check cashing and pawnshops facilities positively affected robbery during the daytime only–peak operational hours. The finding that checks cashing shops, followed by pawnshops—produced the highest percentage increase in the robbery is not unexpected. Robberies are more likely in blocks that include cash targets. Bernasco et al. (2017) found that though pawnshops, general merchant stores, and cash services were statistically significant, the variation of their impact across the day was not. Comparing Bernasco et al.’s results and this study may be challenging since the former examined the daytime as a discrete 2-hour period rather than as four periods of routine human activity. The 2-hour block model appears too precise to measure regular operations and thus increases the chance of variation in the time sequence of a predictor’s impact on the robbery. It is possible that this research model potentially estimates the merged effects of the routine periods (see Monk et al., 2010).
Aggregated-Time Outcome Analysis (Model V)
Model V analysis compared the effects of the combined outcome of robbery events to the time-based disaggregated outcomes. Table 3 shows the values of the regression coefficients for the aggregated outcomes. The results provided additional revelations. Once again, geographic mobility was significant (p < .0001). This result infers the time-independent influence of geographic mobility. This would appear reasonable since the estimation of geographic mobility is on the yearly turnover of residents’ population in block group housing units.
It would further affirm the results obtained in models II-IV, where geographic mobility predicted the number of robbery incidents during the daytime, evening, and late-night periods. Except that only the pairwise comparison of coefficients of the daytime and late-night outcomes for geographic mobility was significant. The aggregated outcomes for the liquor store were equally revealing. In the time-disaggregated model, liquor store predicted robbery outcomes during the daytime (p < .05) only. Nevertheless, the significance of the liquor store in model V was not time-dependent. The presence of liquor stores decreased the count of robbery by 67.5% (Table 4) but was just significant. The lagged liquor store variable, however, significantly predicted the aggregated outcome (p < .001). The results (regression coefficients) suggests that the presence of liquor stores in adjacent block groups increased (IRR = 2.908) the count of robbery in the focal block groups by about 190% (Table 3). The fact that liquor stores’ products are consumed offsite may provide hints to its strong spatial lag effect. The spatially lagged barbershops’ results for model V (p < .0001) affirmed the models II to IV results. This result suggests that barbershops’ influence on the robbery count is not dependent on the time of day. With the time-based aggregation of the events, the immediate effect of barbershops decreased the count of robbery by 1% (IRR = .991). The presence of liquor and barbershops decreased robbery in the immediate neighborhoods. However, the spatially lagged effect sharply influenced the increase of robbery in the focal block groups. Generally, for the significant predictors, the impact of time-of-day on the count of robbery appears variable. Comparatively, the impact of geographic mobility, liquor stores, and barbershops on the outcome in the city of Houston Downtown area appears independent of the recorded time of the offense.
With time-aggregated outcomes, Bernasco and Block (2011) found that the lagged variants of the alcohol stores had fewer effects than the variable’s immediate effects. In this study, liquor stores’ presence in adjacent block groups increased robbery count in the spatially immediate block groups. In addition, while the effect of the spatially immediate, and the lagged variables compared in Bernasco and Block (2011), here they generally differed.
This study’s key findings for the time-aggregated and the disaggregated time-dependent outcomes relate to the significance of barbershops and geographic mobility. Haberman and Ratcliffe (2015) also found that higher residential mobility or racial heterogeneity increased robbery count during the evening and late-night period. It is noteworthy that spatially immediate barbershops significantly increased robbery outcomes except during the morning period. Similarly, Bernasco et al. (2017) found a significant positive impact on robbery due to barbershops and salons’ presence across the 2-hour block period except during the morning period between 8:00 AM to 10:00 AM. According to the report, there was hardly any time-based outcome variation due to the effects of barbershops and salons on robbery, even at odd hours—late evenings and late-nights. In this study, barbershops’ presence had significant outcomes except during the morning—model I. In addition, the spatially lagged effect of barbershops was significant across the four-time periods. This finding indicates that the presence of barbershops in adjacent block groups influenced robbery outcomes in the spatially immediate block groups in the four outcome models, including the morning period when it increased robbery count by 280% (IRR). Notwithstanding this far-reaching spatial impact, the immediate effect of barbershops produced the least percentage change of all the significant predictors. This result suggests that barbershops’ effect on the robbery may not be strongly dependent on time, or its concentration, but likely by the social processes created by its presence. Considering that there were no significantly different pairwise comparisons of barbershop outcomes, this finding is reasonable because the appearance of barbershops does not involve an attractive target. The presence of barbershops may influence the other facilities’ capacity in a host neighborhood to attract street robbery. Barbershops commonly stay open beyond hypothesized 7 PM closing time—to provide services to customers, especially during the weekend typically Fridays—when workers get paid, and on Saturdays. Potentially crime attracting facilities that are open and likely in use most of the day would enhance robbery by opportunistic offenders (Haberman & Ratcliffe, 2015). Between the spatially immediate general merchant shops and barbershops—the two significant predictors in both the daytime and evening time models, the percentage increase in robbery incidents due to barbershops’ presence was much less than general merchant shops. The influence of barbershops in adjacent block groups, however, extended to effect robbery outcomes in the focal block groups. Bernasco and Block (2011) time-aggregated study found that the predictors’ immediate effect on robbery count in the City of Chicago was higher than their lagged impacts. In comparison, lagged barbershops’ impact in this study far exceeded its immediate results for both the time-aggregated and dis-aggregated data.
The residents’ migration pattern may explain the effect of geographic mobility—which, like barbershops, was significant in the daytime, evening, and late-night models. It is reasonable to assume that a high turnover of residents may affect the social efficacy of neighborhoods. Therefore geographic mobility would serve as an indirect measure of social efficacy explained by social disorganization theorists as a predictor of crime and delinquency rate (Shaw & Mckay, 1942; Bernasco & Kooistra, 2010). Ordinarily, residents’ stability in a neighborhood should not have a significant effect on the time of day distribution of robbery since the estimation of this factor was based on the percentage of the population not living in the neighborhood in the previous year. The single-digit percentage increase by geographic mobility (2.4%, daytime; 3%, evening; 4.1%, late-night) showed no significant difference in the percentage change of robbery counts across the four time periods. However, the pairwise comparison of the significant coefficients of geographic mobility across the periods revealed that there was a significant difference between the effect of geographic mobility on robbery counts during the daytime and late-night periods. The results suggest that the robbery outcomes were susceptible to neighborhood social efficacy because the difference between robbery percentage change during the late-night and daytime periods was barely 1.7%. Second, the significance of geographic mobility to robbery count across the three periods in the day is relatable to both the immediate and lagged barbershops. This raises a question about the relationship between community social efficacy and the count of barbershops in these two Houston police districts.
One pertinent question resulting from this study is that while the facilities significantly impacted robbery during the daytime, the highest count of robbery incidents occurred during the late-night (Figure 2). How do late-nights relate to activities in this part of the City of Houston? The daytime and morning events are more evenly dispersed across the block groups than the evening and late-night events (Table 1). It appears as if robbery incidents during the late-night and evening periods concentrate within certain block groups. There is a shift in RATs from daytime, where it is distributed across different areas of the Downtown districts; to concentrate within the specific blocks groups during the evening and late-night periods. The block group average robbery count was highest during the late-night, and evening periods. The standard deviation of the late-night outcomes is about nine, and four times that of the morning, and daytime outcomes, respectively. Similarly, the evening outcomes’ standard deviation is six, and three times that of the morning, and the daytime outcomes, respectively (Table 1).
This study invariably has its limitations. First, like previous studies, it used cross-sectional data of the facilities but temporal data of the distribution of street robbery incidents. It did not account for the period the facilities first came to be established at their current locations. A facility may be built after the period between 2009 and 2013 when the robbery incidents occurred. Such a situation potentially misrepresents the influence of the facilities on the outcome events.
Second, it is possible that the regression models’ fitting was misspecified and missed some crucial variables other than the examined factors which influence robbery incidents during the late-night and evenings. The examined facilities such as pawnshops, check cashing stores, general merchant stores, and liquor stores shut down by the late-night period. The late-night facilities, which may influence the robbery incidents, would include ATMs, Banks, night-clubs, bars, and restaurants (Bernasco et al., 2017; Haberman & Ratcliffe, 2015). Another possible factor could be the lack of consideration of the week’s day effect—especially for facilities such as barbershops, which receives a majority of its clientele during the weekends. Nonroutine social functions occur typically during weekends (Monk et al., 2010).
Accounting for the day of the week and misspecified variables may explain—why the late-night period recorded the highest number of robbery incidents. However, only geographic mobility and barbershops were significant. The third key is land use. Interestingly, Houston, the study area, has one of the most relaxed zonal planning laws in the country. Houston has a highly deregulated property market (Johnson, 1982; Neuman, 2003a, 2003b).The implication of differences in land use planning on the significance of crime generators and crime attractors on the count of robbery during the different daily routine periods is crucial. Land-use patterns may differ within various city areas. Adams et al. (2015) have noted that multiple land use mixes and the combination of facilities can encourage malignant systems that could influence crime. For instance, Anderson et al. (2013) found that neighborhoods with a mix of residential and commercial zoning experienced reduced crime compared to commercial zoning only neighborhoods in the city of Los Angeles. Residential-only neighborhoods recorded the lowest crime rate. Irvin-Erickson and La Vigne (2015) observed that the character of an area such as the socioeconomic status of a block group impacts the ability of train stations in Washington DC to generate particular types of crime. In other words, zoning laws and land-use patterns could have considerable influence on the distribution of crime in an area. Controlling for land use may be pertinent to understand the potential crime attractors’ actual effect on robbery count during the different times in a day. Extensive city-wide studies may miss this point. And so would not entirely explain how zonal planning laws and other related property regulation may well influence a crime attractor or generator on the robbery in different city neighborhoods because these cities comprise areas under diverse zoning systems and land use regulations—say the north of Philadelphia compared to its eastern neighborhood areas. Urban planning intervention policies potentially displace criminal activity from one area to another (Eck & Weisburd, 1995).
Notwithstanding these limitations, the findings in this study indicate that the study area shows some general pattern of relationship between the potential crime attracting facilities and robbery outcomes during the different periods in the day (Bernasco & Block, 2011; Bernasco et al., 2017; Haberman & Ratcliffe, 2015). However, some specific differences are discernable. The pairwise comparison of the different time-based outcomes for the predictors was mostly not significant. While some facilities influenced the response variable due to the function of disaggregated time in the day, others did not. Generally, for the significant predictors, the impact of time-of-day on the count of robbery is variable. Only geographic mobility had a significant difference between its daytime and late-night outcomes. The differences may be related to the functions of the types of facilities examined and the physical and social structure of the Downtown neighborhood. The functions of a neighborhood ultimately create its forms of opportunities for would-be offenders. As the layout of streets in Downtown areas impacts its accessibility, it should also affect offenders’ ease of access to potential targets. These findings in themselves are not comprehensive but serve as an indicator that the same facilities may develop unique patterns in different neighborhood types. The difference may be due to various localized functions, demographic structures, and zonal planning laws. These factors make smaller and more compartmentalized and comparative land-use area studies a requirement. In other to adequately understand and relate street robbery patterns to the structures, functions, and resilience often latent within a region’s unique environments (see Greenberg & Rohe, 1984) and demographic operators. By implication, the activity maps of offenders and victims, as well as the functions of the potentially criminogenic facilities, may likely have certain similarities in Downtown areas compared to other neighborhood types. Monk et al. (2010) described this as “local circumstances.” Therefore, it would be useful to explore the neighborhood differences due to the facilities’ impact by comparing the results of this and similar studies to other Downtown areas and other neighborhood types.
Footnotes
Declaration of Conflicting Interests
The author(s) declared no potential conflicts of interest with respect to the research, authorship, and/or publication of this article.
Funding
The author(s) received no financial support for the research, authorship, and/or publication of this article.