
Abstract
A crisis is conceptually defined as an unexpected situation requiring an urgent solution. The global climate crisis is especially significant, threatening the stability and livability of the world. Building on this conceptual framework, this study aims to explore the dimensions of stakeholder interactions to highlight the need for collective efforts to combat the climate crisis. Twitter (now known as X) interactions between climate and environment ministries in OECD countries were analyzed in R using graph theory. The study found that the United States ministry was the most followed. As the largest network node, Canada acts as both a gateway and hub. As a central player, Canada receives and disseminates information and possesses a high potential for interaction. France is connected to influential nodes and is therefore a leader in the chain of influence. Germany is a strong center of stability and acts as a leader/bridge node. Norway, Spain, and Greece are considered to be peripheral nodes. Furthermore, the network had a medium-strength community structure divided into four parts. These results highlight that interactions among OECD countries are insufficient and that climate and environment ministries can facilitate global cooperation to combat the climate crisis. Strengthening nodal connections is a recommended policy step to translate these results to real-life and industry-specific contexts.
Plain Language Summary
Why was the study done? The climate crisis is a major global issue, and countries need to work together to address it. The study aimed to understand how climate and environment ministries in OECD (Organization for Economic Co-operation and Development) countries interact with each other on social media, particularly Twitter. By looking at their interactions, the research wanted to see how these countries could collaborate more effectively to tackle the climate crisis. What did the researchers do? The researchers analyzed the Twitter accounts of climate and environment ministries from OECD countries. They used graph theory, a method that shows how things are connected, to see how often these countries’ ministries interact with each other on Twitter. They looked at the number of followers, the number of tweets, and who follows whom to understand the level of engagement and cooperation. What did the researchers find? The study found that the United States was the first country to create a Twitter account for its ministry and had the most followers. The United Kingdom had the highest number of tweets. However, many countries were not very active in interacting with other countries’ ministries. For example, Austria, Ireland, Luxembourg, and Türkiye had little or no interaction with other countries. The study showed that some countries were much more connected than others, with Canada and France having the highest number of interactions. What do the findings mean? The study shows that there is room for improvement in how climate ministries interact with each other on social media. The climate crisis requires collective global action, but the research suggests that interactions between ministries are currently limited. By increasing communication and cooperation through social media, these countries could work more effectively together to address the climate crisis.
Introduction
Crises are part of everyday life, affecting both individuals’ business and social lives. Several contemporary crises have had massive impacts on humanity. Many have become chronic, and the necessary steps have not been taken to resolve them. The climate crisis is among the most important of these.
Many studies have been conducted on crises. Campiranon and Arcodia (2008, p. 159) examined market segmentation in times of crisis within the meetings, incentives, conventions, and exhibitions (MICE) sector in Thailand. The MICE industry is strongly affected by crises, and market segmentation plays a key role in attracting tourists to this sector. In addition, Kim et al. (2005, p. 369) discussed the negative impact of the Severe Acute Respiratory Syndrome (SARS) epidemic on the Korean hotel industry. Furthermore, Butler et al. (2016) considered the water crisis in terms of the fundamental right to access clean drinking water. Kaewkitipong et al. (2012) discussed the connection between social media and crisis management, emphasizing the importance of using social media to meet different information needs and conduct successful crisis projects.
The literature also includes many studies on the environment. For example, Sun et al. (2025) theoretically considered how digital enhancement affects the sustainable development of green public services through a cross-analysis of Structural Equation Modeling (SEM) and Artificial Neural Networks (ANNs). Di, Chen, Shi, Cai, and Liu (2024) provided guidance for policymakers aiming to stimulate sustainable consumption behaviors by through structural equation modelling and artificial intelligence analysis and synthesis methodology. Furthermore, Sun et al. (2024) presented industrial carbon reduction strategies by analyzing the synergistic contributions of digital technology applications, green supply chain management, consumer behavior, and corporate social responsibility to development.
Specific studies on climate crises have also been conducted. Bryant et al. (2015) analyzed accumulation and displacement dynamics in the Clean Development Mechanism (CDM). The study identified the CDM as a solution to the ecological crisis of climate change, securing production conditions for the fossil fuel industry and promoting new accumulation opportunities for other companies. Fraser et al. (2020) examined whether local governments’ social capital and public services improve environmental policy outcomes considering 1,741 Japanese communities from 2005 to 2017 and modeling greenhouse gas emissions in four sectors. Engstrom et al. (2020) analyzed both the COVID-19 and climate crises from a public health perspective, showing that climate policy regarding green infrastructure projects, reforestation, and the reduction of labor taxes supports economic recovery.
However, this study focuses on stakeholder interactions during the crisis phase, aiming to determine which connections between actors influence the climate crisis. Collective action among stakeholders is clearly needed in the solution phase of this crisis. Hence, the relationships and information shared between actors are important. This study considers Twitter (now known as X) interactions among climate and environment ministries of Organization for Economic Co-operation and Development (OECD) countries. The sample therefore consisted of ministries from OECD countries with Twitter accounts. As the world’s largest economies, these countries’ activities contribute the most to climate change. For this reason, this study focuses on climate change drivers that arose during the sampling phase. Existing climate change crisis literature has focused on individual actors (Becken et al., 2021; Shim, 2024) and specific social media movements (Padilla-Castillo & Rodríguez-Hernández, 2023), or on specific elements such as social media news (Hopke & Hestres, 2018) and social media post content (León et al., 2022). This study aims to address gaps in the literature by focusing on official institutions’ social media interactions and their meanings in terms of the climate crisis. In addition to providing a theoretical discussion, this study presents a cross-sectional picture and situational analysis. It explores the importance of public communication in combating the climate crisis, focusing on the interactions among high-contributing countries. It also discusses the benefits of increased public interactions in combating the climate crisis. To achieve these aims, this study employs qualitative research methods and graph theory.
Literature Review
Historically, many societies have faced crises. These crises should not be viewed only as consequences of management decisions, as they also encompass social diseases, natural disasters, etc. They can occur suddenly due to many factors. The term “crisis,” which originated in ancient Greece, refers to decisions between right and wrong, or between life and death, in the context of law, medicine, and theology. This original meaning began to change in the 17th century when the term was incorporated in politics, economics, history, and psychology. Because of its metaphorical flexibility, the term “crisis” is used in the decision-making and selection phases in almost all areas (Koselleck & Richter, 2006, p. 358).
Crises pose a threat to people and institutions, creating conditions that are inadequate (Bülbül, 2004, p. 73) and placing pressure on them to identify solutions when least expected (Balta Peltekoğlu, 2004, p. 313). More generally, a crisis can be defined as an experience that attracts collective attention, compels action, generates affect, or as an observation that generates meaning (Masco, 2017, p. 565). The term is applied to many areas of life and is associated with concepts such as uncertainty, the need for action, threats, inadequacy, time pressure, and unexpectedness.
According to Parsons (1996, pp. 26–27), crises can be divided into three categories: immediate, emerging, and ongoing (persistent). Immediate crises offer little to no warning of their approach. Emerging crises are also somewhat unpredictable. Even when an emerging crisis is predicted or identified in its early stages, acknowledging that it is a major problem is difficult. Permanent crises, on the other hand, extend over weeks, months, and years. Speculation and rumors surrounding permanent crises play important roles and are sometimes fed by the press. Gundel (2005, pp. 110–112) identifies four types of crises: conventional, unexpected, persistent, and fundamental. Conventional crises have predictable and known probabilities of impact. Dangerous engineering systems typically produce these crises, and natural disasters are rarely included in this classification. These crises are considered manageable, even if they cause significant losses. Unexpected crises are rarer than conventional ones. Their impact is greater and preparation for such crises is inadequate. Intractable crises can be predicted, but they are difficult to suppress. An example is the tragedy of the 1985 European Cup Final. Fundamental crises are the most dangerous type, as they cannot be prepared for and are initially poorly understood. Although rare, their destructive potential is high.
Crises are important turning points for both society and institutions. From an institutional perspective, crises fall within the realm of management science. Many institutions are confronted with crises for various reasons. However, crises must also be managed socially. There have been several important global crisis situations, particularly in public health. Various diseases have spread across regions (Masco, 2017, p. 565) with regional and global consequences The COVID-19 pandemic is one of the most serious examples. Others include the Ebola epidemic and antibiotic resistance.
Crises are driven by stakeholder expectations (Coombs, 2018, p. 52). Regardless of the type of crisis, certain people or interest groups are affected by it. Activities to combat crises should consider their current characteristics, rather than relying on a general approach. It is not possible to resolve every crisis similarly. The nature and extent of crisis impacts differ, highlighting the complexity of crisis management. Particularly in turbulent environments, it is necessary to be cautious and prepare for alternative scenarios (Khodarahmi, 2009, p. 524). Many variables are important in crisis management, especially communication. The information flow established between stakeholders plays a fundamental role in crisis situations (Khodarahmi, 2009, p. 524). Crisis communication is the strategic use of words and actions to manage information and meaning during a crisis (Coombs, 2018, p. 51). In this context, communication determines the relationship networks that are utilized to manage and end crises through collective efforts.
The climate crisis is particularly pressing. The debate is no longer about whether climate change will occur but about its timing and extent (Crist, 2007, p. 29). As CO2 emissions increase, achieving the climate goals set at the Paris Meeting becomes increasingly difficult. Although the climate crisis has been foreseeable for years, CO2 levels increased significantly from 1990 to 2018 (Banister, 2019, p. 565). The 26th United Nations (UN) Climate Change Conference (COP26) has foregrounded the climate crisis, but increasing CO2 levels highlight the inadequacy of climate crisis responses.
Considering its widespread use, social media could become a significant channel for addressing the climate crisis. Social media may also play an important role in international environmental management. From the perspective of individual actors or civil society organizations, social media facilitates information gathering, interaction, and participation in policymaking. Civil society organizations and individuals have begun using social media to mobilize for environmental protection, shed light on various issues, and advocate for political reform. Government social media is important for fostering environmental awareness, international co-operation, and sharing policy developments. It bridges the divide between official environmental protection agencies and the public, facilitating the participation of non-governmental actors. Official environmental agencies are increasingly using social media, giving citizens access to information and opportunities to learn and participate at different levels in a wide range of environmental issues, including natural resource use, climate change, and biodiversity (Chang et al., 2024, p. 44).
Díaz-Díaz and Pérez-González (2016, p. 104) identified social media as an important tool for civil society because it sets the political agenda and influences how discourse is framed. While social media is primarily used for information sharing, Sinclair et al. (2017, p. 148) note its uses to initiate, sign, and send public petitions regarding employers and the local environment. Stevens et al. (2016, p. 104) define social media as a medium in which various factors interact to influence agri-food sustainability management. They emphasize that social media’s networked structure provides a public platform for information dissemination and interactive communication, as well as a decision-making resource. Nulman and Özkula (2016, pp. 11–12) demonstrate that digital tools can facilitate direct communication on environmental issues, disseminate information, generate interest in mass media, make calls to action, and drive engagement. They state that increased use of digital tools, such as social media, directly strengthens the flow of information, allows distant actors to network, increases media attention and national and international news coverage, creates public opportunities for organizing and taking action on issues or policies, and facilitates communication among supporters.
Online networks are considered to have a significant connection with policy learning. Methods such as Social Network Analysis (SNA) can present a system’s policy-learning architecture in real time by uncovering general patterns. Policy actors’ positions and network structures provide information about likelihoods of learning and policy change (Howlett et al., 2017, p. 246). Rethemeyer (2006, p. 259) argues that the Internet has transformed policy networks to allow internal and external actors to challenge those with structural power. Those with structural power then attempt to shape the Internet to maintain their positions. Examining two policy networks, they emphasize that the Internet has made networks more exclusionary as most interactions occur among electronic core members. Hence, the Internet reinforces existing patterns of authority. Considering the Indonesian biodiesel policy network, Howlett et al. (2017, p. 245) demonstrate that government officials play a significant role in policymaking and learning as the core of policymaking and knowledge transfer networks. Accordingly, those in positions of power can both increase and obstruct learning pathways for policy change. Therefore, while their practicality is debatable, online networks are an important tool for policy learning.
It is often uncertain whether online interactions lead to offline ones. Calls for physical protests can be made using social media platforms. However, individuals can also virtually participate in movements through social media, arguably reducing the cost of action. There are concerns about decreased levels of physical activism as some people only take action through digital channels; however, social media also encourages physical activism by providing information about physical protest actions (Nulman & Özkula, 2016, p. 12). In some cases, offline, and online actions may be unrelated because people behave differently in these spaces. However, as social media posts can mobilize others for offline protests, online, and offline activism are positively correlated (Greijdanus et al., 2020, p. 49). Digital activism can therefore encourage physical activism, including public participation in environmental protection initiatives and climate action across borders. Individuals can unite around the climate action cause through social media interactions and increase their leverage, thereby placing public pressure on policymakers. Indeed, YouTube was used during the COP15 protests (Askanius & Uldam, 2011), and the Fridays for Future movement utilized Twitter (Padilla-Castillo & Rodríguez-Hernández, 2023), and Instagram (Shim, 2024). Prominent climate actors like Greta Thunberg share their climate action journeys on social media (Krebs et al., 2024), and other individual climate actors have followed suit. These examples demonstrate how social media platforms and interactions can influence climate action across borders as a public sphere.
Crisis management requires close collaboration among stakeholders. The current climate crisis should also be addressed within this stakeholder framework. Di et al. (2023, p. 15) note that sharing strengths, resources, and best practices, as well technology transfer and joint research and development projects, can create synergies. Hence, those who caused the crisis must collaborate effectively with those affected by it. Arguably, the greatest responsibility for the climate crisis lies with the actors contributing to it. Their interactions constitute an important dimension of crisis management. Although some countries make larger contributions, the climate crisis is a global crisis requiring the consistent co-operation of global actors.
Methods
This study conducts a social media analysis of the climate and environment ministries of OECD countries, aiming to reveal the dimensions of stakeholder interactions to highlight the need for collective efforts to combat the climate crisis.
Population and Research Sample
While the climate and environment ministries of OECD countries form the research population, the sample consists of the climate and environment ministries of OECD founding members. This study considers the official climate and environment ministry Twitter accounts of Austria (Austrian Federal Ministry of Climate Action, Environment, Energy, Mobility, Innovation and Technology, n.d.), Belgium (Health Food Chain Safety and Environment, n.d.), Canada (Environment and Climate Change Canada, n.d.), Denmark (Ministry of Environment of Denmark, n.d.), France (Ministry of Ecological Transition and Territorial Cohesion, n.d.), Germany (Federal Ministry for the Environment Nature Conversation Nuclear Safety and Consumer Protection, n.d.), Greece (Ministry of Environment and Energy, n.d.), Iceland (Ministry of the Environment, Energy and Climate, n.d.), Italy (Ministry of Ecological Transition, n.d.), Ireland (Department of the Environment Climate and Communications, n.d.), Norway (Ministry of Climate and Environment, n.d.), Luxembourg (Ministry of the Environment Climate and Sustainable Development, n.d.), Portugal (Environment and Climate Action, n.d.), Spain (Ministry for the Ecological Transition and the Demographic Challenge, n.d.), Sweden (Ministry of the Environment, n.d.), Switzerland (Federal Department of the Environment, Transport, Energy and Communications, n.d.), the Netherlands (Ministry of Economic Affairs and Climate Policy, n.d.), the United Kingdom (Department for Business, Energy and Industrial Strategy, n.d.), the United States of America (United States Environmental Protection Agency, n.d.), and Türkiye (Ministry of Environment, Urbanization and Climate Change, n.d.).
Research Method
This study used Social Network Analysis (SNA), an application of graph theory that facilitates relationship pattern analysis among actors (Dado & Bodemer, 2017, p. 159) within social networks. SNA allows resource exchange to be examined through a relationship lens (Haythornthwaite, 1996, pp. 323, 326) between interacting social entities (Makagon et al., 2012, p. 153). This reveals the positions, characteristics, and forms of actors’ connections (Borgatti et al., 2009, p. 894). Graph theory is a branch of mathematics dealing with the arrangement of vertices and the edges between them (O’Regan, 2023). In other words, a graph G = (V, E) is a network based on a set of mathematically defined objects in the form of vertices and nodes (Chakraborty et al., 2018, p. 722). Examples include trees (connected graphs without cycles); k-regular graphs (each vertex has the same degree); and complete bipartite graphs, where vertices are divided into two sets with edges connecting every vertex in one set to all the vertices in the other (Ghanbari & Alikhani, 2023). Graph theory can be applied to social media networks; in particular, it can be applied to follower networks on Twitter (Chakraborty et al., 2018, p. 723). In this sense, graph theory can represent interactions between actors. Furthermore, graph theory has recently become more prominent and evolved (Chung, 2010, p. 726) for diverse use cases including social network modelling, social network analysis, and user analytics (Majeed & Rauf, 2020, p. 1).
Analysis
This research method was applied to official climate ministry Twitter account data collected on October 10, 2022. This study employed a qualitative approach to analyze the interactions of OECD countries in the digital environment. Qualitative research attempts to question, interpret and understand a problem in the natural environment in which it is located (Baltacı, 2019, p. 369). No keywords were used to identify the relevant countries’ accounts. Unofficial content from other accounts was not included in the study. Data were analyzed using the open-source computer programming R Studio (R Core Team, 2021). The “igraph” and “dplyr” packages were used for the network analysis (Dplyr R Package, 2025; Igraph R Package, 2022). The level of interaction among actors were represented both mathematically and visually across the network. See Appendix A for the code used in this study.
Results
Table 1 presents the Twitter account information for the climate and environment ministries of the fifteen OECD founding countries, including the account name, its creation date, follower count, following count, and its total number of tweets. Belgium, Denmark, Iceland, Sweden, and the Netherlands did not have official ministry Twitter accounts; hence, these countries were not included in the analysis.
Official Climate and Environment Ministry Twitter Accounts of OECD Countries.

Source. Authors.
Note. Accessed on October 06, 2022.
The United States of America (USA) was the first among these countries to create an account (2008), followed by Norway, Switzerland, and the United Kingdom (UK) in 2009. Austria and Spain were the last among these countries to create an account.
Figure 1 shows that the USA has the largest following (628.6 K followers) and Austria has the smallest (744 followers).

Follower counts of Official Climate and Environment Ministry Twitter accounts of OECD countries.
Figure 2 shows that the UK follows the most accounts (2,620 accounts). Türkiye, on the other hand, follows the smallest number of accounts (75 accounts) among OECD countries.

Following counts of Official Twitter Accounts of Climate and Environment Ministries of OECD countries.
Among the OECD countries, the USA has posted the most tweets (27.8 K tweets). Portugal ranks second to last with 2,994 tweets, and Austria ranks last with 1,021 tweets (Figure 3).

Total Tweets of Official Twitter Accounts of Climate and Environment Ministries of OECD countries.
Table 2 shows the number of Twitter users in millions among OECD countries in 2023. populations of these OECD countries. With this in mind, the ministries’ accounts are followed by substantial numbers of users. Figure 4 presents a robustness analysis comparing climate and environment ministries’ follower counts to the total number of Twitter users in their respective countries.
National Twitter User Counts of OECD Countries (2023).
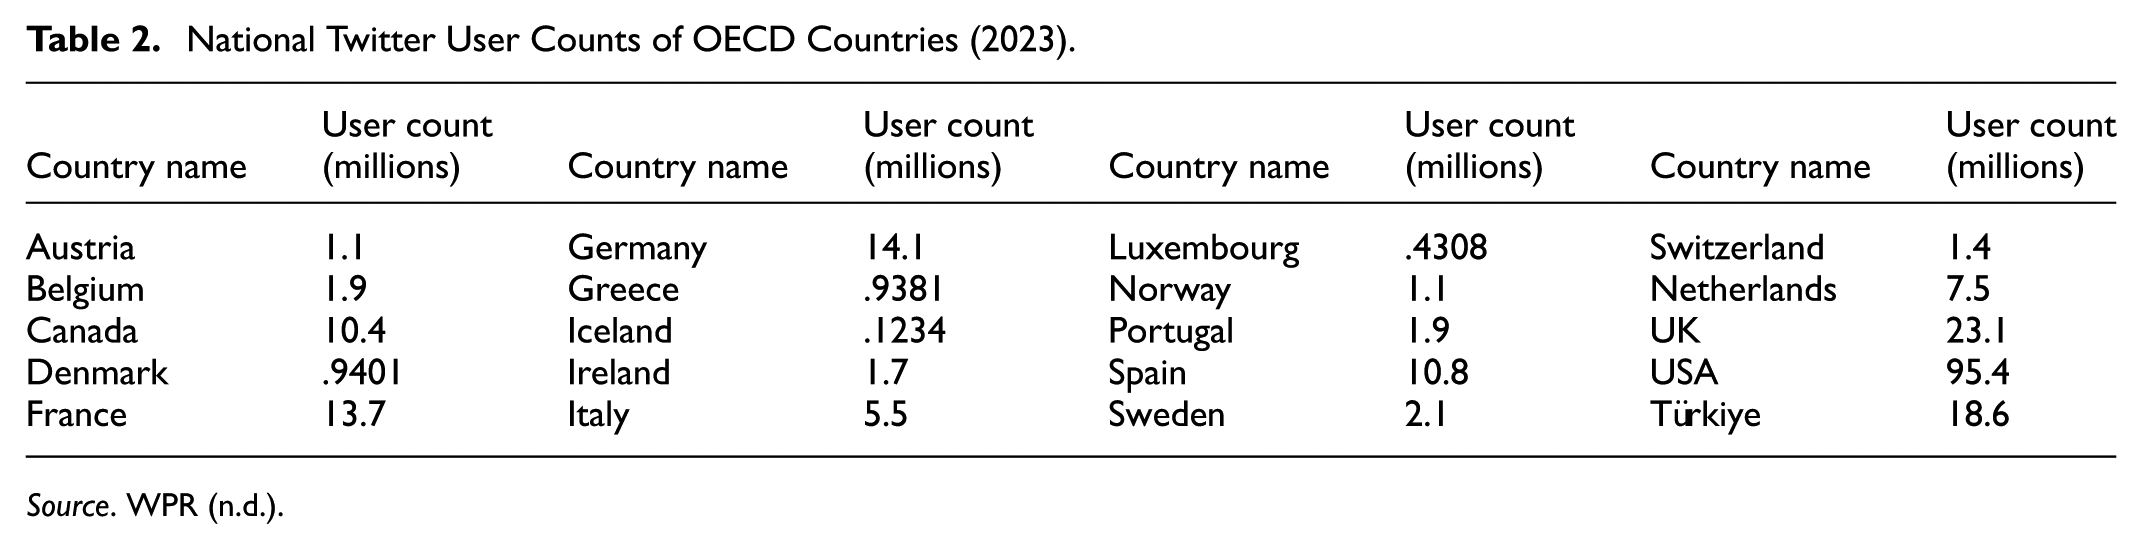
Source. WPR (n.d.).

Normalized Twitter follower ratios of Climate and Environment Ministries of OECD countries.
Luxembourg (7.43%) and Canada (4.14%) had the largest normalized follower ratios in 2023, falling into the “High Engagement” group effectively using social media for environmental communication. Türkiye (2.35%), Italy (2.19%), Greece (1.67%), France (1.59%), and Germany (1.28%) constitute the “Medium Interaction” group. Although they have achieved some access relative to their populations, their potential has not yet been fully utilized. Türkiye stands out for both its absolute and normalized follower counts (see Table 2). Ireland (.98%), the UK (.86%), Portugal (.76%), the USA (.66%), Spain (.64%), Norway (.51%), Switzerland (.20%), and Austria (.07%) constitute the “Low Engagement” category, as their ministry Twitter accounts reach only a small fraction of users in their countries. This suggests that digital public communication performance is below expectations, particularly in countries with large and developed social media infrastructures (e.g., the USA and UK).
Graph theory was then used to examine the relationships between the official Twitter accounts of climate and environment ministries in the fifteen OECD countries included in this study and the Twitter accounts of equivalent institutions in other OECD countries. Institutions are numbered in alphabetical order to ensure the network diagram is readable. Figure 5 shows the diagram numbers and corresponding OECD countries.

OECD countries and their corresponding diagram label numbers.
Four key centrality metrics assess the relative significance or influence of a node within its overall network structure: betweenness, closeness, degree, and eigenvector analysis (Okamoto et al., 2008). Table 3 presents the network analysis results across these metrics.
Centrality Analysis of Official Climate and Environment Twitter Accounts of OECD Countries.

Note. NaN = not a number.
Centrality refers to how centrally a node (i.e., an individual in social network analysis) is located within a network. Betweenness refers to a node’s role as a bridge along the shortest path between nodes. It is used to identify influential individuals or information carriers in social networks, strategic actors in policymaking, and communication bottlenecks in institutional structures. Betweenness centrality determines mediating roles in networks. Being located at a point where other paths intersect is important, reflecting a high betweenness centrality (Zhang & Luo, 2017, p. 301). That is, betweenness centrality indicates the extent to which a node is located between other paths. Betweenness centrality also acts as a control indicator, describing the extent to which an actor controls the flow of information between others (Newman, 2005, p. 40).
In the betweenness centrality analysis, Canada has the largest node (6.5). This indicates that it is a central player, the broker through which communication between many other nodes occurs. Most information passes through Canada’s node. France (.5) and Italy (3.0) are intermediaries in the network. These large nodes play critical roles in information transfer, but they are not as central as Canada. Greece, Norway, Portugal, Spain, and the UK are peripheral actors in the network with betweenness values of zero (.0). Often having only a single connection, these counties are inefficient in carrying information to the center of the network. Directional connections indicate that the USA receives connections from many country nodes, but this does not centralize them within the information network like Canada, which is more influential. Removing Canada from this network could seriously disrupt its structure because of the network’s high structural dependency on Canada. Countries with low betweenness values, such as Spain and the UK, are typically isolated or exclusively recipients within the network. Finally, Austria, Ireland, Luxembourg, and Türkiye are not included in the network, as they do not interact with peer organizations’ Twitter accounts. The node sizes according to betweenness centrality are shown in Figure 6.

Betweenness centrality analysis of Official Climate and Environment Ministry Twitter accounts in OECD countries.
Closeness centrality analysis shows how centralized or accessible the nodes are in the network (Mayer et al., 2009, p. 609), measuring the total distance between a node and other nodes. A node has a high closeness centrality value if its shortest path to other nodes is small (Zhang & Luo, 2017, p. 301). Closeness centrality can also be defined as the value calculated by solving the shortest path problem (Okamoto et al., 2008, p. 187). Figure 7 represents the closeness centrality analysis, with each node scaled according to its closeness centrality. That is, the larger the node size, the shorter its average distance to reach other nodes.

Closeness centrality analysis of Official Climate and Environment Ministry Twitter accounts in OECD countries.
Canada, France, Germany, Greece, Italy, and Portugal have high closeness centrality (all 1.0). These nodes can reach all other nodes in the network along relatively short paths. Information can spread more quickly through these nodes and their corresponding countries in the communication network. France and Germany’s node sizes and locations indicate that these countries have a high reach capacity. Small nodes represent low closeness centrality. In our study, the UK (.5555556) and Norway (NaN) have smaller nodes further from the center. This makes it more difficult to reach other countries. Spain (NaN) and the USA (NaN) have nodes that are either disconnected or have an undefined closeness value; in other words, they cannot reach all nodes in the network. Therefore, these nodes are barely visible in the graph.
If a node can reach many nodes but not vice versa, this unbalanced structure affects the closeness centrality value. High closeness is advantageous for accessing and disseminating information, that is, these nodes are ideal points for decision-support mechanisms. In our study, Canada is the most suitable hub for processes such as information dissemination, resource allocation, and strategic decision making. By contrast, nodes with low or NaN closeness values are marginal, disconnected, or weak-reach actors. Low-closeness nodes, such as those in Norway and Spain, are generally external to the network and play one-way or low-access roles.
Degree centrality relates to the total number of direct connections to other nodes in a network (Opsahl et al., 2010, p. 246; Zhang & Luo, 2017, p. 301). In the total degree centrality analysis shown in Figure 8, node size is determined by the total number of incoming and outgoing connections. Larger nodes are the most connected and active elements in the network. These nodes are influential and potential network hubs. Small nodes have few connections; that is, they are marginal and passive.

Total degree centrality analysis of Official Climate and Environment Ministry Twitter accounts in OECD countries.
Canada (6) is the largest node. It predominantly has two-way relationships with other nodes. As it has many incoming and outgoing connections, it acts as a hub for both receiving and disseminating information. It is at the structural center of the network and has a high potential for interaction. France (5), Germany (4), Italy (4), the USA (4), and Switzerland (3) have medium-sized nodes. France and Germany may serve routing and relay functions, with France being connected to both Canada and Germany. While Italy and the USA are connected to Canada, they also provide connections to their own smaller networks such as Greece (1) and Portugal (2). Norway (1), the UK (1), Spain (1), and Greece (1) have small-sized nodes. In general, they are connected to a single node, mostly to the USA. Positioned at the edges of the network, they appear passive in terms of information transfer. These nodes can be considered as marginal actors within the network.
In summary, Canada is the information distribution center, the most important actor in terms of leadership or coordination, and the most effective site for initiating interventions. France and Germany served as intermediary nodes. Norway, Spain, and the UK access information later and are further away from central processes. Connecting Canada with marginal nodes such as Norway, Spain, and the UK can increase the network’s inclusiveness.
Eigenvector centrality analysis was used to measure countries’ levels of leadership or influence. This metric considers not only the number of connections a node has, but also the importance of those connections. Nodes connected to influential nodes are considered more influential than those that lack such connections. This is based on the logic that a node’s connections play a crucial role in shaping its centrality and influence (Borgatti et al., 2006). Therefore, eigenvector centrality also considers centrality measures (Maharani et al., 2014, p. 2).
France has the highest eigenvector centrality (1.0), with the largest node in Figure 9. This node is important because of its many connections and connections to influential nodes, such as Germany (.87667032) and Canada (.87405716). France is therefore at the heart of the network’s chain of influence, with Germany and Canada serving as transit points or routers for information. The Canada node is medium sized in the eigenvector centrality analysis, appearing slightly smaller in Figure 9 than in previous analyses (degree, closeness, and betweenness). This may indicate that the node lacks direct connections to highly influential actors, or that its connections are more diffusely distributed across the network. Small nodes in Norway (.21735401), the UK (.21735401), Spain (.03037993), and Greece (.11461375) have small eigenvector values; they are either connected to inactive nodes or are isolated. They are peripheral nodes that are inactive and weak in information flow.

Eigenvector centrality analysis of Official Climate and Environment Ministry Twitter accounts in OECD countries.
Next, countries were classified based on their roles (i.e., “leader,”“bridge,” or “marginal”) to develop an understanding of the network’s structural characteristics and functional dynamics. This aspect of SNA considers the number of connections an actor has, as well as the connections they make, their direction, and the actor’s position within the network. This role-based approach allows for a theoretical analysis of social relations and facilitates practical policy and strategy development (Borgatti & Halgin, 2011, p. 1169; Wasserman & Faust, 1994, p. 5). “Leader” actors are generally characterized by high degree and eigenvector values (Freeman, 1978). They are at the center of a network with a high interaction capacity. “Bridge” actors have high betweenness centrality, facilitating information transfer between different sub-communities (Borgatti & Halgin, 2011). Conversely, peripheral actors with low degree and centrality values are classified as “marginal” (Hanneman & Riddle, 2005; Scott, 2017). These nodes have limited connections and low influence. The role-based classification criteria applied in this study are listed in Table 4.
Role-Based Classification Criteria.

Source. Authors.
Our study identifies three primary roles in the network structure: leader, marginal, and other. Canada, France, and Italy are leader nodes with high degree, closeness, and eigenvector values. They play significant roles in information dissemination within the network through direct connections with many nodes and associations with influential nodes. Norway, Portugal, Spain, the UK, and Greece are marginal actors with betweenness values of zero. They are typically connected to only one or two other nodes. Furthermore, some nodes such as Norway, Spain, and USA have undefined closeness values (NaN), indicating that they struggle to reach the wider network. Germany, Switzerland, and the USA are nodes with a medium level of connection and influence that cannot be categorized as either leader or marginal actors. Although these nodes do not play critical roles in information flow, they hold supportive positions that contribute to network integrity.
Community analysis was then performed to detect groups of countries with similar characteristics or strong interactions. A community can be conceptualized as a network of closely related entities. This structure is formed by a combination of individual entities that demonstrate reciprocity in their interactions with one another. Community members interact more frequently with each other than with those outside the group (Bedi & Sharma, 2016, p. 116). Uncovering structural information regarding the network’s internal structure or subgroups establishes an understanding of which nodes act together or exhibit common behaviors. Community analysis models how information spreads through the network, identifying which groups are isolated from each other and where their connection points are. By identifying groups that lack interaction, collaboration can be increased. Critical actors can also be identified. This study identifies countries acting as bridges between communities to highlight their strategic importance as actors within the network. Community detection algorithms, such as Louvain, Girvan-Newman, and Label Propagation, group nodes with similar connectivity (Çetin & Amrahov, 2022; Torkaman et al., 2023). These groups typically have high internal connectivity and low external connectivity, subdividing the network into more meaningful substructures. This study uses the Louvain community detection algorithm (Blondel et al., 2008). The community analysis results are shown in Table 5.
Community Analysis of Official Climate and Environment Ministry Twitter Accounts in OECD Countries.
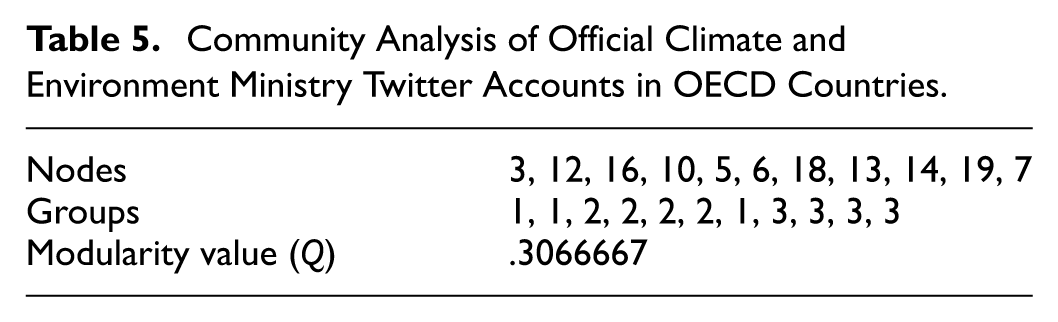
The Louvain community detection algorithm divides the network of 11 nodes into 4 communities. The first community includes France, Germany, Italy, and Switzerland. These tightly connected countries have fewer connections than outside countries, forming a small group that is likely to focus on a common topic or share a role. The second group includes Greece, Portugal, Spain, and the USA. They exhibit dense connections, with the USA acting as a bridge to other communities. The third group includes Canada, Norway, and the UK. Canada is at the center of this community and is connected to other communities, as indicated by its high betweenness centrality value. The center group, which comprises Canada, Italy, and the USA, is connected to other communities. Although its boundaries are less clear, these bridge nodes facilitate information flow between communities. A community detection analysis graph is presented in Figure 10.
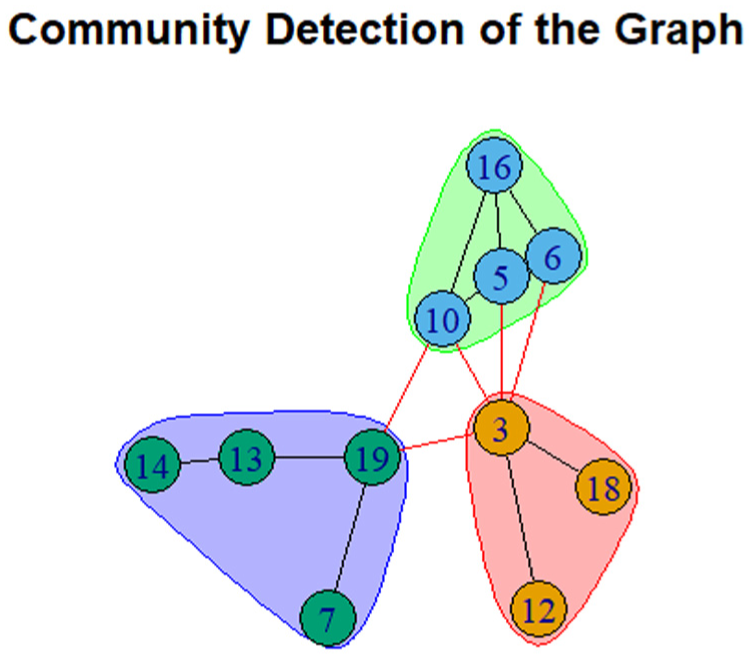
Community detection graph of Official Climate and Environment Ministry Twitter accounts in OECD countries.
A modularity analysis was conducted to compare the network’s number of internal communities with those of a random network. Modularity is a numerical measure of a network’s community structure, indicating the extent to which a network is divided into communities. Q values greater than .3 to .4 generally indicate network modularity (Fortunato & Barthélemy, 2007, p. 37), and these values range from .3 to .7 (Sah et al., 2014, p. 4). Higher Q-values represent stronger community structure. Values less than .3 indicate weak or uncertain community structure; values between .3 and .4 are considered average; and values greater than .4 represent strong community structure. The modularity value of .3067 reported in Table 5 indicates that a moderate community structure is present in this four-category network, but that this structure is not very strong. Nodes have more connections to other nodes within their communities than would be expected in a random network; however, the structure is not strongly clustered. Hence, the community detection algorithm performed reasonably well in distinguishing whether the connections in the network were concentrated inside or outside.
Discussion
The climate crisis is one of the most pressing contemporary problems. For humanity’s survival, a livable climate with stable conditions is required. As climatic conditions are predicted to gradually worsen, collective efforts are important to encourage climate conscious perspectives. Most problems in this regard arise in the implementation of steps to combat the climate crisis. Furthermore, many actors interact with one another and contribute jointly to the climate crisis.
From this perspective, this study focuses on the interactions between actors with some extent of influence on the climate crisis. It examines the Twitter accounts of OECD countries, conducting an SNA using graph theory to uncover their interactions. According to the results, The USA was the first OECD country to create an official climate and environmental ministry Twitter account, whereas Austria and Spain lagged behind. The USA’s account had the most followers (628.6 K), the UK had the most following count (2.620). UK which also posted the largest total number of tweets (27.8 K). Austria ranked last among OECD countries, posting 1,021 tweets.
Germany is followed by Canada and Switzerland, while Germany only follows France. Norway is followed by Canada. Interestingly, Portugal follows Spain, whereas Spain does not follow Portugal. Switzerland is followed by Italy, Germany, and France. This suggests that neighboring countries are interconnected in terms of their interactions. In other words, while Switzerland does not follow Austria, Switzerland follows all of its neighboring countries. Geographic proximity significantly influences social networking (Breitmar et al., 2024, p. 1), and this result supports the idea that countries with similar climates tend to interact with each other, even if they are not neighbors sharing borders. This can also be linked to the concept of “cultural proximity,” which describes the tendency of people from similar countries or regions to interact with each other due to similarities in history, language, religion, race, etc. (Trepte, 2008, pp. 4–5). However, conversely, such differences can create “border effects,” establishing structural barriers that make it difficult to establish connections.
Canada and France have the highest levels of engagement. Although the USA is followed by four countries, it does not follow any country. Canada, on the other hand, follows four different countries, but only followed by Italy and UK. In this context, USA is the most followed country, whereas Canada has the highest number of followings. Austria, Ireland, Luxembourg, and Türkiye are not followed by other countries and also do not follow other countries themselves.
Betweenness centrality analysis identifies Canada as the largest node in the network. Hence, Canada has the highest intermediary value and communication between many nodes passes through it. France and Italy, on the other hand, play critical roles in information transfer as network intermediaries. Although their roles are not as central as that of Canada, they remain significant. To emphasize Canada’s importance in the network, its removal could significantly disrupt the network structure. Closeness centrality analysis identifies Canada, France, Germany, Greece, Italy, and Portugal as the largest nodes. They can access other nodes in the network via shorter routes, thereby allowing faster information dissemination. France and Germany stand out in terms of size and location as countries with high access capacities. In particular, Canada appears to be the most suitable hub for information dissemination, resource allocation, and strategic decision making.
Total degree centrality analysis also identifies Canada as the largest node. With predominantly two-way relationships with other network nodes, Canada has many incoming and outgoing connections. Therefore, it is a central actor in terms of both information reception and dissemination, with a high potential for interaction. This highlights Canada’s importance in terms of leadership and coordination. Eigenvector centrality analysis reveals that France has the highest value. France has many connections to influential nodes, acting as a transit point or router for information, like Germany and Canada. However, Canada, with its prominent betweenness, closeness, and total degree centrality, appears smaller in terms of eigenvector centrality. This can be explained by Canada’s lack of direct connections to influential actors; instead, its connections are dispersed throughout the network.
Taken together, these analyses demonstrate that Canada, with its very high interconnectivity, degree, and proximity, plays the role of a network gateway and hub. France, with the highest eigenvector, leads the chain of influence. Germany is a strong center of balance across all metrics and stands out as a router/bridge node. Norway, Spain, and Greece have low values on all metrics; therefore, they can be considered as marginal/peripheral nodes. Finally, community analysis divides the network into four parts. The first community consists of France, Germany, Italy, and Switzerland; the second consists of Greece, Portugal, Spain, and the USA; the third consisted of Canada, Norway, and the UK; and the fourth consists of Canada, Italy, and the USA. A modularity test revealed that these are moderate-strength communities.
Furthermore, the relevant ministries of some OECD countries do not have Twitter accounts: Belgium, Denmark, Iceland, Sweden, and the Netherlands. Although the Iceland ministry website links to a Twitter account, this link leads to the minister’s personal Twitter profile. Hence, the minister (Gudlaugur Thor Thordarson) and not the ministry itself interacted with other actors. Additionally, different countries give different names with different emphases to their ministries. Germany is the only country that emphasizes nuclear safety in its ministry name. Belgium highlights health and the food chain, France emphasizes transform regional harmony, and Ireland amplifies the communication dimension. Luxembourg underscores sustainability, whereas Switzerland’s naming encompasses transport, energy, and communication. While the Netherlands emphasizes economic relations, UK highlights business, energy, and industrial strategies, and Türkiye emphasizes urbanism.
The results of this study are similar to those in the literature, but certain differences also emerge. Limberg et al. (2024) found that establishing a dedicated climate ministry significantly reduces carbon emissions worldwide but that such ministries had no influence on implementing new climate policies. This shows that climate ministries strengthen climate action by increasing the effectiveness of existing policies rather than by introducing new ones. Ibrahim’s (2023) study of government institutions’ critical roles in combating climate change shows that these institutions could reduce health problems by implementing climate change policies, especially in areas such as air, water, and food security. Rahman (2021) evaluated the environmental sustainability performance of the Ministry of Environment, Forest, and Climate Change in Bangladesh, revealing its major problems and shortcomings in achieving its environmental sustainability goals. To overcome these difficulties, Rahman (2021) notes that institutional and legal reforms must be implemented, the capacity of the Ministry must be increased, and social support must be strengthened. Contrary to the approach taken by Limberg et al. (2024), the present study viewed climate ministries as a important actors for new policy implementation; In contrast to Ibrahim’s (2023) research, offers a general perspective instead of focusing only health issues; unlike Rahman (2021), which centers on a single ministry, this study focuses OECD countries climate ministries.
Biesbroek et al. (2010) focus on the national adaptation strategies (NAS) adopted by European Union (EU) member states in 2008. The role of NAS was found to vary across countries but constitutes a new measure of political commitment to adaptation at the national policy level. Although the strategies are similar in their topics, methods, and approaches, future policy implementations may encounter institutional challenges such as multilevel governance and policy integration. This study shows that EU member states have taken important steps towards adapting to climate change, but additional efforts are needed to further strengthen adaptation processes. Our study focuses on these interactions. Present study differs from Biesbroek et al. (2010) as focusing OECD countries climate ministries to deepen the addition efforts.
Aamodt (2018) analyzes the climate-policy roles of the Indian and Brazilian environmental ministries, arguing that environmental ministries should be important drivers of local climate policy. Historical views of environmental policy as a local or international problem, the ministry’s official role in international climate negotiations, and the development of institutional climate logic were found to affect environmental ministries’ climate policy objectives. This demonstrates the merits of common action-oriented approaches of organizations, such as the EU. Our study focuses on interactions among OECD countries as actors that are important in the climate problem phase rather than the interactions between specific actors as Aamodt (2018) did.
Di, Chen, Shi, Cai, and Zhang (2024), using ANNs and a System Generalized Method of Moments (SYS-GMM), found a win-win situation between digital empowerment and low-carbon initiatives. They present evidence that digital empowerment contributes to carbon emission reductions and that digital technology has a positive impact on promoting environmental sustainability. As in our study, Di, Chen, Shi, Cai, and Zhang (2024) in this context, they establish a link between digitalization and environmental, climate, and sustainability efforts, offering insights into how digital empowerment is central to sustainable development.
Considering this framework established by the existing literature, this study has three major findings. First, the climate crisis requires collective action, but the interaction among OECD countries is currently insufficient. Second, climate and environmental ministries can play central roles in collaboration and strategy. Third, OECD countries should be aware that they have a great responsibility to combat the climate crisis.
In summary, the level of interaction within the Twitter network was limited. As stated previously, collective effort is required to resolve the climate crisis. OECD countries have developed economies, creating the responsibility to collectively act against climate crises. These collective actions should stem from co-operation between their climate and environment ministries. In other words, countries should be aware of each other climate change efforts, and they should carry out these efforts together. Therefore, the level of interaction between countries should increase.
Institutional solidarity, mutual visibility, and digital coordination are necessary for solving environmental problems, particularly the climate crisis. Weak interactions may fail to establish collective voices against the climate crisis in the digital arena. Voluntary collaborations should be developed to combat climate crises, in the same way that the OECD countries establish economic co-operation. Node connections should be strengthened as a policy recommendation. Adding alternative routes, creating shortcuts to shorten path lengths, expanding the communication network, and finding and strengthening key connectors, are relevant suggestions; however, strengthening internal connections is crucial to strengthen the interactions among network users with similar interests. Therefore, policies should enhance existing ties by increasing the strength, frequency, and relevance of interactions. This may require new mechanisms to increase interactions among climate and environmental ministries in OECD countries. An OECD digital environmental diplomacy strategy could be developed to encourage interactions among environmental ministries on social media. Environmental ministries can consider joint campaigns with shared hashtags. Increasing visibility through coordinated collective communication efforts on social media is recommended, including on special occasions such as World Environment Day and World Days to Combat Climate Change. Good practices can be shared among actors through explicit tagging (mentioning). Social media posts should not be limited to information sharing but should facilitate cross-platform discussions within a multifaceted digital dialogue environment through hashtags and other approaches. By increasing interactions, ministries can be informed of each other’s actions, engage in collective efforts, and establish common ground for action. Increased interactions among even a few OECD countries can exert peer pressure on other countries to follow suit. Furthermore, passive actors who feel powerless to combat climate change can gain the courage and motivation to participate in climate action. Similarly, when digital interaction increases public visibility, perceptions of inter-institutional solidarity can also increase.
This research focuses on OECD countries as the largest contributors to the climate crisis; however, this also has limitations. Other countries contribute to the climate crisis, although not to the same extent as OECD countries. Therefore, future research should be conducted with a broader sample encompassing a larger number of countries. It will then be important to assess the role and extent to which all actors contribute to the crisis. A country making a smaller contribution to the climate crisis may be more likely to participate in a solution. This example demonstrates the importance of considering other countries in these processes. Future research should also consider the quality of interactions as well as their level. A high level of interaction does not always correspond with collective action. Therefore, future studies should focus on methods that create collective action. Different methods such as sentiment analysis may have the potential to contribute to the process. Focusing on meaning, alongside positivist methods, may illuminate situations, meanings, and thoughts during emotionally charged crises, facilitating an examination of the line between action and inaction.
Footnotes
Appendix
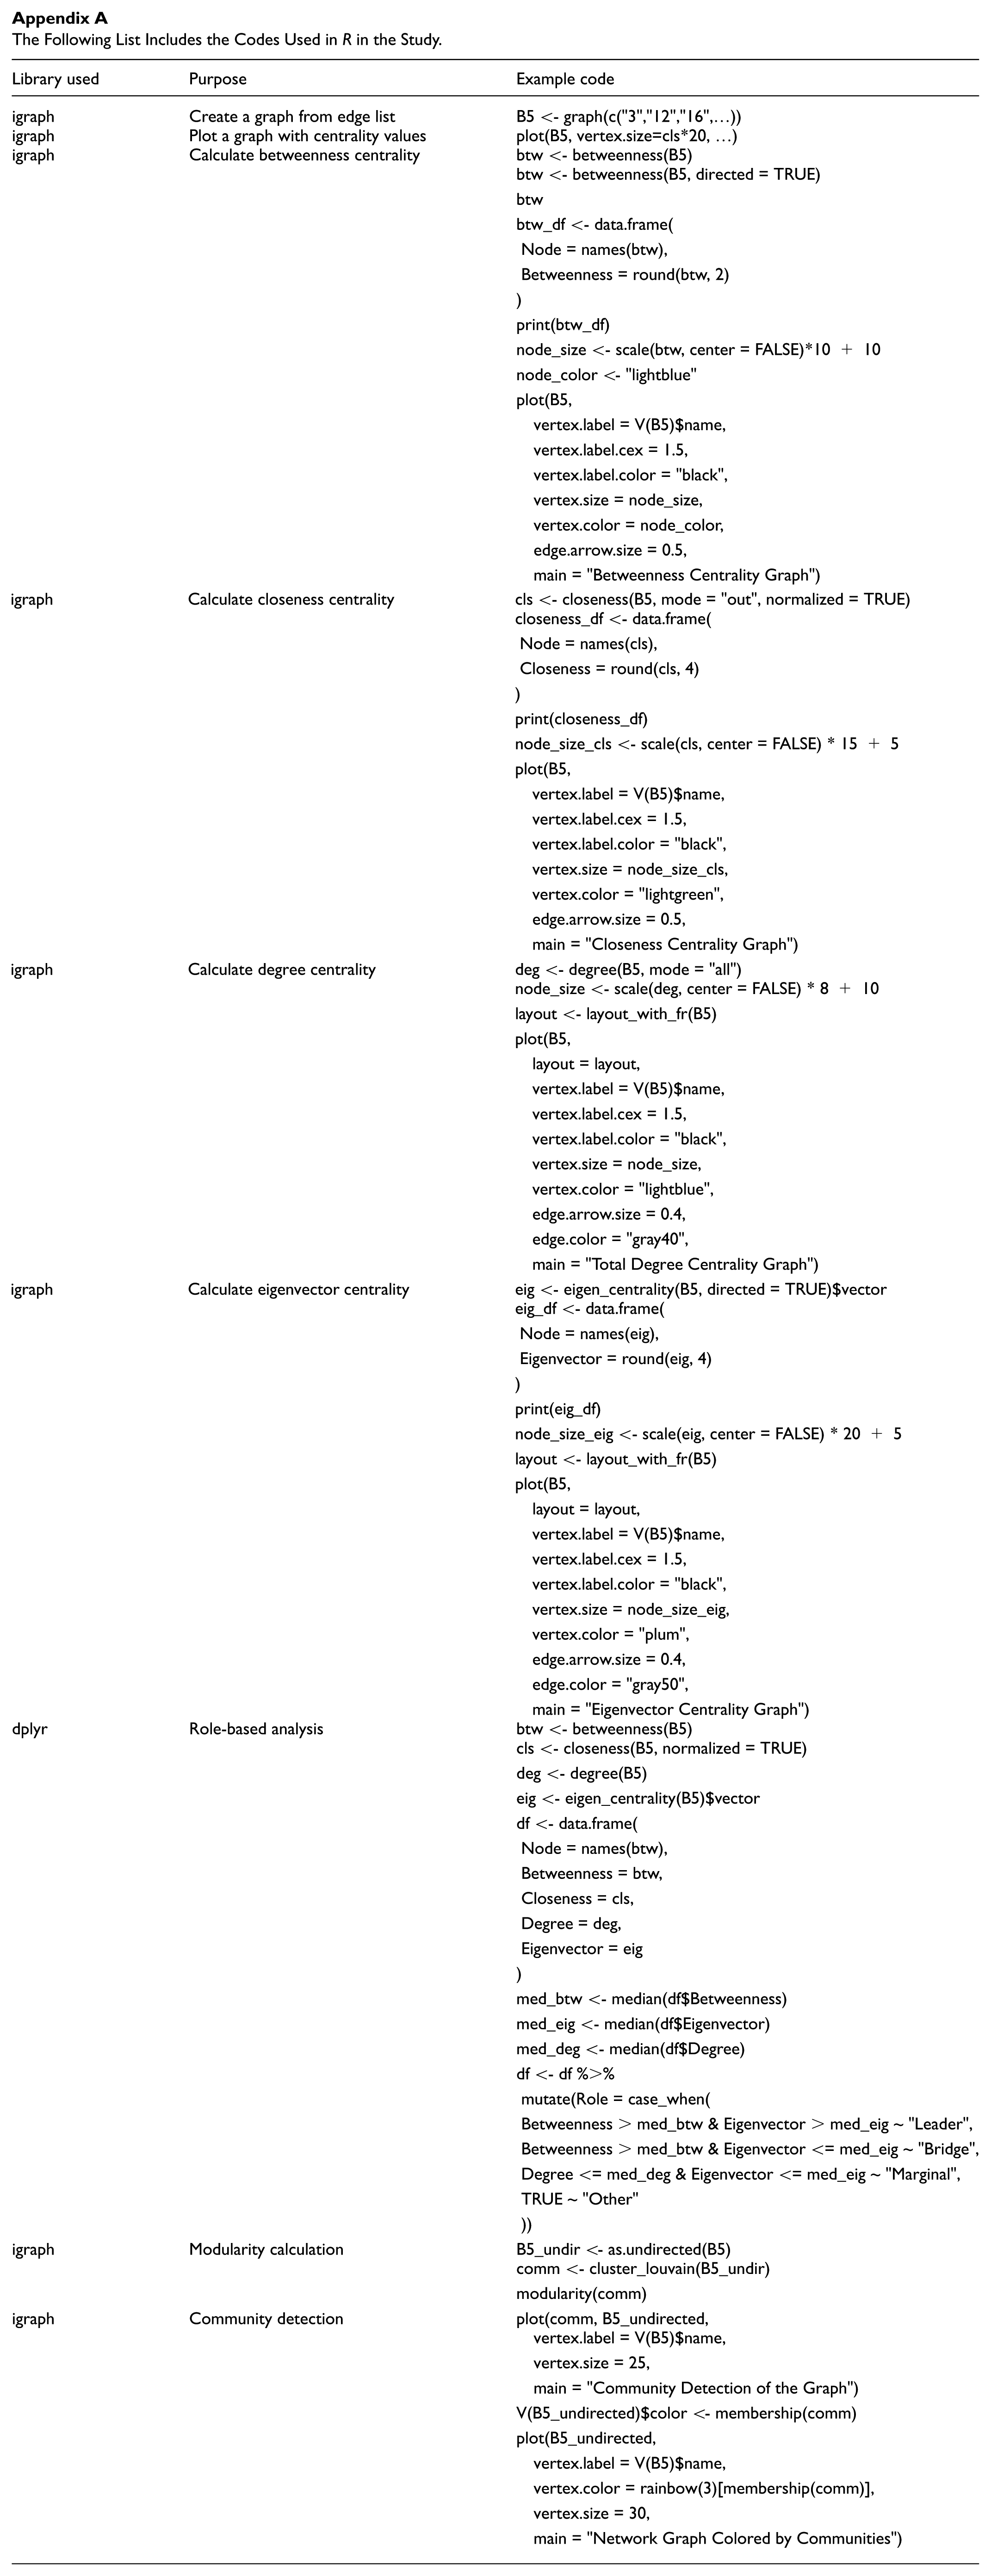
The Following List Includes the Codes Used in R in the Study.
| Library used | Purpose | Example code |
|---|---|---|
| igraph | Create a graph from edge list | B5 <- graph(c("3","12","16",…)) |
| igraph | Plot a graph with centrality values | plot(B5, vertex.size=cls*20, …) |
| igraph | Calculate betweenness centrality | btw <- betweenness(B5) btw <- betweenness(B5, directed = TRUE) btw btw_df <- data.frame( Node = names(btw), Betweenness = round(btw, 2) ) print(btw_df) node_size <- scale(btw, center = FALSE)*10 + 10 node_color <- "lightblue" plot(B5, vertex.label = V(B5)$name, vertex.label.cex = 1.5, vertex.label.color = "black", vertex.size = node_size, vertex.color = node_color, edge.arrow.size = 0.5, main = "Betweenness Centrality Graph") |
| igraph | Calculate closeness centrality | cls <- closeness(B5, mode = "out", normalized = TRUE) closeness_df <- data.frame( Node = names(cls), Closeness = round(cls, 4) ) print(closeness_df) node_size_cls <- scale(cls, center = FALSE) * 15 + 5 plot(B5, vertex.label = V(B5)$name, vertex.label.cex = 1.5, vertex.label.color = "black", vertex.size = node_size_cls, vertex.color = "lightgreen", edge.arrow.size = 0.5, main = "Closeness Centrality Graph") |
| igraph | Calculate degree centrality | deg <- degree(B5, mode = "all") node_size <- scale(deg, center = FALSE) * 8 + 10 layout <- layout_with_fr(B5) plot(B5, layout = layout, vertex.label = V(B5)$name, vertex.label.cex = 1.5, vertex.label.color = "black", vertex.size = node_size, vertex.color = "lightblue", edge.arrow.size = 0.4, edge.color = "gray40", main = "Total Degree Centrality Graph") |
| igraph | Calculate eigenvector centrality | eig <- eigen_centrality(B5, directed = TRUE)$vector eig_df <- data.frame( Node = names(eig), Eigenvector = round(eig, 4) ) print(eig_df) node_size_eig <- scale(eig, center = FALSE) * 20 + 5 layout <- layout_with_fr(B5) plot(B5, layout = layout, vertex.label = V(B5)$name, vertex.label.cex = 1.5, vertex.label.color = "black", vertex.size = node_size_eig, vertex.color = "plum", edge.arrow.size = 0.4, edge.color = "gray50", main = "Eigenvector Centrality Graph") |
| dplyr | Role-based analysis | btw <- betweenness(B5) cls <- closeness(B5, normalized = TRUE) deg <- degree(B5) eig <- eigen_centrality(B5)$vector df <- data.frame( Node = names(btw), Betweenness = btw, Closeness = cls, Degree = deg, Eigenvector = eig ) med_btw <- median(df$Betweenness) med_eig <- median(df$Eigenvector) med_deg <- median(df$Degree) df <- df %>% mutate(Role = case_when( Betweenness > med_btw & Eigenvector > med_eig ~ "Leader", Betweenness > med_btw & Eigenvector <= med_eig ~ "Bridge", Degree <= med_deg & Eigenvector <= med_eig ~ "Marginal", TRUE ~ "Other" )) |
| igraph | Modularity calculation | B5_undir <- as.undirected(B5) comm <- cluster_louvain(B5_undir) modularity(comm) |
| igraph | Community detection | plot(comm, B5_undirected, vertex.label = V(B5)$name, vertex.size = 25, main = "Community Detection of the Graph") V(B5_undirected)$color <- membership(comm) plot(B5_undirected, vertex.label = V(B5)$name, vertex.color = rainbow(3)[membership(comm)], vertex.size = 30, main = "Network Graph Colored by Communities") |
Acknowledgements
We would like to thank our family, colleagues, and institutions for their support during the research and writing of the article.
Ethical Considerations
We wish to confirm that ethical approval was not required for the present study because the study did not involve humans, and all research was conducted to the highest possible ethical standards.
Consent to Participate
Written informed consent for publication of their details was not obtained in this study as the study did not involve living human participants.
Author Contributions
Esra Tuncay: Methodology (lead); software (lead); formal analysis (equal); review and editing (equal). Sezgin Savaş: Conceptualization (lead); formal analysis (equal); writing—original draft (lead); writing—review and editing (equal).
Funding
The authors received no financial support for the research, authorship, and/or publication of this article.
Declaration of Conflicting Interests
The authors declared no potential conflicts of interest with respect to the research, authorship, and/or publication of this article.
Data Availability Statement
The datasets generated during and/or analyzed during the current study are available from the corresponding author on reasonable request.