
Abstract
This study aims to develop a thorough understanding and assessment of the mobile learning readiness (MLR) construct in higher education settings. This study conceptualizes MLR as an eight-dimensional construct encompassing self-directed learning ability, self-efficacy in using mobile learning, mobile learning effort expectation, mobile learning system expectation: mobility, interaction, mobile learning effectiveness expectation, knowledge acquisition expectation, and mobile learning facilitating conditions. Through a rigorous scale development methodological validation—including exploratory and confirmatory factor analyses, structural equation modeling, and measurement invariance testing up to scalar level—a 28-item mobile learning readiness scale (MLRS) using data from 2,368 Chinese college students is established. This research not only advances the theoretical underpinnings of MLR but also provides a pragmatic tool for educational stakeholders to assess and enhance mobile learning readiness.
Plain language summary
Many students aren’t fully prepared for mobile learning, leading to low engagement in using mobile devices for education. This study aimed to better understand and measure this readiness by creating a detailed framework with eight key areas. The researcher developed a 28-item questionnaire called the Mobile Learning Readiness Scale (MLRS) and tested it on 2,368 Chinese college students. The study used advanced statistical methods to ensure the scale was reliable and valid. This research not only strengthens the theory behind mobile learning readiness but also provides a practical tool for educators and administrators. By using the MLRS, schools can identify areas where students need support and develop strategies to improve their readiness for mobile learning and students can help themselves better prepare to use smartphones, tablets, and other mobile devices effectively in their studies.
Introduction
In today’s digitally driven academic landscape, higher education institutions (HEIs) increasingly expect students to possess a high level of digital competence and engage actively with mobile technologies for learning, which makes college students a critical demographic for implementing mobile learning (ML) initiatives (Goundar & Kumar, 2022). However, despite the growing integration of ML in academic settings, many HEIs continue to face significant challenges due to students’ limited mobile learning readiness (MLR). This lack of readiness often results in low participation rates and shallow adoption of mobile learning programs (Ajayi et al., 2019; Kampa, 2023; Reddy et al., 2023). Students with low MLR often underestimate ML’s pedagogical value and perceive high effort in its use, ultimately hindering widespread adoption (Alfalah, 2023; Çebi, 2023).
A comprehensive understanding of MLR is therefore essential for facilitating the design of effective, inclusive, and pedagogically sound mobile learning environments in higher education. Broadly, MLR refers to a student’s propensity to integrate mobile technologies into existing learning ecosystems for formal and informal learning purposes, coupled with the institutional and technical infrastructure necessary to support such integration (Al-Araibi et al., 2019; Christensen & Knezek, 2017; Tang et al., 2021). As a multidimensional construct, MLR encompasses both individual learner attributes and institutional-level supports.
Prior studies have identified key indicators of MLR, which can be categorized into three domains: students’ metacognition, students’ technological anticipatory expectations, and institutional facilitations (Xu & Li, 2024). For example, self-efficacy and self-directed learning reflect the learner’s metacognitive preparedness (Lai et al., 2022; Lin et al., 2016), while perceived usefulness and ease of use signal students’ expectations regarding mobile learning (Azam et al., 2020; Issaramanoros et al., 2018; Sungur-Gul & Ates, 2021). HEIs’ facilitating conditions, such as IT support, campus-wide network, serve as institution-level factors (Christensen & Knezek, 2017; Issaramanoros et al., 2018).
While these identified indicators contributed to the understanding of MLR, they have been predominantly examined from a disintegrative perspective, which is short of comprehensively understanding and evaluating students’ MLR in higher education settings. For instance, the 30-item MLR scale developed by Sungur-Gul and Ates (2021) focuses mainly on tertiary educational students’ psychological constructs (self-efficacy and technology anticipatory), leaving out institutional-level readiness factors.
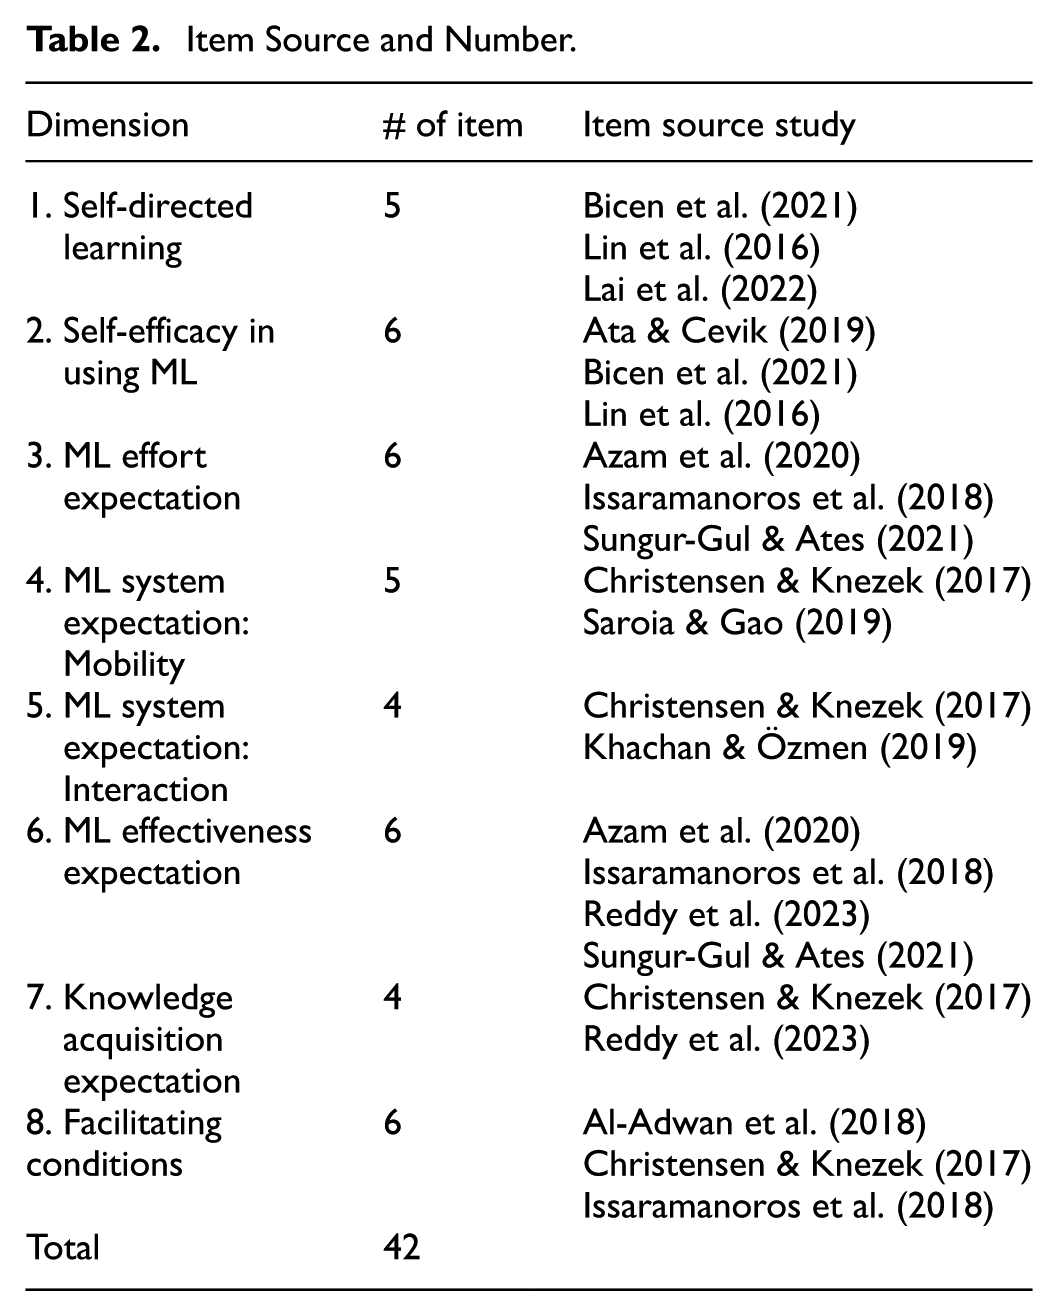
To address this gap, this study aims to develop an integrated MLR construct by providing a comprehensive MLR scale. This study conceptualizes MLR as an eight-dimensional construct: (1) self-directed learning ability, (2) self-efficacy in using ML, (3) ML effort expectation, (4) ML system expectation: mobility, (5) ML system expectation: interaction, (6) ML effectiveness expectation, (7) knowledge acquisition expectation, and (8) ML facilitating conditions. Meanwhile, employing a rigorous scale development method, this study further validated the eight-dimensional structure and developed a robust 28-item mobile learning readiness scale (MLRS) on a sample of 2,368 college students in China.
The study contributes to the ML research and practice community. First, this study endeavors to develop the construct from a comprehensive lens. Second, the eight-dimensional structure provides a theoretical framework for future studies. For instance, future studies can examine the relationship between the individual dimension identified in this study and other outcomes (e.g., ML adoption). Third, the MLRS offers a practical tool for higher educational stakeholders to diagnose readiness levels at individual, group, or institutional levels. These insights can inform targeted interventions and support systems, thereby facilitating personalized, adaptive, and inclusive mobile learning experiences that are responsive to students’ diverse readiness profiles.
Two research questions guided this study.
Literature Review
Mobile Learning Readiness and Indicative Dimensions
Mobile learning readiness (MLR) is a multidimensional construct that can reflect both individual and institutional preparedness to adopt mobile technologies for formal and informal learning (Al-araibi et al., 2019; Christensen & Knezek, 2017; Lin et al., 2016).
Firstly, acknowledging MLR reflected in learners’ propensity to use mobile technology for both formal and informal education, MLR can be elucidated through self-efficacy in using mobile technologies and self-directed learning abilities—factors that reflect confidence and autonomy in managing learning via mobile devices (Lai et al., 2022; Lin et al., 2016; Tang et al., 2021; Zhou et al., 2022). They showcase a student’s confidence in using mobile technologies and their ability to independently manage learning process to cater structured and informal educational pursuits in the mobile learning paradigm where mobile learning is defined as learners’ exploitation of mobile technologies (e.g., mobile devices) for formal and informal educational activities (Lin et al., 2016; Tang et al., 2021). For example, students who use digital tools such as laptops and mobile apps (e.g., OneNote, Xmind) to enhance learning beyond the classroom demonstrate individual readiness.
Moreover, MLR can be interpreted as a student’s predisposition to integrate mobile technologies into extant learning ecosystems (Christensen & Knezek, 2017). This assumption underscores the importance of mobile technologies’ affordances and efficacy (e.g., mobility of mobile devices, efficacy of applications designed for mobile learning such as Duolingo), which play a crucial role in determining students’ willingness to utilize or integrate these technologies into their learning ecosystem (Alfalah, 2023; Christensen & Knezek, 2017; Yang & Xiang, 2024). High perceptions of these attributes are indicative of a willingness to integrate mobile technologies into daily learning routines.
Lastly, the conceptualization of MLR transcends individual factors to encompass the preparedness of institutions (Al-araibi et al., 2019), reflected in the availability of infrastructure and support, such as campus-wide Wi-Fi and technical assistance (Chaka & Govender, 2017; Issaramanoros et al., 2018; Lai et al., 2022). Students’ MLR is demonstrated by their recognition of the favorable facilitating conditions in their HEIs (Al-Adwan et al., 2018).
In summary, MLR is a comprehensive construct encompassing both individual and institutional facets. To enable empirical investigation of MLR, prior studies have identified specific dimensions.
Students’ Self-Directed Learning Ability and Self-Efficacy in Using Mobile Learning
The prominence of the two dimensions (students’ self-directed learning ability and self-efficacy in using ML) is grounded in both cognitive demands placed on college students and the features of mobile learning environments.
MLR, as a psycho-cognitive trait, reflects an individual’s self-appraisal of their capacity to leverage mobile technologies for learning (Lin et al., 2016). Self-efficacy in this context denotes learners’ confidence in their ability to effectively use mobile technologies for learning (Zhou et al., 2022). Students with a robust self-efficacy in ML technologies utilization are more inclined to perceive ML adoption as less effortful and are motivated to enhance their learning effectiveness through ML strategies (Buabeng-Andoh, 2021). This expectation is increasingly reflected in higher education institutions, where students are assumed to possess strong digital competencies (Goundar & Kumar, 2022). A meta-analysis by Liu et al. (2024) on 63 studies on mobile learning acceptance and readiness further confirms the centrality of self-efficacy as a key predictor of successful engagement with mobile learning platforms. Similarly, a literature review by Xu and Li (2024) also reinforces the importance of self-efficacy as the most frequently identified factor to indicate MLR in the prior studies between 2007 and 2021.
Self-directed learning denotes the students’ capacity to take initiative, manage, and evaluate their own learning processes in mobile learning environments (Lin et al., 2016; Tang et al., 2021). For one, mobile learning can occur beyond the formal class in higher education settings and thus requires students to be self-motivated and accountable for their learning behaviors (Çebi, 2023; Tang et al., 2021). For another, self-directed students would like to adopt ML as their learning strategies (e.g., resourcing, time management) because ML, such as ML applications designed for mind mapping, can also enhance their learning skills such as time management, resource access, and self-monitoring (Diteeyont & Heng-Yu, 2023). These qualities are especially vital at the college level, where academic success increasingly depends on students’ ability to adapt, self-regulate, and exploit learning technologies independently (Scheel et al., 2022).
ML Effectiveness, Effort, and Relative Affordances Expectations
MLR can be illuminated from students’ anticipations of ML technologies, including the expectancies of the ease of using mobile technologies, efficacy of mobile technologies, and relative advantage of mobile technologies. Specifically, perceived ease of use (or effort expectation), perceived usefulness (or performance expectation) (Azam et al., 2020; Issaramanoros et al., 2018; Sungur-Gul & Ates, 2021), and system expectations (mobility and interaction) (Christensen & Knezek, 2017; Khachan & Özmen, 2019; Saroia & Gao, 2019) were identified as indicators of MLR.
Perceived ease of use (or effort expectation) refers to the belief that mobile learning requires minimal effort, while perceived usefulness (or performance expectation) reflects the expectation that mobile learning will enhance academic performance (Azam et al., 2020; Sungur-Gul & Ates, 2021). Empirical evidence suggests that students with higher expectations in these areas tend to exhibit greater MLR (Sungur-Gul & Ates, 2021). The ML efficacy anticipation is salient in higher education settings since college students, as digital natives, highly appreciate the flexibility and accessibility that ML offers and ML’s potential to personalize learning experiences by aligning with their expectations for adaptive and inclusive education (Yuan et al., 2025). While the salience of effort expectation in contemporary studies has been subject to debate, with scholarship arguing that it plays a diminished role due to the high technological fluency of current-generation college students (Hoi, 2020) and some maintaining its continued significance (Azam et al., 2020; Liu et al., 2024; Sungur-Gul & Ates, 2021).
The various mobile devices (e.g., laptops, iPads, and smartphones) and mobile applications (e.g., language learning apps such as Duolingo) that mobile learning is based on provide some pivotal relative affordances: enhanced mobility and augmented interactive engagement (Khachan & Özmen, 2019; Saroia & Gao, 2019). Past studies found that college students anticipate mobility as a critical inherent feature of mobile technologies, conferring convenience for self-paced learning (Lai et al., 2022; Saroia & Gao, 2019). They also expect ML to provide them with enhanced interactive capabilities to facilitate collaborations and communications among peers and instructors, previously demanded in traditional learning modalities (Khachan & Özmen, 2019).
HEIs’ Facilitation Conditions
The conceptualization of MLR can be extended beyond individual attributes to encompass the technical preparedness of institutions to adopt ML (Al-araibi et al., 2019). This interpretation underscores the significance of facilitating conditions as a crucial indicator of MLR: the constellation of resources, tools, and infrastructure requisite for supporting ML implementation in HEIs. These may include technical support mechanisms and resources provided by HEIs (Al-Adwan et al., 2018; Issaramanoros et al., 2018; Nikolopoulou et al., 2021). These resources shape the ML ecosystem experienced by students and help mitigate challenges that may hinder ML engagement, thereby manifesting their MLR (Al-Adwan et al., 2018; Issaramanoros et al., 2018). In an endeavor to embrace ML, a burgeoning number of HEIs, particularly in developing and underdeveloped nations, have prioritized the establishment of enabling conditions, including reliable internet access, stable power supply, and access to ML-compatible devices (Ajayi et al., 2019; Asghar et al., 2021). For instance, a study of Nigerian tertiary students highlighted inadequate network availability as a significant impediment to effective ML engagement (Ajayi et al., 2019). Hence, the facilitating conditions are assuming greater significance in delineating MLR as ML is progressively adopted and implemented across developing nations.
Existing Scales for Measuring Mobile Learning Readiness
The established MLR scales are limited. Antecedent investigations predominantly employed survey-based approaches to gauge MLR, eschewing the formulation of comprehensive and psychometrically sound scales. For instance, the seminal works of Hussin et al. (2012) and Mahat et al. (2012) proffered item sets to quantify MLR but lacked thorough reliability and validity testing. The items posited by Hussin et al. (2012) were subsequently validated by Asghar et al. (2021), yielding a three-dimensional structure: skill readiness (proficiency in using mobile technologies), psychological readiness (positive attitudes to adopting ML), and budget readiness (financial willingness to allocate extra funds for ML engagement). This scale focused on assessing MLR from students’ intrinsic readiness.
A more refined approach was introduced by Lin et al. (2016), who developed a 19-item scale grounded in the theory of technology readiness. It conceptualizes MLR through three dimensions—self-directed learning, self-efficacy, and optimism—framing the construct as a metacognitive trait involving both personality and ML-specific beliefs. Building on the Theory of Planned Behavior, Sungur-Gul and Ates (2021) conceptualized MLR as a tertiary-order multidimensional construct, manifested through three secondary-order dimensions—namely, attitude, subjective norm, and perceived behavioral control—which are further delineated into six first-order dimensions: perceived ease of use, perceived usefulness, instructor readiness, student readiness, perceived self-efficacy, and learning autonomy. This hierarchical conceptualization represents an adaptation of the seminal work by Cheon et al. (2012), reinforcing that MLR can be reliably and validly measured through users’ expectations of technology. However, these measurement scales overlook the role of institutional support in facilitating MLR.
Christensen and Knezek (2017) significantly advanced the field by developing a 28-item MLR survey that identifies four distinct dimensions: possibilities (perceived opportunities mobile learning offers for teaching and learning, such as flexibility, personalization, and innovation), benefits (belief in the advantages of mobile learning), preferences (individual attitudes toward mobile learning), and external influences (awareness of institutional factors shaping mobile learning readiness). Although the scale was validated among teachers, it emphasizes not only pedagogical possibilities and benefits of MLR but also the broader institutional context of MLR.
While these instruments contribute valuable perspectives, they fall short of capturing MLR’s full complexity. A comprehensive and psychometrically sound scale is needed—one that integrates individual learner traits with institutional and environmental factors to provide a holistic assessment of mobile learning readiness.
Research Model
This study conceptualizes MLR as a framework of eight first-order dimensions: self-directed learning ability, self-efficacy in ML use, ML effort expectation, ML system expectation (mobility and interaction), ML effectiveness expectation, knowledge acquisition expectation, and facilitating conditions (delineated in Figure 1). Table 1 provides the definition for each dimension.
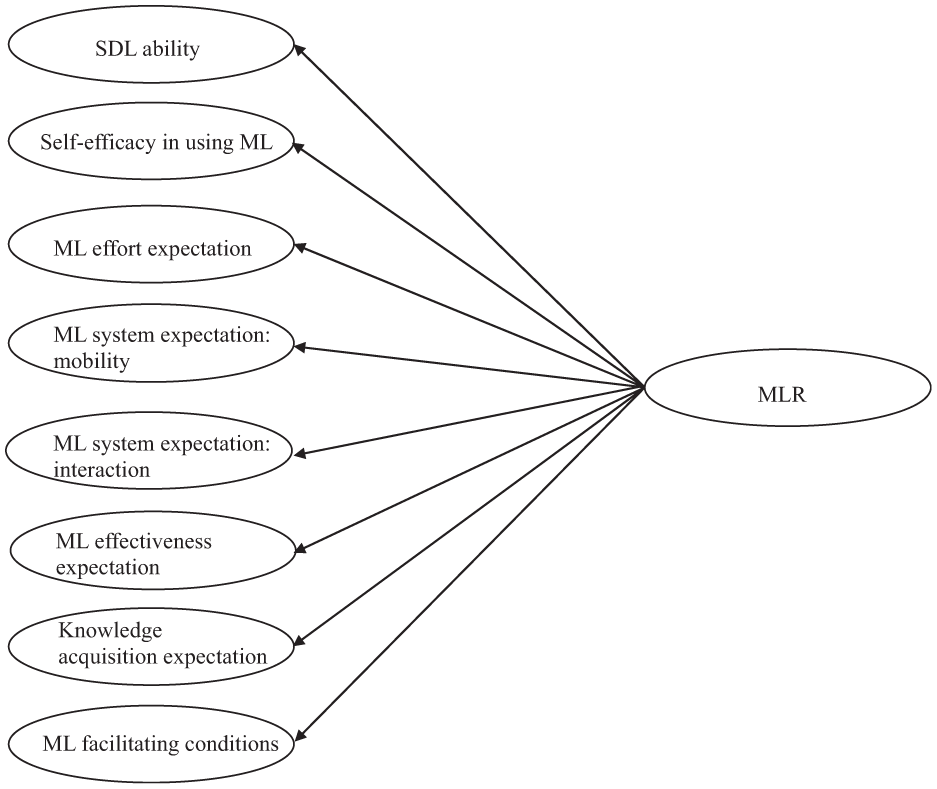
The hypothesized eight-dimensional model.
The Definitions of Eight Dimensions.

The study includes ML effort expectation, despite controversy, hypothesizing that ease-of-use anticipation may vary across student attributes (e.g., age, academic disciplines) and change over time (Hoi, 2020). While some antecedent studies have amalgamated mobility and interaction into a unitary dimension of ML performance expectation (Azam et al., 2020; Sungur-Gul & Ates 2021), this study posits that these dimensions warrant discrete treatment. These two dimensions encapsulate students’ different expectations for ML systems, and the metrics employed to evaluate the two dimensions are different. The conflation of these dimensions into ML performance expectation fails to accurately capture students’ outlook towards ML. The study splits ML performance expectation into ML effectiveness and knowledge acquisition expectation. This distinction is grounded in previous research suggesting that the efficacy of mobile learning encompasses improving academic learning effectiveness and supporting learners’ knowledge acquisition (Yang & Xiang, 2024). ML effectiveness focuses on improving test scores and cognitive abilities (Azam et al., 2020; Reddy et al., 2023), while knowledge acquisition emphasizes expanding learning beyond traditional boundaries (Christensen & Knezek, 2017; Yang & Xiang, 2024).
Method
This study aimed to conceptualize and operationalize the MLR construct within a multifaceted framework and develop an MLR Scale for empirical assessment. Following DeVellis’s (2016) paradigm, the research methodology involved a rigorous instrument development process comprising two phases: (1) initial scale construction and (2) scale validation.
Phase One: Constructing the Initial Scale
Initially, 42 items across eight dimensions were adapted from literature, with Table 2 detailing their sources and distribution. Four bilingual experts (two in educational technologies, two ML-experienced postgraduate students) from Midwestern U.S. institutions evaluated them to remove redundancies and ensure accurate MLR representation, improving scale parsimony and content validity. The criteria and manipulation for the qualitative evaluation is presented in Table 3. Additionally, an additional item (“I am ready to engage in mobile learning”) was included as a criterion variable based on previous studies (Issaramanoros et al., 2018; Lin et al., 2016).
Item Source and Number.
The Criteria of Evaluating Items and Following Manipulation in Qualitative Evaluation.

Participants and Ethical Approval and Informed Consent
Factor analysis requires a sample size exceeding standard minimums, with MacCallum et al. (2001) recommending a 20:1 subject-to-variable ratio, necessitating 840 participants (20*42). Comrey and Lee (2013) suggest at least 1,000 for exemplary analysis. Anticipating 30% attrition based on prior research, 2,500 surveys were distributed online across ten tertiary institutions in seven China regions via local networks. A screening question confirmed ML experience: “Have you used mobile devices (e.g., smartphones, laptops, iPads) for learning?” The final sample was 2,368 qualified responses (94.72% response rate). Little’s MCAR test showed no significant differences between complete and incomplete responses. Sample demographics appear in Table 4. This study was approved by the Institutional Review Board (IRB) at the Office for the Protection of Research Subjects (OPRS) and deemed Exempt under Category 2(i) per federal regulations (45 CFR 46.104). Informed consent was obtained electronically. Participants confirmed they were 18 or older via an age verification prompt before beginning the survey. They were informed of the study’s purpose, voluntary nature, confidentiality, and their right to withdraw at any time. Responses were anonymized and analyzed in aggregate, with raw data accessible only to the researcher. Participants indicated their consent by clicking “Start this survey.”
Sample Demographic Descriptive Statistics.

Phase Two: Validating the Scale
Six statistical techniques commonly utilized in scale development (Watkins, 2018) were employed to validate the scale: Bartlett’s test of sphericity, Kaiser-Meyer-Olkin (KMO) test, exploratory factor analysis (EFA), confirmatory factor analysis (CFA), sequential equation modeling (SEM), and multigroup confirmatory factor analysis (MGCFA). These assessed item adequacy, model-data fit, reliability, validity, and measurement invariance across subgroups. Due to non-normal data, MLR estimation was used. Analyses were conducted in R software.
Item Adequacy and Appropriateness
Bartlett’s test and KMO test ensure data adequacy for EFA (Watkins, 2018). While Bartlett’s test is anticipated to yield a statistically significant chi-square value in larger sample size the KMO result should be concurrently scrutinized with a value exceeding 0.90 generally considered optimal (Watkins, 2018). The dataset was split into two equal subsets. EFA on the first subset assessed item appropriateness using criteria for exclusion: (1) factor loadings below 0.33, (2) high inter-item correlations indicating redundancy, (3) low reliability coefficients, and (4) significant cross-loadings (Tabachnick & Fidell, 2019).
Testing Model-Data Fit
To address research questions, first- and second-order models were validated to confirm MLR measurement via multidimensional optimization. Two models were evaluated by the model-data fit indices: Chi-square (χ2), Standardized Root Mean Square Residual (SRMR), Root Mean Square Error of Approximation (RMSEA), the Comparative Fit Index (CFI), the Tucker-Lewis Index (TLI), Akaike’s Information Criterion (AIC), and Bayesian Information Criteria (BIC). Acceptance criteria were: RMSEA <0.06, SRMR <0.08, CFI and TLI ≥0.95, and smaller AIC and BIC values (Hu & Bentler, 1999). AVE >0.5 was used to evaluate item descriptive power (Hair et al., 2017). The process was conducted on the second half and the entire data.
Evaluating Reliability and Validity
This study used Composite Reliability (CR) for internal consistency, less biased than Cronbach’s alpha, with CR >.8 acceptable (Hair et al., 2017). A comprehensive validation strategy was adopted, encompassing content, convergent, discriminant, predictive, and construct validity. Content validity was evaluated qualitatively, following item selection criteria and construct definition (DeVellis, 2016). Convergent and discriminant validity were assessed using CFA, a rigorous and widely endorsed alternative to the multitrait-multimethod matrix (MTMM) (Brown, 2015). MTMM was not feasible in this study due to the integration of items from multiple established scales, limiting access to distinct measurement sources. Convergent validity was supported by standardized factor loadings >0.70, CR >.70 (Hair et al., 2017), and AVE >0.50 (Fornell & Larcker, 1981). Discriminant validity was assessed using both the Fornell-Larcker criterion, which requires that the square root of each construct’s AVE exceeds its correlations with other constructs (Fornell & Larcker, 1981), and the Heterotrait-Monotrait (HTMT) ratio, with HTMT <0.90 (liberal) for empirical research practices (Henseler et al., 2015). Cross-loadings below 0.40 further supported discriminant validity (Hair et al., 2017). Predictive validity, assessed via SEM, was confirmed by a significant MLR-criterion relationship (Benson & Hagtvet, 1996). Construct validity was established via CFA and SEM, confirming both factor structure and criterion-related associations.
Assessing Measurement Invariance Across Gender and Students’ Academic Year
The optimized measurement model was tested for measurement invariance using MGCFA to ensure item equivalence across subgroups (Wu et al., 2007). Following standard procedures, the analysis progressed through configural, metric, and scalar invariance tests (Bowen & Masa, 2015). Subgroups were stratified by gender (female: n = 1,897; male: n = 471) and academic level (freshman/sophomore: n = 1,236; junior/senior: n = 1,132) to evaluate the scale’s generalizability. Although testing across multiple subgroups increases complexity, it remains essential for establishing validity across diverse populations (Putnick & Bornstein, 2016). Invariance was assessed using both chi-square difference tests and ΔCFI <0.01 as a more robust criterion for large samples (Cheung & Rensvold, 2002). Results supported configural invariance (similar structure), metric invariance (equivalent factor loadings), and scalar invariance (comparable MLR levels). Invariance issues were interpreted considering group differences (Cheung & Rensvold, 2002). This approach ensures psychometric integrity and insights into MLR trajectories across student populations and also addresses the potential impact of gender imbalance on scale performance.
Cut-Off Values for Students’ Mobile Learning Readiness
To classify mobile learning readiness (MLR) levels, this study used a percentile-based approach, which reflects the actual score distribution within the target population (Streiner et al., 2015). This non-parametric method suits large datasets and avoids assumptions of normality (Cohen et al., 2018). The MLR scale included 28 items rated on a 6-point Likert scale (1 = strongly disagree to 6 = strongly agree), producing total scores from 28 to 168. Following Streiner et al. (2015), quartile ranks were calculated to optimize discrimination across readiness levels while maintaining sufficient group sizes for comparison. The 25th and 75th percentiles were used as empirical thresholds: scores below the 25th percentile indicated low readiness; scores between the 25th and 75th percentiles indicated moderate readiness; and scores above the 75th percentile indicated high readiness.
Results
This study addressed two research questions. First, a comprehensive literature review conceptualized mobile learning readiness (MLR) as an eight-dimensional first-order construct. Second, the construct was empirically validated using data from 2,368 Chinese tertiary students. These efforts culminated in a theoretically grounded and psychometrically validated MLR scale comprising eight dimensions and 28 items.
Phase One: Constructing the Initial Scale Results
The instrument underwent a process of refinement, resulting in the elimination or consolidation of five items, while two were translocated to more apposite dimensions.
Three instances are as follows:
1. The following two items within the self-efficacy in using ML:
I am confident in using the basic functions of Learning Management Systems (LMS)
I am confident in using the advanced functions of Learning Management Systems (LMS)
They were combined into a single item due to their similar manifestation of self-efficacy related to LMS usage and potential for response ambiguity:
I am confident that I can be comfortable in using Learning Management Systems (LMS) (e.g., MOOCs, ChaoXing) for mobile learning.
2. One item (“Mobile learning would enhance my learning performance in group assignments”), initially categorized under perceived ML effectiveness, was removed upon review, as the dimension focused on overall rather than group-specific learning performance.
3. An item initially situated within the effort expectation construct, “I think the accessibility of learning materials is easy for me,” was reassigned to the mobility dimension based on consensus from the qualitative evaluation panel. The panel judged the item to better reflect mobility and revised its wording to “I think it is easy for me to access learning materials (e.g., assignments, learning contents) on mobile devices” to improve clarity.
Through iterative qualitative review, a 35-item survey instrument was developed using a six-point Likert scale ranging from “strongly disagree” to “strongly agree,” offering a nuanced range for respondent evaluation.
Phase Two: Validating Scale Results
Item Adequacy and Appropriateness
Bartlett’s test and KMO measure confirmed data suitability (Table 5). Three items were removed for factor loadings below 0.33, two for high inter-correlations, and two for excessive cross-loadings, resulting in a refined 28-item scale.
Results of Bartlett’s Test of Sphericity and the KMO Test (N = 2,368).

p < .0001.
Results of Model-Data Fit
The goodness-of-fit indices demonstrate that the first-order and second-order dimensional models exhibit satisfactory model-data fit (refer to Table 6), which suggests that the eight-dimensional structure of MLR adequately captures the MLR construct. Concurrently, Table 7 and Figure 2 display significant factor loadings (0.79–0.93), indicating items accurately reflect their dimensions. The entire MLRS is presented in Table A1.
Goodness-of-Fit Indices of CFA on Eight-Dimensional Model (N = 2,368).

χ2 measure is significant (p < .001).
The Measures of CR, AVE, and Each Item’s Factor Loading.

Note. All loadings are significant (p < .001).

The entire eight-dimensional model of MLR.
Reliability and Validity Results
Reliability and validity of the scale are well supported. Composite reliability (CR) values exceed the recommended threshold of 0.80, confirming internal consistency (Table 7). Five types of validity are established. Content validity is ensured through expert evaluations. Convergent validity is demonstrated by factor loadings above 0.70, AVE values exceeding 0.50, and CR values above .70 for all dimensions (Table 7). Discriminant validity is supported as the square root of AVE for each dimension surpasses its inter-construct correlations (Table 8), all HTMT values remain below the 0.90 threshold (refer to Table 9), and all cross-loading values are less than 0.4 (Table A2). Predictive validity is evidenced by a significant relationship between the scale and the MLR criterion (β = .815, p < .001; Figure 2), indicating that higher MLR is associated with greater ML preparedness. Finally, construct validity is affirmed by the scale’s theoretically grounded eight-dimensional structure and its predictive performance.
Measures of AVE and Dimension Inter-Correlations.

Note. Diagonal values are the square roots of AVE; off-diagonal values are inter-construct correlations. All diagonal and inter-correlation values are significant (p < .001).
HTMT Results.

Note. All values are significant (p < .001).
Measurement Invariance Across Gender and Students’ Academic Year Results
The findings reveal that full measurement invariance was not achieved for the overall model, necessitating separate testing of each first-order dimension. Three dimensions—ML system expectation: interaction, facilitating conditions, and self-efficacy—failed to demonstrate scalar invariance across academic year groups, while self-efficacy also lacked scalar invariance across gender. These results indicate that students interpret and respond to these items differently based on subgroup membership, reflecting varying levels of mobile learning readiness (MLR).
Results of Cut-Off Values for Mobile Learning Readiness
Students’ mobile learning readiness was assessed using the quartile method, based on a total possible score of 168, derived from 28 items rated on a 6-point Likert scale. The 25th and 75th percentiles were 111 and 138, respectively (see Figure 3). Accordingly, students were classified into three categories: 645 as low readiness (≤111), 1,132 as moderate readiness (112–138), and 591 as high readiness (>138) (see Table 10). Students, demonstrating low readiness, likely require more support through structured activities, step-by-step guidance, and readily available technical assistance. Those exhibit moderate readiness, benefiting from a balance of structured and independent tasks to improve their MLR. Finally, students, displaying high readiness, may thrive in self-directed mobile learning environments. However, these cutoffs are context-specific to the current study’s sample and should be used as a reference for holistic assessment.

Students’ mobile learning readiness score distribution with quantile cut-offs.
The Five Mobile Learning Readiness Categories Counts.

Discussions
Firstly, the intricate interplay between self-directed learning (SDL) aptitude and MLR has been corroborated by this investigation, echoing the findings of antecedent studies. This aligns with the attributes of ML, which necessitates a high degree of autodidactic prowess and self-regulatory acumen (Diteeyont & Heng-Yu, 2023; Lin et al., 2016; Tang et al., 2021; Yang & Xiang, 2024). The analysis of dimensions also corroborates that 44.6% students are categorized in the low readiness. This suggests that a substantial portion of learners may face difficulty managing the demands of mobile learning in autonomous settings, thereby highlighting the need for more personalized instructional interventions aimed at enhancing students’ SDL capabilities for ML. This study underscores self-efficacy as a dimension of the MLR construct, aligning with existing research that links MLR to learners’ self-assessment of their ability to use mobile technologies for educational purposes (Asghar et al., 2021; Bicen et al., 2021; Lin et al., 2016; Sungur-Gul & Ates, 2021). While Lin et al. (2016) and Sungur-Gul and Ates (2021) focused on learners’ confidence in using ML, this study offers a more nuanced analysis, examining both their competence in operating mobile devices and their perceived confidence in applying ML effectively.
Contradicting the assumption that effort expectation barely manifests MLR (Hoi, 2020), the findings in this study underscore the enduring significance of considering effort expectation, irrespective of the current generation’s familiarity with ML technologies. 44% of students in the sample reported low readiness regarding the ease of using mobile learning, underscoring the significance of effort expectancy in ML adoption. Furthermore, this research unveils two distinctive advantages university students anticipate regarding ML systems: mobility and interaction, diverging from previous studies that conflated them into a singular construct termed “ML performance expectation” (Azam et al., 2020; Sungur-Gul & Ates, 2021). ML performance expectation primarily emphasizes the potential for enhanced learning outcomes through ML adoption, while the two dimensions highlight the learners’ anticipation of the optimal system ML could provide. Notably, this study extends the existing conceptualization of mobility—previously centered on technological and learner mobility (Lai et al., 2022; Saroia & Gao, 2019)—by incorporating the adaptive characteristics of mobile learning (ML) that address learners’ personalized needs. Enhancing mobility through features such as adaptive content, cross-device compatibility, and offline access can better support diverse learner needs and thus improve students’ MLR. The validation of the interaction dimension highlights contemporary students’ expectations for diverse forms of interaction, including prompt feedback, real-time data access, engagement with multiple user groups (e.g., instructors, peers), and seamless collaboration. Therefore, strengthening interaction features addresses students’ expectations for dynamic and social learning on ML platforms, increasing students’ ML engagement and MLR.
Additionally, this study affirms knowledge acquisition and learning effectiveness expectations as distinct indicators of MLR. While existing MLR scales often conflate these into a single dimension of ML effectiveness (Azam et al., 2020; Reddy et al., 2023), such an approach overlooks the nuanced ways students engage with mobile technologies, particularly their tendency to use mobile devices for exploratory, informal learning. Consequently, separating these dimensions clarifies students’ distinct goals for ML efficacy with both spontaneous knowledge exploration (e.g., open content access, microlearning modules) and structured learning outcomes (e.g., progress tracking, assessment tools). Addressing both expectations can enhance system alignment to better meet diverse expectations and improve ML adoption and effectiveness in education.
This study accentuates the multifaceted nature of MLR by validating facilitating conditions. Except for technological support for platform selection and real-time utilization guidance, as noted in extant studies (Al-Adwan et al., 2018; Christensen & Knezek, 2017; Issaramanoros et al., 2018; Nikolopoulou et al., 2021), the current study emphasizes the importance of reliable data services and network coverage. Notably, 47.1% of students fall into the low-readiness category for facilitating conditions, suggesting that many perceive institutional support for mobile learning as inadequate. This finding reinforces prior research emphasizing the need for strong infrastructure in developing contexts (Ajayi et al., 2019; Asghar et al., 2021). In contrast, Xu (2025) found that facilitating conditions were not a validated factor among U.S. learners. Such discrepancies may stem from differences in economic development, digital infrastructure, and institutional investment in educational technology.
The lack of scalar invariance for three key first-order dimensions—interaction, facilitating conditions, and self-efficacy in using mobile learning (ML)—warrants deeper investigation. Differences between lower-year (freshmen and sophomores) and upper-year (juniors and seniors) students likely reflect variations in technological fluency, ML experience, and awareness of institutional support, which may influence how they interpret related survey items.
Senior students are generally more experienced with ML platforms for coursework, multiple communications, and peer-collaborations, and have engaged in courses emphasizing ML for synchronous and asynchronous interaction, shaping their responses to interaction-related items. Digital literacy, particularly in navigating mobile learning apps and collaborative tools, also varies by experience level. Diteeyont and Heng-Yu (2023) found that students with higher mobile digital literacy—typically upper-year students—show greater confidence and readiness for ML, complicating scalar assumptions for the self-efficacy dimension. Gender differences may affect self-efficacy perceptions, with male students tending to report higher confidence in using mobile technologies (Waqas et al., 2024). The imbalanced gender distribution in the sample could further impact measurement invariance in the self-efficacy dimension. Moreover, familiarity with institutional support services—such as mobile-friendly learning management systems (LMS), IT help desks, and peer support networks—tends to increase with academic progression. Consequently, senior students may perceive facilitating conditions more favorably, leading to inconsistent response patterns across groups to the items in the facilitating condition dimension. Further, contextual factors—such as access to reliable Wi-Fi, infrastructure, and mobile devices—likely vary across institutions, influencing perceptions of facilitating conditions and contributing to scalar non-invariance.
Limitations and Future Directions
The generalizability of the mobile learning readiness scale (MLRS) is constrained by its validation within a singular Chinese population cohort. Unique cultural, educational, and contextual factors within this region likely influenced participant responses, potentially impacting the scale’s broader applicability. For instance, mobile learning readiness in China is mediated by social norms that often frame mobile phones as primarily entertainment devices, potentially diminishing perceptions of academic focus. Coupled with a traditional emphasis on teacher authority and knowledge transmission, this context may engender resistance to the self-directed learning often promoted by mobile learning. Consequently, these factors may reflect China-specific students’ MLR, necessitating heightened cultural sensitivity when applying the MLRS cross-culturally. Meanwhile, while measurement invariance testing addressed gender subgroup differences, sample imbalance may limit the findings’ generalizability, particularly regarding gender-based comparisons. The application of the established student MLR cutoff criteria is limited by the current sample profile. To improve the scale’s generalizability, future research should validate the MLRS across more diverse, multinational, gender-balanced samples, and run differential-item-functioning (DIF) analyses to detect and correct any demographic bias.
In addition, one notable limitation of this study is the failure to establish scalar measurement invariance for several dimensions of the MLRS across academic level and gender subgroups. As a result, latent mean comparisons across these groups should be interpreted with caution, as the scale may not function equivalently at the scalar level. Future studies should investigate potential sources of non-invariance, such as variations in digital literacy, access to resources, or curriculum differences, and consider revising items to improve cross-group equivalence.
Moreover, the present study’s focus on establishing the psychometric properties of the MLRS limited the exploration of nomological relationships among its eight first-order dimensions within a broader theoretical framework. Subsequent investigations could delve into the intricate web of interconnections among these dimensions, potentially revealing hierarchical structures or latent higher-order constructs that might further elucidate the nature of MLR.
Lastly, there remains a need to examine the relationship between the comprehensive construct of MLR, as measured by the MLRS, and various consequential outcomes. Future studies could extend beyond adoption to investigate the impact of MLR on other outcomes, such as learning performance, technological self-efficacy, or even broader measures of academic achievement.
Implications
This study contributes to the scholarly discourse by presenting a comprehensive framework of MLR. To the best of the researcher’s knowledge, this research represents one of the first efforts to develop a multidimensional metric for gauging MLR, offering meaningful implications for both students and tertiary educational establishments.
For students, the MLRS functions as a self-assessment tool that helps identify strengths and areas for growth in their readiness for mobile learning. For example, low scores in self-directed learning may prompt students to seek support in time management, goal-setting, or reflective learning strategies. HEIs can respond by offering targeted workshops on metacognitive skill development, integrating ML tools into coursework, and providing hands-on tutorials or peer mentoring programs to boost technological confidence and reduce cognitive effort.
For institutions, the MLRS serves as a powerful diagnostic tool to assess the MLR of incoming or current students, informing curriculum design, instructional strategies, and broader digital transformation efforts in higher education. By systematically evaluating multiple readiness dimensions, HEIs can tailor interventions that promote equitable, engaging, and effective mobile learning environments. Recognizing mobility and interaction as key dimensions of MLR can encourage educators in HEIs to create more asynchronous learning experiences and leverage mobile-compatible tools—discussion boards, real-time collaboration, virtual learning communities, and social media platforms—to promote multiple interactions and peer-collaboration. The inclusion of effort expectancy highlights the need to address usability and digital literacy barriers. Institutions can mitigate these challenges through user-centered platform design, onboarding programs, and accessible technical training. Simplifying access to learning materials and minimizing the cognitive and technical burden of technology use can significantly enhance students’ MLR. The MLRS also measures students’ perceptions of mobile learning effectiveness and knowledge acquisition expectation, which reflect their confidence in ML as a means to achieve academic success. Cognizant of these dimensions, HEIs can reinforce these beliefs by embedding mobile-compatible assessments, offering self-paced, mastery-oriented learning experiences, and incorporating multimedia-rich, personalized content into course design. Finally, identifying facilitating conditions as a key factor in MLR underscores the institutional role in supporting digital infrastructure. This includes investing in campus-wide Wi-Fi, partnering with telecommunications providers to offer subsidized data plans or zero-rated academic access, and addressing equity issues through technology loan programs or financial aid for device purchases. Establishing dedicated IT support centers staffed with instructional designers and technical experts can ensure continuous assistance for both students and faculty, thereby enhancing the sustainability of mobile learning integration.
Footnotes
Appendix A
All Items Cross-Loadings.
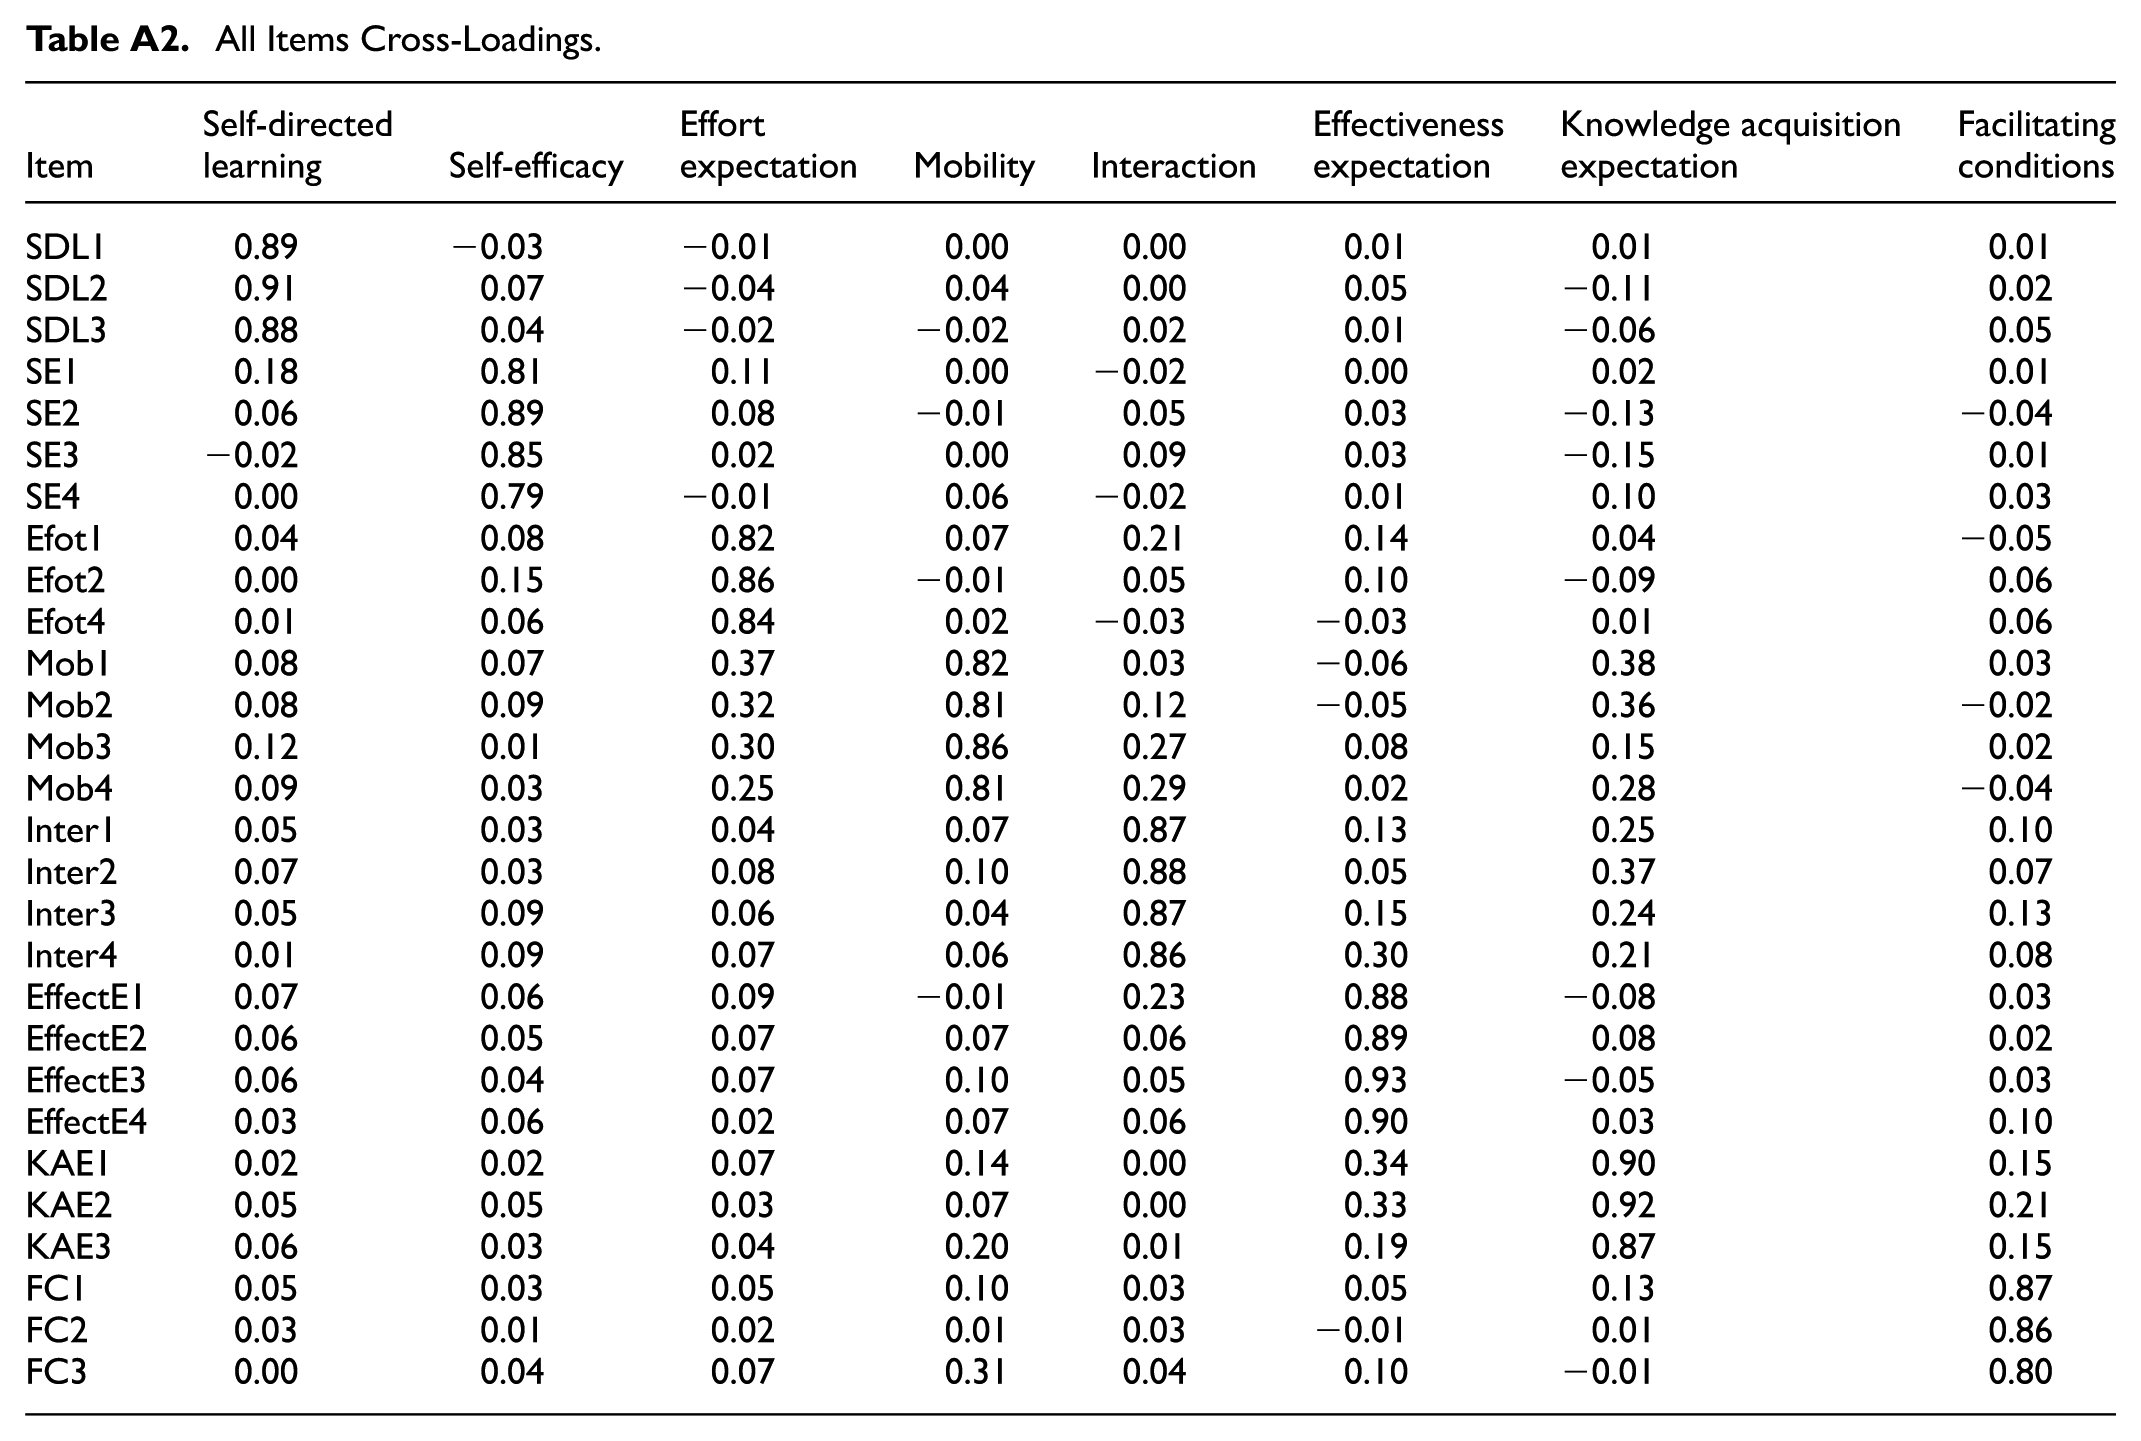
| Item | Self-directed learning | Self-efficacy | Effort expectation | Mobility | Interaction | Effectiveness expectation | Knowledge acquisition expectation | Facilitating conditions |
|---|---|---|---|---|---|---|---|---|
| SDL1 | 0.89 | −0.03 | −0.01 | 0.00 | 0.00 | 0.01 | 0.01 | 0.01 |
| SDL2 | 0.91 | 0.07 | −0.04 | 0.04 | 0.00 | 0.05 | −0.11 | 0.02 |
| SDL3 | 0.88 | 0.04 | −0.02 | −0.02 | 0.02 | 0.01 | −0.06 | 0.05 |
| SE1 | 0.18 | 0.81 | 0.11 | 0.00 | −0.02 | 0.00 | 0.02 | 0.01 |
| SE2 | 0.06 | 0.89 | 0.08 | −0.01 | 0.05 | 0.03 | −0.13 | −0.04 |
| SE3 | −0.02 | 0.85 | 0.02 | 0.00 | 0.09 | 0.03 | −0.15 | 0.01 |
| SE4 | 0.00 | 0.79 | −0.01 | 0.06 | −0.02 | 0.01 | 0.10 | 0.03 |
| Efot1 | 0.04 | 0.08 | 0.82 | 0.07 | 0.21 | 0.14 | 0.04 | −0.05 |
| Efot2 | 0.00 | 0.15 | 0.86 | −0.01 | 0.05 | 0.10 | −0.09 | 0.06 |
| Efot4 | 0.01 | 0.06 | 0.84 | 0.02 | −0.03 | −0.03 | 0.01 | 0.06 |
| Mob1 | 0.08 | 0.07 | 0.37 | 0.82 | 0.03 | −0.06 | 0.38 | 0.03 |
| Mob2 | 0.08 | 0.09 | 0.32 | 0.81 | 0.12 | −0.05 | 0.36 | −0.02 |
| Mob3 | 0.12 | 0.01 | 0.30 | 0.86 | 0.27 | 0.08 | 0.15 | 0.02 |
| Mob4 | 0.09 | 0.03 | 0.25 | 0.81 | 0.29 | 0.02 | 0.28 | −0.04 |
| Inter1 | 0.05 | 0.03 | 0.04 | 0.07 | 0.87 | 0.13 | 0.25 | 0.10 |
| Inter2 | 0.07 | 0.03 | 0.08 | 0.10 | 0.88 | 0.05 | 0.37 | 0.07 |
| Inter3 | 0.05 | 0.09 | 0.06 | 0.04 | 0.87 | 0.15 | 0.24 | 0.13 |
| Inter4 | 0.01 | 0.09 | 0.07 | 0.06 | 0.86 | 0.30 | 0.21 | 0.08 |
| EffectE1 | 0.07 | 0.06 | 0.09 | −0.01 | 0.23 | 0.88 | −0.08 | 0.03 |
| EffectE2 | 0.06 | 0.05 | 0.07 | 0.07 | 0.06 | 0.89 | 0.08 | 0.02 |
| EffectE3 | 0.06 | 0.04 | 0.07 | 0.10 | 0.05 | 0.93 | −0.05 | 0.03 |
| EffectE4 | 0.03 | 0.06 | 0.02 | 0.07 | 0.06 | 0.90 | 0.03 | 0.10 |
| KAE1 | 0.02 | 0.02 | 0.07 | 0.14 | 0.00 | 0.34 | 0.90 | 0.15 |
| KAE2 | 0.05 | 0.05 | 0.03 | 0.07 | 0.00 | 0.33 | 0.92 | 0.21 |
| KAE3 | 0.06 | 0.03 | 0.04 | 0.20 | 0.01 | 0.19 | 0.87 | 0.15 |
| FC1 | 0.05 | 0.03 | 0.05 | 0.10 | 0.03 | 0.05 | 0.13 | 0.87 |
| FC2 | 0.03 | 0.01 | 0.02 | 0.01 | 0.03 | −0.01 | 0.01 | 0.86 |
| FC3 | 0.00 | 0.04 | 0.07 | 0.31 | 0.04 | 0.10 | −0.01 | 0.80 |
Acknowledgements
The author expresses sincere gratitude to Professor Xiwen Li for invaluable assistance with data collection procedures
Ethical Considerations
This research has obtained approval from the IRB at the Office for the Protection of Research Subjects (OPRS) in the University of Illinois at Urbana-Champaign with being categorized in the exempt 2(i), complying with the requirements of University and federal regulations found at 45 CFR 46.104. The approval protocol number is 22591.
Consent to Participate
Consent was obtained from the participants to participate in the current study. The survey used in this study was conducted online and incorporated a mandatory age verification prompt (“You are 18 years old or above”) at the outset. No participants under the age of 18 were included in this study. Participants were clearly informed the research purposes and that their participation in this study was voluntary. They were assured that their responses would be kept confidential and used solely for research purposes. Participants were also informed of their right to withdraw from the study at any time without penalty. To protect participant privacy, responses cannot be individually identified, all data was aggregated for analysis. Only the researcher has the access to the raw survey data. If participants have any concerns or questions, they can contact the researcher and/or IRB by email. By clicking the “start this survey” button on the online survey, participants confirmed that they had read the information provided, understood the terms, and consented to participate in this study.
Funding
The author received no financial support for the research, authorship, and/or publication of this article.
Declaration of Conflicting Interests
The author declared no potential conflicts of interest with respect to the research, authorship, and/or publication of this article.
Data Availability Statement
The dataset generated and analyzed during the current study is available from the corresponding author on reasonable request.