
Abstract
Due to the impact of the COVID-19 pandemic, people have reduced eating out, resulting in a severe drop in the revenue of the catering industry. Health risks have become a major factor affecting the revenue of this industry. Predicting the revenue of the catering industry during the COVID-19 pandemic will not only allow practitioners to adjust their business strategies, but also provide a reference for governments to formulate relief measures. To this end, this study proposes a fuzzy big data analytics approach in which random forests, recursive feature elimination, fuzzy c-means, and deep neural networks are jointly applied. First, random forests and recursive feature elimination are used to select the most influential factors. The data is then divided into clusters by fuzzy c-means. Subsequently, a deep neural network is built for each cluster to make predictions. The prediction results of individual clusters are then aggregated to improve prediction accuracy. The proposed methodology has been applied to forecast the revenue of the catering industry in Taiwan. The results of the experiment showed that the impact of new deaths on the revenue of the catering industry was far greater than the number of newly diagnosed COVID-19 cases.
Introduction
This study aims to predict the revenue of the catering industry during the COVID-19 pandemic. The background of this study is described below.
Since 2019, due to the impact of the COVID-19 pandemic, the number of tourists has decreased (T. T. C. Chen et al., 2022), and many areas have prohibited catering businesses from dining indoor (T. Chen & Chiu, 2022). At the same time, people go out less and their eating behavior changes, which seriously affects the operation of the catering industry (Ministry of Finance, 2022; Norris et al., 2021). In Taiwan, affected by the COVID-19 pandemic, the annual revenue of the catering industry declined for the first time in 2019, as shown in Figure 1. Therefore, this study aims to predict the revenue of the catering industry in Taiwan amid the COVID-19 pandemic.

Annual revenue of the catering industry in Taiwan (Data source: Ministry of Finance, 2022).
The significance of this study is explained below:
This topic was seldom discussed in the past, because the revenue of the catering industry is a time series affected by many factors and full of stochasticity (Li et al., 2020; Mayurnikova et al., 2015; Ugarova et al., 2019; Xie et al., 2008).
There are many factors that may affect the revenue of the catering industry, such as wage levels, labor supply, raw material prices, economic conditions, commodity prices, weather, business tax rates, food safety-related news, etc., as shown in Figure 2. In addition, many factors are constantly fluctuating and can be measured in various ways, leading to a complex big data problem (Nageshwaran et al., 2021).
The revenue of the catering industry has been growing steadily in the past (Ministry of Finance, 2022), which provided enough incentive for practitioners to enter the industry and/or make investment decisions. These practitioners are at a loss as to what to do in the face of the impact of the COVID-19 pandemic.
Furthermore, unlike before, during the COVID-19 pandemic, the revenue of the catering industry is greatly affected by health risks (Lin & Chen, 2022). Therefore, existing methods may not be directly applicable (Wu et al., 2020).

Factors affecting the revenue of the catering industry during the COVID-19 pandemic.
The contributions of this study are:
This study is one of the first attempts to predict the revenue of the catering industry taking into account the health risks posed by the COVID-19 pandemic.
The prediction results can help the government formulate supplementary measures (such as relief subsidy budget) or tax standards (such as business tax, entertainment tax and other taxes) for the catering industry (Liu et al., 2013; Whitfield & Duffy, 2013).
Relevant forecasts can also provide reference for investors’ investment timing, direction, amount and plan (Goodman et al., 2014).
For catering practitioners, the results of this study provide some suggestions for them in making production plan, scheduling plan, business operation plan, and employment plan (Ren & Lv, 2014).
To predict the revenue of the catering industry during the COVID-19 pandemic, this study proposes a fuzzy big data analytics approach in which random forest (RF), recursive feature elimination (RFE), fuzzy c-means (FCM), and deep neural network (DNN) are applied jointly. In the proposed methodology, first, RF and RFE are used to select the most influential factors for predicting the revenue of the catering industry during the COVID-19 pandemic. The data is then divided into clusters by FCM. Both of these measures reduce the dimensionality or amount of data processed at one time. Subsequently, a DNN is built for each cluster to make predictions. By optimizing the network architectures, the effectiveness of these DNNs in predicting the revenue of the catering industry during the COVID-19 pandemic is improved.
The rest of this paper is organized as follows. Section 2 is dedicated to the literature review. Section 3 presents the fuzzy big data analytics approach proposed in this study. Section 4 details the application of the fuzzy big data analytics approach to forecast the revenue of the catering industry in Taiwan during the COVID-19 pandemic. Finally, Section 5 summarizes this study and provides some directions for future research.
Literature Review
Forecasting in the Catering Industry Amid the COVID-19 Pandemic
Some related literature is reviewer below. Several studies have established regression or time series models, such as autoregressive integrated moving average (ARIMA) and panel data models, to predict changes in sales and revenue in the catering industry (Su, 2020; Yang et al., 2020). Yang et al. (2020) developed a two-way fixed-effects panel data model to predict restaurant sales and stay-at-home orders across US counties. Unexpectedly, with the increase in daily confirmed cases, both the sales and stay-at-home orders of restaurants have dropped, especially stay-at-home orders. Oblander and McCarthy (2021) modeled the average order size of a restaurant customer as a homogeneous log-linear function of the customer’s tenure, which is a simple time series model. Panzone et al. (2021) built a multiplicative seasonal auto regressive integrated moving average (SARIMA) model to predict annual restaurant sales in the UK to quantify the impact of the COVID-19 pandemic on the dining industry. Machine learning techniques have also been applied to achieve this goal (De Silva et al., 2021; Hornstein et al., 2021). For example, Xie et al. (2008) constructed a support vector machine (SVM) to predict sales in the catering industry in China. The inputs to the SVM were the sales of past periods. Sun et al. (2021) built a long short-term memory (LSTM) network to predict the sales of a catering business. LSTMs are deep neural networks (DNNs). Like some previous studies, the inputs of the LSTM network were the sales of the previous periods, and the sales of the next periods were predicted accordingly. Tanizaki et al. (2021) compared the performances of several machine learning, including gradient boosting regression (GBR), Bayesian linear regression, boosted decision tree, decision forest, RF, and deep learning methods (including recurrent neural network and LSTM) in predicting the number of customers visiting restaurants during the COVID-19 pandemic. Based on experimental results, the machine (or deep) learning method that achieved the highest accuracy varied from restaurant to restaurant. Furthermore, the prediction accuracy achieved using deep learning methods was not necessarily higher than that achieved with machine learning methods. In sum, existing methods typically predict future sales or revenue based on past data, assuming no sudden changes will occur. On the contrary, the COVID-19 pandemic has had a severe impact on the global economy, and the economic losses in various industries are incalculable. Under such drastic changes, the forecasting accuracy using existing methods may be far from satisfactory. To address this issue, it is necessary to explore the relationship between health risks posed by the COVID-19 pandemic and the revenue of the catering industry.
Fuzzy Methods for Big Data Forecasting
Fuzzy methods have been widely used to consider various uncertainties in big data prediction tasks (Alvisi & Franchini, 2011; T. Chen et al., 2021; M.-C. Chiu et al., 2020). First, fuzzy sets with range and different possibilities can be used to represent the inputs of fuzzy forecasting methods that may be fluctuating, qualitative or subjective (T. Chen & Wang, 2019; Hadjimichael et al., 2002; Khemavuk & Leenatham, 2021). For example, to predict the demand for a product, Khemavuk and Leenatham (2021) considered qualitative/subjective factors such as product quality, customer satisfaction, and competitive effects. The values of these factors were represented by fuzzy sets and fed into an adaptive network-based fuzzy inference system (ANFIS). To make the production plan of a ubiquitous healthcare system of 3D printing facilities for making dentures, M. C. Chiu and Chen (2022) predicted the printing time of dentures and the transportation time to deliver printed dentures using type-II fuzzy sets.
In addition, fuzzy classifiers are applied to fuzzily divide the collected big data into several possibly overlapping clusters (T. Chen & Wang, 2016; Guha & Veeranjaneyulu, 2019; Wu et al., 2020). In other words, each data belongs to all clusters, but to varying degrees. For example, T. Chen and Wang (2016) used an artificial neural network (ANN) to estimate the workload of a simulation task on a cloud-based simulation system. To this end, FCM was applied to divide the simulation tasks into multiple clusters, which are processed on different clouds. Guha and Veeranjaneyulu (2019) predict a firm’s bankruptcy risk by considering its financial performance, in which the firms to be evaluated were classified using FCM.
Furthermore, since the actual value of a predicted target is rarely equal to the predicted value, estimating the target’s range is an alternative. Fuzzy sets are a suitable choice to express this (T. Chen & Chiu, 2021). For example, T. Chen and Chiu (2021) proposed a fuzzy collaborative forecasting method for dynamic random access memory (DRAM) yield forecasting, which was a typical big data problem because of many influencing factors. Triangular fuzzy numbers (TFNs) are used to represent fuzzy yield forecasts. Rubio et al. (2017) used trapezoidal fuzzy numbers (TrFNs) to predict stock indices in several stock markets, which was a typical big data problem. For this purpose, a weighted sum of past values was calculated and a new weighting rule was defined. However, a fuzzy forecast should have a narrow range while still containing the actual value (Wang et al., 2021).
Methodology
Theoretical Background
A fuzzy big data analytics approach consists of five main steps: feature selection, pre-classification, DNN training, aggregation, and prediction performance evaluation:
Feature selection: The first step is to perform feature selection to select features that are more relevant for the prediction purpose. There are many existing methods, including variance threshold (i.e., removing features with low variance), univariate feature selection (i.e., correlation analysis) (Gogtay & Thatte, 2017), the RFE method (Yan & Zhang, 2015), L1-based feature selection (Shekar & Dagnew, 2020), tree-based feature selection (Suresh & Bharathi, 2016), sequential feature selection (Aggrawal & Pal, 2020), etc. Among them, the RFE method has received the most attention in big data related applications (Park & Kim, 2020; Ustebay et al., 2018; Yan & Zhang, 2015).
Pre-classification: Pre-classification is to divide the data into multiple clusters that can be processed at the same time, which improves the processing efficiency and may also improve the prediction accuracy. Traditional classifiers, such as k-means (kM), FCM, self-organizing map (SOM), decision tree, classification and regression tree (CART), and RF, are applicable. However, traditional classifiers may not be able to handle the imbalance between classes. To address this problem, three approaches can be taken (Fernández et al., 2017): data-level processing to rebalance the training set, algorithmic processing to adapt the learning phase to a small cluster, and cost-sensitive processing that takes into account the costs caused by cluster imbalance. FCM, as a traditional classifier, can also solve this problem, because each data belongs to all clusters, but with different memberships (T. C. T. Chen et al., 2020).
Prediction: Prediction is one of the most critical applications of big data analytics methods (T. C. T. Chen, 2022a). There are many existing big data prediction methods, and different methods are suitable for different purposes, such as the dynamic factor model for predicting the diffusion index, the multi-factor augmented Bayesian shrinkage model for predicting employment, the factor augmented error correction model for predicting bilateral exchange rates, Bayesian regression model for predicting price index, an artificial neural network (ANN) for predicting household expenditure (Hassani & Silva, 2015), principal component regression for predicting job cycle time, principal component analysis (PCA)-ANN for predicting price index, etc (T. C. T. Chen, 2022b). Hassani and Silva (2015) divided existing big data forecasting methods into two categories: statistical techniques and data mining techniques.
Aggregation: In a fuzzy big data analytics approach, a data cannot be absolutely classified into a single cluster. Therefore, the prediction methods of all clusters can be applied to make predictions for the data. Then, the predictions produced by all prediction methods need to be aggregated. Existing aggregation techniques include weighted average, fuzzy interaction (T. Chen & Lin, 2008; Yolcu et al., 2016), back propagation network (Lin & Chen, 2019), etc.
Prediction performance evaluation: The prediction performance of fuzzy big data analytic methods needs to be evaluated from three aspects. First, efficiency, in terms of execution time, is critical for big data analytics problems. Furthermore, the forecast accuracy of forecasting can be measured by mean absolute error (MAE), mean absolute percentage error (MAPE), and root mean squared error (RMSE). In addition, the average range and hit rate of fuzzy forecasts can be used to evaluate the precision that a fuzzy big data analytics method can achieve.
Procedure
The implementation process of the proposed methodology comprises the following steps (shown in Figure 3):
Step 1. Feature selection.
Step 2. Data splitting.
Step 3. Pre-classification.
Step 4. Prediction.
Step 5. Aggregation.
Step 6. Prediction performance evaluation.

Implementation process of the proposed methodology.
Two characteristics of the proposed methodology are fuzzy logic and big data analytics. Among these steps, fuzzy techniques are applied to pre-classification and aggregation, while big data analytics is applied in feature selection, prediction, and aggregation.
The definitions of parameters and variables in the proposed methodology are given in Table 1.
Definitions of Parameters and Variables in the Proposed Methodology.

Feature Selection
In the fuzzy big data analytics approach, two of the most widely used feature selection techniques, the RF method with RFE (Abedinia et al., 2017; Darst et al., 2018; Park & Kim, 2020; Ustebay et al., 2018) and correlation analysis (Gogtay & Thatte, 2017) are jointly applied. The former is a post-selection method that selects features to optimize prediction performance, while the latter is a pre-selection method that selects features based on their values.
First, bootstrap sampling (i.e., random sampling with replacement) is used to randomly select samples from the collected data. Due to replacement after random sampling, some data may be double-selected and some will never be selected. The latter is called out-of-bag (OOB) data. Random samples are used to build/train a forest of multiple decision trees to predict the revenue of the catering industry. The trained decision trees are then applied to make predictions for the OOB data. The predictions produced by all decision trees are averaged, on this basis the prediction performance is evaluated in terms of mean squared error (MSE) as

where
RFE can be combined with cross-validation methods, such as k-fold cross-validation or leave-one-out cross-validation (LOOCV) (Wong, 2015), to reliably assess prediction performance. In the proposed methodology, LOOCV is applied because the collected data will be divided into clusters. Some clusters may be very small. In this way, only one sample is left as validation data, and the rest are used to train/build decision trees. The training and validation process is repeated until all samples have been used as validation data.
Subsequently, the appropriateness of factors selected using the RF method with RFE is confirmed by performing a correlation analysis between the revenue of the catering industry and each of the selected factors.
Pre-classification
FCM is applied in the proposed methodology to pre-classify the collected data. FCM classifies collected data by minimizing the following objective function (T. Chen, 2011; Guha & Veeranjaneyulu, 2019; Wu & Chen, 2015):

where K is the required number of clusters;
The objective function can be optimized according to the following procedure (T. C. T. Chen & Honda, 2020):
Step 1. Generate initial classification results.
Step 2. (Iterations) Obtain the centroid of each cluster as

where


where
Step 3. Re-measure the distance of each example to the centroid of every cluster, then recalculate the membership.
Step 4. Stop if the following condition is met. Otherwise, return to Step 2:

where
In this study, the optimal number of clusters is determined by varying the number of clusters to maximize prediction accuracy.
Prediction
A DNN is built to predict the revenue of the catering industry for each cluster. These DNNs can be configured differently. Each DNN has three to five layers: an input layer, one to three hidden layers, and an output layer, as shown in Figure 4.

Architecture of the DNN.
Inputs to the DNN are the factors related to predicting the revenue of the catering industry in period t: {


Between two consecutive hidden layers, the following operations are performed:
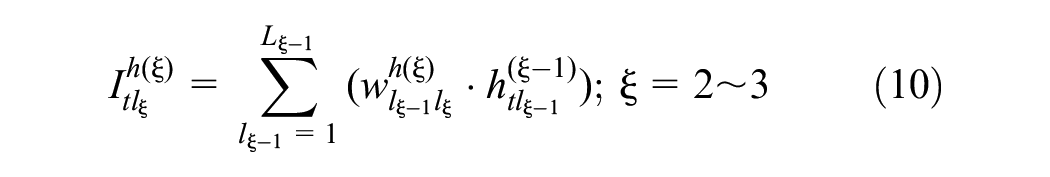


Outputs from the last hidden layer are aggregated at the output node:

then the output is

where


To determine the values of network parameters, the DNN is trained using the Levenberg–Marquardt (LM) algorithm (Suzuki, 2011).
Aggregation
The DNNs of all clusters can be applied to predict the revenue of the catering industry. Let the revenue predicted by the k-th DNN be denoted by

Case Study
Background
The proposed methodology was applied to forecast the monthly revenue of the Taiwanese catering industry during the COVID-19 pandemic, that is, from January 2020 to January 2022. Therefore, the data collected includes monthly revenues for 25 months.
Factors that could impact the revenue of the catering industry during the COVID-19 pandemic were used as inputs to the proposed methodology. As shown in Table 2, there are a total of 23 input variables, named X1 to X23, including government statistics on the catering industry and COVID-19 statistics. In this study, 85% of the collected data was used as training set and the rest was reserved for testing/evaluation.
Factors That May Affect the Revenue of the Catering Industry During the COVID-19 Pandemic.

Application of the Proposed Methodology: Model Building
The importance of each factor was first assessed using RFs. As can be seen from Figure 5, the importance of gross monthly income per capita in the catering industry (X9) was the highest, while the importance of the number of people that have received the second dose of COVID-19 vaccine (X4) was the lowest. The former was 98 times more important than the latter.

Importance of each factor evaluated using the RF method.
Then, LOOCV was used for cross-validation, and the factors with the lowest importance level were excluded one by one. After eliminating a factor, the prediction accuracy was re-evaluated. Finally, the number of factors that achieved the highest prediction accuracy was taken, as shown in Figure 6. In this case, six factors were used as input to the DNNs, as shown in Table 3.

Determining the optimal number of factors.
Factors Used as Inputs to the DNNs.

To confirm whether these six factors do have an impact on the revenue of the catering industry, the Pearson product-moment correlation coefficient between each factor and revenue was calculated, as shown in Table 4. Clearly, these six factors were highly correlated with the revenue of the catering industry.
Pearson Product-Moment Correlation Coefficient Between Each Factor and the Revenue.

The collected data was then divided into two to four clusters using FCM. The clustering results are summarized in Figure 7. Each example can be divided into all clusters, but with different memberships. The number of examples in each cluster was counted if each example was classified into the cluster with the highest membership. The results are summarized in Table 5. The optimal number of clusters was determined by changing the number of clusters to optimize prediction accuracy.
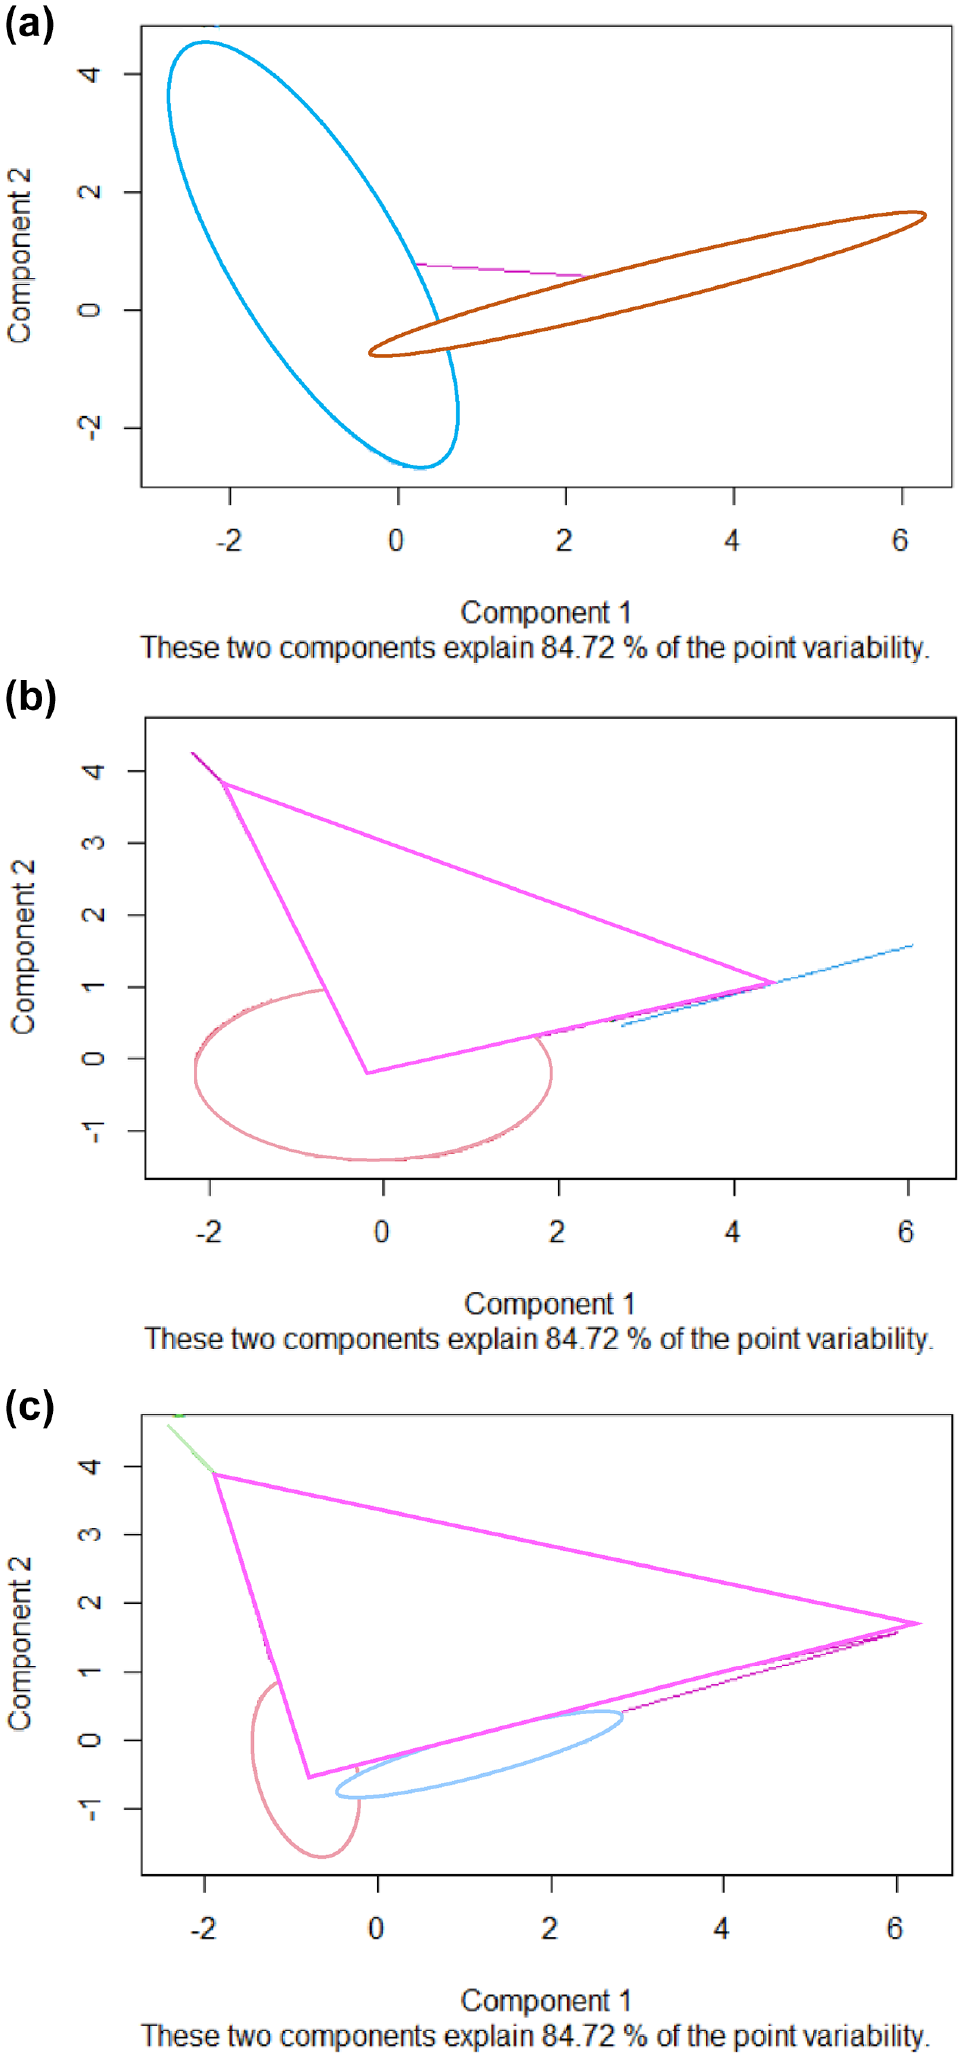
Clustering results: (a) two clusters, (b) three clusters, and (c) four clusters.
Number of Examples in Each Cluster.

For each cluster, a DNN was constructed to predict the revenue of the catering industry from the values of six factors based on the training data belonging to that cluster. The training algorithm was the LM algorithm. The configuration of the DNN was optimized by varying the number of hidden layers and the nodes in these layers to minimize RMSE and MAE. For example, the collected data was divided into two clusters, and for the first cluster, a DNN with three hidden layers was constructed. Then, the numbers of nodes in the hidden layers were changed to optimize the prediction performance. The results are summarized in Table 6. Finally, the optimal numbers of nodes in the hidden layers were 6, 4, and 5, respectively. The optimal configuration of the DNN is shown in Figure 8.
Number of Nodes in Each Hidden Layer and the Prediction Performance.


Optimal configuration of the DNN.
Application of the Proposed Methodology: Evaluation
Then, the trained DNNs of all clusters were used to predict the revenue of the catering industry for the test data. Then, the predictions of all DNNs were aggregated using the weighted sum method. The predicted results are summarized in Figure 9.
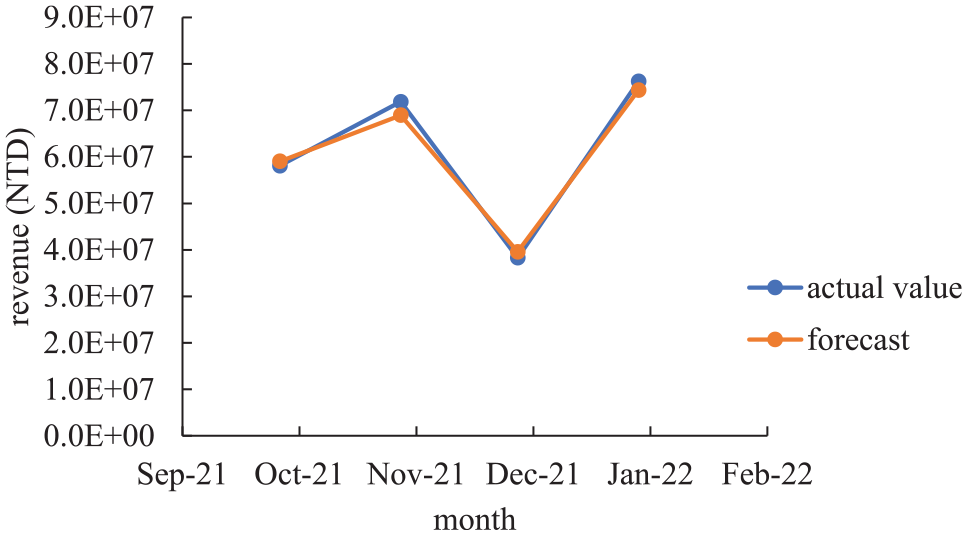
Forecasting results.
Discussion
Based on the experimental results, the following discussions were made:
Among factors reflecting health risks, the number of newly diagnosed COVID-19 cases was far less important than the number of new deaths. This was not surprising, since the former was distorted by government manipulation of such cases and the need for people to evade PCR testing to avoid post-diagnosis isolation.
The accuracy of predicting the revenue of the catering industry in Taiwan using the proposed methodology was evaluated as
MAE = 1,756,984 (NTD)
MAPE = 2.9%
RMSE = 1,907,823 (NTD)
The MAPE using the proposed methodology was only 2.9%, showing very good prediction accuracy. Therefore, the revenue forecast provided a reliable basis for the government and practitioners to take relevant actions.
As expected, high unemployment and new deaths during the COVID-19 pandemic led to a lower revenue in December 2021.
The effects of big data analytics techniques, such as feature selection and data clustering, on prediction performance was also analyzed. The results are summarized in Table 7.
To further elaborate the effectiveness of the proposed methodology, several existing methods including multiple linear regression (MLR) (Su, 2020; Yang et al., 2020), RF (Tanizaki et al., 2021), RFE+RF (Park & Kim, 2020; Ustebay et al., 2018) DNN (Sun et al., 2021), and RFE+DNN (Abedinia et al., 2017; Darst et al., 2018; Lin et al., 2019; Suganya & Shanthi, 2012; Wang & Chen, 2019) were also applied to the collected data for comparison. The configuration of each DNN has been optimized. Table 8 compares the prediction performances using various methods. When the collected data was divided into two clusters and each DNN had a single hidden layer, the prediction accuracy measured by MAE, MAPE or RMSE was optimized using the proposed methodology. Compared with the baseline method, MLR, the proposed methodology outperformed by up to 90%.
Figure 10 shows the prediction accuracy using RF (according to RMSE) when the number of trees varied. Obviously, the prediction accuracy did not always improve with the number of trees. As a result, when these were 7 trees, the prediction accuracy was optimized, giving a minimum RMSE of 7.75 × 10⁶, which was still worse than that using the proposed methodology.
Effects of Big Data Analytics Techniques on Prediction Performance (2 Clusters and 2 Hidden Layers).

Comparison of the Prediction Performance Using Various Methods.


Prediction accuracy using RF when the number of trees varied.
Conclusions
From mid-May 2021, Taiwan issued a level 3 pandemic alert due to the COVID-19 pandemic, which was not officially lifted until July 26. During the more than 2-month-long lockdown, the catering industry was banned from indoor dining and foreign tourists were few and far between. As a result, people went out less and the catering industry saw a severe drop in revenue, forcing many restaurants to close. Predicting the revenue of the catering industry during the COVID-19 pandemic will not only allow practitioners to adjust their business strategies, but also provide a reference for governments to formulate relief measures. To this end, this study proposes a fuzzy big data analytics approach. The proposed methodology combines RF, RFE, and FCM to select relevant factors and cluster the collected data, and then build a DNN for each cluster to make predictions.
The effectiveness of the fuzzy big data analytics approach was tested using real data from January 2020 to January 2022. According to the experimental results,
Compared with the baseline MLR method, the fuzzy big data analytics approach improved the prediction accuracy by 90% in terms of MAE, MAPE and RMSE.
Compared with other big data analytics methods, the proposed methodology also enhanced the prediction performance by reducing the RMSE by 16%.
In theory, a DNN with more hidden layers can better fit a more complex nonlinear function, and further improve the prediction performance using the DNN. The experimental results confirmed this belief. When the DNN had three hidden layers, its prediction performance was optimized.
In contrast, dividing the collected data into two clusters had the best prediction accuracy. More clusters may be bad for the prediction performance.
The following managerial implications are derived from the experimental results:
After the outbreak of COVID-19, the factors that have a greater impact on the revenue of the catering industry in Taiwan included gross monthly income per capita in the catering industry, unemployment rate, new deaths, gross monthly income per capita, the number of new releases from isolation, and total working hours. Many of these are related to the health risks posed by COVID-19. The government and enterprises should try to eliminate related shocks.
The number of new deaths was far more important than the number of newly confirmed COVID-19 cases, as the latter was subject to government manipulation and the need for people to evade PCR testing to avoid post-diagnosis isolation.
The proposed methodology can be applied to predict another index of the catering industry or another industry that also suffers from the COVID-19 pandemic. Additionally, factors affecting the revenue of the catering industry are likely to continue to change as COVID-19 develops. The same analysis needs to be done again in the near future.
Acronyms

Footnotes
Acknowledgements
Not available.
Author Contributions
All authors contributed equally to the writing of this paper.
Ethical Approval
Not required.
Declaration of Conflicting Interests
The author(s) declared no potential conflicts of interest with respect to the research, authorship, and/or publication of this article.
Funding
The author(s) received no financial support for the research, authorship, and/or publication of this article.
Guarantor
Not required.
Data Availability Statement
Data cannot be shared openly but are available on request from authors.