
Abstract
This article presents the French-Canadian validation of the Burnout Assessment Tool (BAT) developed by Schaufeli et al. The BAT scale is designed to evaluate both core symptoms (BAT-C) and secondary symptoms (BAT-S) of burnout. Empirical tests were conducted using three distinct samples of teachers from two different Canadian provinces (n1 = 488; n2 = 522; n3 = 269). The validation process followed the transcultural validation procedure proposed by Lauzier et al. The contributions of these findings support the assertion that the BAT demonstrates satisfactory psychometric properties and provides substantial evidence for its construct validity, fidelity, and criterion validity (concurrent, divergent, and convergent). Additionally, these results underscore the significance of addressing burnout issues among teachers, as highlighted by comparing the study groups with established norms within other occupational populations.
Introduction
Employee burnout has emerged as a pressing concern across various sectors, prompting distinct approaches within different workplaces to mitigate its detrimental impact on the workforce (Edú-Valsania et al., 2022). Notably, even before the COVID-19 crisis, the education sector has been identified as a particularly vulnerable setting (García-Arroyo et al., 2019; García-Carmona et al., 2019; Platsidou & Daniilidou, 2016). While caution is warranted in drawing this conclusion (e.g., García-Carmona et al., 2019; Watts & Robertson, 2011), empirical evidence emphasizes the multifaceted ramifications of teacher burnout at personal, interpersonal, and organizational levels within educational contexts (Mota et al., 2023).
From an individual standpoint, burnout has adverse consequences on teachers’ physical and psychological health. Specifically, teachers face an increased susceptibility to developing physical ailments, voice disorders, and recurrent somatic complaints (refer to Madigan et al., 2023 for a comprehensive systematic review on this topic). Moreover, burnout can engender a diminished sense of self-efficacy and self-regulation, a perceived lack of social support, an estrangement from professional identity, reduced commitment and effort as well as a compromised quality of life (Ghanizadeh & Jahedizadeh, 2015).
On an interpersonal level, Madigan and Kim (2021) acknowledge the potential impact of teacher burnout on students’ educational experiences. Although these findings require cautious interpretation due to inherent limitations pertaining to the conceptualization and measurement of the reviewed articles. Numerous investigations have explored the influence of burnout on interpersonal relationships within educational settings, including the emotional contagion of burnout symptoms among team members (e.g., Alava, 2016; Meredith et al., 2020).
From an organizational perspective, teacher burnout contributes to attrition within the profession (Ghanizadeh & Jahedizadeh, 2015), exacerbating personnel shortages observed in North America (Desmarais et al., 2023; Dillard, 2023; Ingersoll et al., 2019; Kamanzi et al., 2016). This instability in the workforce poses a threat to the continuity of educational projects implemented within schools (Sorensen & Ladd, 2020).
In recent years, considerable research efforts have been dedicated to unraveling the causes of burnout. However, the pandemic has further intensified interest in understanding its ramifications within the workplace (Gómez-Domínguez et al., 2022). To explore the impact of burnout on teachers specifically, Mijakoski et al. (2022) conducted a systematic review, identifying more than 60 determinants that may contribute to teacher burnout. The authors categorized these determinants into four types: (i) individual characteristics encompassing factors such as interpersonal rejection sensitivity and self-doubt; (ii) conflict relationships, such as stress caused by interpersonal relationships with colleagues or the organization; (iii) support factors that refer to the absence of social integration, conflict factors involving stress stemming from relationships with colleagues or students; and (iv) organizational contextual factors including a lack of stimulating work environments.
In contrast to other related constructs like well-being, the definitions of burnout exhibit a certain degree of convergence. However, numerous scholars acknowledge the limitations inherent in the prevailing conceptualizations and measures of burnout.
The Conceptualization and Measurement of Burnout
The concept of “burnout” was initially introduced by Freudenberger (1974) and further developed by C. Maslach (1976). While the early focus of burnout research centered on workers in factories and industries, the conceptual boundaries of burnout have since been refined to encompass workers in “human professions,” such as teaching and nursing (Kristensen et al., 2005). According to C. A. Maslach (1998, p. 68), “job burnout is a prolonged response to chronic interpersonal stressors on the job.” This syndrome, or response to stress, includes: “[1] an overwhelming exhaustion, [2] feeling of cynicism and detachment from the job, and [3] a sense of ineffectiveness and lack of accomplishment” (C. Maslach et al., 2001, p. 399). The dimension of exhaustion is associated with an individual’s response to burnout when they lack the emotional and physical resources to cope with job-related stress. Feelings of cynicism or detachment from the job reflect the interpersonal component of work, which refers to “a negative, callous, or excessively detached response to various aspects of the job” (C. Maslach et al., 2001, p. 399). Lastly, the sense of ineffectiveness or lack of accomplishment represents the self-evaluation of an individual’s perceived competence and achievement.
This definition is widely used to describe burnout syndrome and is closely associated with the Maslach Burnout Inventory (MBI; C. Maslach, 1986; C. Maslach & Jackson, 1981). In fact, the MBI is often regarded as the “gold standard” for assessing burnout (Schaufeli et al., 2020a; Williamson et al., 2018). Kristensen et al. (2005) reported that as of 2005, approximately 90% of empirical studies on burnout employed the MBI. Nevertheless, in the field of education, some studies have assessed teacher burnout using a variety of instruments, which often makes cross-study comparisons difficult (e.g., Mijakoski et al., 2022). This measurement heterogeneity not only limits the comparability of findings but also complicates the synthesis of evidence through systematic reviews and meta-analyses (Agyapong et al., 2022, 2023).
The MBI continues to be widely used, particularly in the field of education, and consists of three distinct subscales, each of which may be influenced by different determinants (Kristensen et al., 2005). Over time, several versions of the MBI have been developed, such as the General Survey (MBI-GS), Human Service Survey (MBI-HSS), and the General Survey for Students (MBI-GSS). Furthermore, an adapted version specifically designed for teachers, known as the Educator Survey (MBI-ES), has also been created. This version is based on the same three components used in other forms of MBI, but the term “recipient” has been changed to “students” for clarity (C. Maslach et al., 1997). Limitations associated with this form of MBI have been observed. For instance, Aboagye et al. (2018) suggested that a significant reduction in the number of items is necessary to reach sufficient construct validity. Others, such as Schaufeli et al. (2023), criticize the exclusive reliance on the MBI, arguing that its methodological limitations have hindered scientific progress as the instrument does not allow burnout to be assessed as a global construct because its subscales cannot be combined into a composite score.
Given the popularity of the MBI, Kristensen et al. (2005) observed that “burnout is what the MBI measures, and the MBI measures what burnout is” (p. 193). However, after a study of the MBI, these authors, as well as others (e.g., Aboagye et al., 2018; Demerouti & Bakker, 2008; Hadžibajramović et al., 2020; Schaufeli & De Witte, 2023; Shirom, 2005) shed light on several limitations of the concept, its measurement, and the relationship between them (e.g., the unclear relationship between burnout and the MBI, the mixture of an individual state, a coping strategy, and an effect to understand burnout). They also highlighted the limitations associated with the measure’s accessibility (i.e., it is not available in the public domain). To overcome these weaknesses, they proposed the Copenhagen Burnout Inventory (CBI) as a tool to assess burnout. For Kristensen et al. (2005), the core of burnout consists of fatigue and exhaustion, and they add a key feature: the “attribution” of these core symptoms. The CBI is unidimensional, but measures burnout through three attributions (Kristensen et al., 2005, p. 197):
Personal burnout: “[t]he degree of physical and psychological fatigue and exhaustion experienced by the person”;
Work-related burnout: “[t]he degree of physical and psychological fatigue and exhaustion that is perceived by the person as related to his/her work”;
Client-related burnout: “[t]he degree of physical and psychological fatigue and exhaustion that is perceived by the person as related to his/her work with clients.”Note. In the client-related scale, the term “client” can be replaced to suit the targeted population.
Several studies have shown CBI to be a valid measure of burnout among teachers by replacing “client” with “student” (e.g., Angelini et al., 2021; Fiorilli et al., 2015; Belay et al., 2023; Milfont et al., 2008; Piperac et al., 2021; Sestili et al., 2018). Although this tool is less widely used than the MBI, it is relatively well represented within the school context. One of the criticisms directed toward the CBI is that burnout is limited to fatigue and exhaustion, without considering other symptoms that could also be indicative of this syndrome (Schaufeli et al., 2020a).
In addition to the MBI and CBI, other measures are available for assessing burnout, including the Burnout Measure (BM; Pines & Aronson, 1988), the Copenhagen Psychosocial Questionnaire which includes a measure of the symptoms of burnout (COPSOQ; Kristensen et al., 2005; COPSOQ-II; Pejtersen et al., 2010; COPSOQ-III; Burr et al., 2019), and the Oldenburg Burnout Inventory (OLBI; Demerouti & Bakker, 2008). Various studies have compared the psychometric properties of these measures with other available instruments for assessing burnout, such as those conducted by Arthur (1990), West et al. (2009), Platsidou and Daniilidou (2016), or Schaufeli et al. (2020a). As indicated by these authors, all measurements have their limitations, such as issues related to the tool’s internal structure and highly correlated subscales. Nevertheless, the MBI is considered the preferred option by some, as noted by Platsidou and Daniilidou (2016), despite its drawbacks. According to a systematic review by Shoman et al. (2021), more commonly used burnout measures, such as the MBI, the BM, Psychologist Burnout Inventory (PBI; Ackerley et al., 1988), the OLBI, and the CBI, suffer from significant psychometric limitations, including insufficient content validity, inconsistent result interpretation, and the absence of standardized diagnostic criteria.
In recent years, new measures have been developed to address some of the limitations associated with the MBI. One such measure is the Burnout Assessment Tool (BAT) introduced by Schaufeli et al. (2020a). Building on previous work, a subsequent review conducted by Shoman et al. (2023) extended the evaluation of burnout measures, adding the Shirom-Melamed Burnout Measure (SMBM) and the BAT. The evaluation followed the Consensus-based Standards for the selection of health Measurement Instruments (COSMIN) framework and Grading of Recommendations, Assessment, Development, and Evaluation (GRADE) guidelines. The findings revealed that while the SMBM demonstrated insufficient content, structural, and criterion validity despite adequate internal consistency, the BAT showed moderate evidence for content, structural, criterion, and construct validity, along with high internal consistency. Although cross-cultural validity and further validation remain necessary, the BAT currently represents a psychometrically promising instrument. Articles reporting the strong psychometric properties of the BAT have emerged in recent years, as stated by some researchers (see for instance Androulakis et al., 2023; Cho, 2020; De Beer et al., 2022; Hadžibajramović et al., 2020; Romano et al., 2022).
The Burnout Assessment Tool
The BAT was developed to address the limitations of the MBI and other burnout measures (Schaufeli et al., 2023). Indeed, in contrast to other measures of burnout, the creation of the BAT employing both inductive and deductive processes, the BAT was conceived through methods such as semi-directed interviews and extensive review of relevant literature (see Schaufeli et al., 2020a for more details on the conception of the BAT). By incorporating insights from these qualitative and quantitative sources, the BAT aims to enhance the accuracy and comprehensiveness of burnout assessment. Extending the recognition of burnout beyond work-related domains underscores the need for a context-independent version of the instrument, capable of evaluating burnout in individuals who are presently not engaged in employment (Schaufeli et al., 2020a). This tool has also been formulated to identify cut-off scores which provide a better understanding of burnout in the study population, by having references for “healthy” people and for people who are “burned out” (Schaufeli et al., 2020a, 2023).
The BAT operates under the premise that burnout represents a syndrome characterized by interconnected symptoms, as indicative of an underlying psychological condition. It builds upon the conceptualization of burnout as “[…] a work-related state of exhaustion that occurs among employees, which is characterized by extreme tiredness, reduced ability to regulate cognitive and emotional processes, and mental distancing. These four core dimensions are accompanied by a depressed mood as well as by non-specific psychological and psychosomatic distress symptoms […]” (Schaufeli et al., 2020a, p. 28). These four core components can be defined as follows, according to Schaufeli et al. (2020a, pp. 27–28):
Exhaustion“refers to a severe loss of energy that results in feelings of both physical (tiredness, feeling weak) and mental (feeling drained and worn-out) exhaustion.”
Emotional impairment“manifests itself in intense emotional reactions and feeling overwhelmed by one’s emotions.”
Cognitive impairment“is indicated by memory problems, attention and concentration deficits and poor cognitive performance.”
Mental distance is the action of “psychologically distancing oneself from the work is indicated by a strong reluctance or aversion to work.”
These four core components are also associated with three categories of secondary symptoms: psychological distress, which refers to non-physical symptoms (e.g., worrying, feeling anxious, unwanted weight changes); psychosomatic complaints, which manifest as physical discomfort that is explained or exacerbated by a psychological source (e.g., chest pain, digestive problems, headaches); and a depressed mood (e.g., inability to experience pleasure or a feeling of powerlessness that is not associated with normal fluctuations). While these were initially identified as secondary symptoms, further analysis revealed a two-factor structure for the secondary dimensions (Schaufeli et al., 2020a). To better assess depressed mood, these authors suggest including a specific scale (Schaufeli et al., 2020c). As stated by Schaufeli et al. (2020a), burnout has an energy-level and motivational component; the employee is less able and less willing to do his or her job.
Even if these elements are converging toward a single syndrome, individual burnout symptoms or dimensions can be examined independently to provide a more detailed understanding of the overall manifestation of burnout (Schaufeli et al., 2023). This consideration for separate assessment of symptoms is particularly significant in the context of individualized burnout evaluations, allowing for a more comprehensive and tailored assessment.
Aim of the Study
The BAT emerges as a compelling option when it comes to comprehensively examining the working conditions faced by teachers and ensuring the utilization of a robust and well-grounded tool. Although other burnout measures are available in French, the BAT’s characteristics, particularly its ability to position the target population relative to established reference groups and its accessibility (e.g., free administration), make it a valuable addition to the tools available for teachers and the broader French-Canadian workforce. A strong validation process, as proposed in this paper, may also enable researchers studying burnout in other French-speaking Canadian worker populations to use a linguistically adapted version of the instrument and conduct further analyses. As such, this paper aims to assess the factor structure and the psychometric properties of the short version of the Burnout Assessment Tool among French-Canadian teachers through a transcultural validation procedure embedded in a multi-sample study (three samples and one subsample).
Method
Inspired by the recommended eight-step procedure outlined by Lauzier et al. (2023), a transcultural validation process was undertaken in this study. The key stages of this process are summarized in Table 1 for reference and clarity.
Transcultural Validation Procedure.

Participants
Throughout the steps, three samples were used (total N = 1,309). Sample 1 was composed of 488 teachers of a French-speaking primary, secondary, and career technical education school board in the province of Quebec, Canada (81.8% identified themselves as female) for a response rate of 30%; most were primary school teachers (57.4%); and the data were collected in fall 2022. Sample 2 was composed of 552 members of a teaching association (approximately 2,500 members) for French-speaking K-12 teachers in the province of New Brunswick, Canada, of which 87.1% identified themselves as female; most were primary school teachers (66.1%); the data were collected in spring 2022 (T1). Sample 3 was composed of 269 members of the same teaching association as Sample 2 (90.3% identified as female); most were primary school teachers (69.5%); and the data were collected in fall 2022 (T2). Sample 4 is a subsample composed of 90 individuals who participated in data collection during both time points (T1 and T2; these participants are also part of Samples 2 and 3). Sample 4 consisted of participants who completed the questionnaire both T1 and T2 assessments. This subsample was used to conduct a test–retest reliability analysis to examine the temporal stability of the BAT. In Sample 4, most participants were women (93.3%) and worked at the primary level (62.2%). The participating school board and the professional association were selected because they encompass a diversity of French-speaking educational contexts in Canada, including both rural and urban areas, as well as primary and secondary levels. These sites were accessible through established research partnerships and agreements, which facilitated participant recruitment and data collection.
The data reported in this study were collected in accordance with the ethical principles of human research of the Université de Moncton [previous affiliation of 1st author, file # 2122-063] and the Université Laval [file # 2022-196] as per their respective protocols. Participation was voluntary and informed consent was obtained from all participants. Measures such as fully anonymous data collection were taken to ensure confidentiality and minimize potential risks. Given the non-invasive nature of the study and the relevance of its findings for improving teachers’ working conditions, the benefits to participants outweighed any minimal risk of harm.
Data from the four samples were obtained through the administration of an online questionnaire, with participants self-reporting their measurements. For contextualization, it is important to consider the linguistic landscape of the two Canadian provinces from which the data originate. According to the latest Canadian census results (Statistics Canada, 2022), 77.8% of the population in Quebec lists French as their mother tongue, while in New Brunswick, this figure is 31.3%.
Table 2 presents the sociodemographic characteristics of the four samples that were examined, whereas Table 3 provides insights into the application of these samples throughout the transcultural validation phases. It should be noted that the majority of participants were female (over 80%), a proportion consistent with the broader Canadian teaching workforce (e.g., Organisation for Economic Co-operation and Development [OECD], 2024); while reflective of the profession, this demographic distribution may shape the Interpretation of this validation work.
Sociodemographic Characteristics of the Participants.
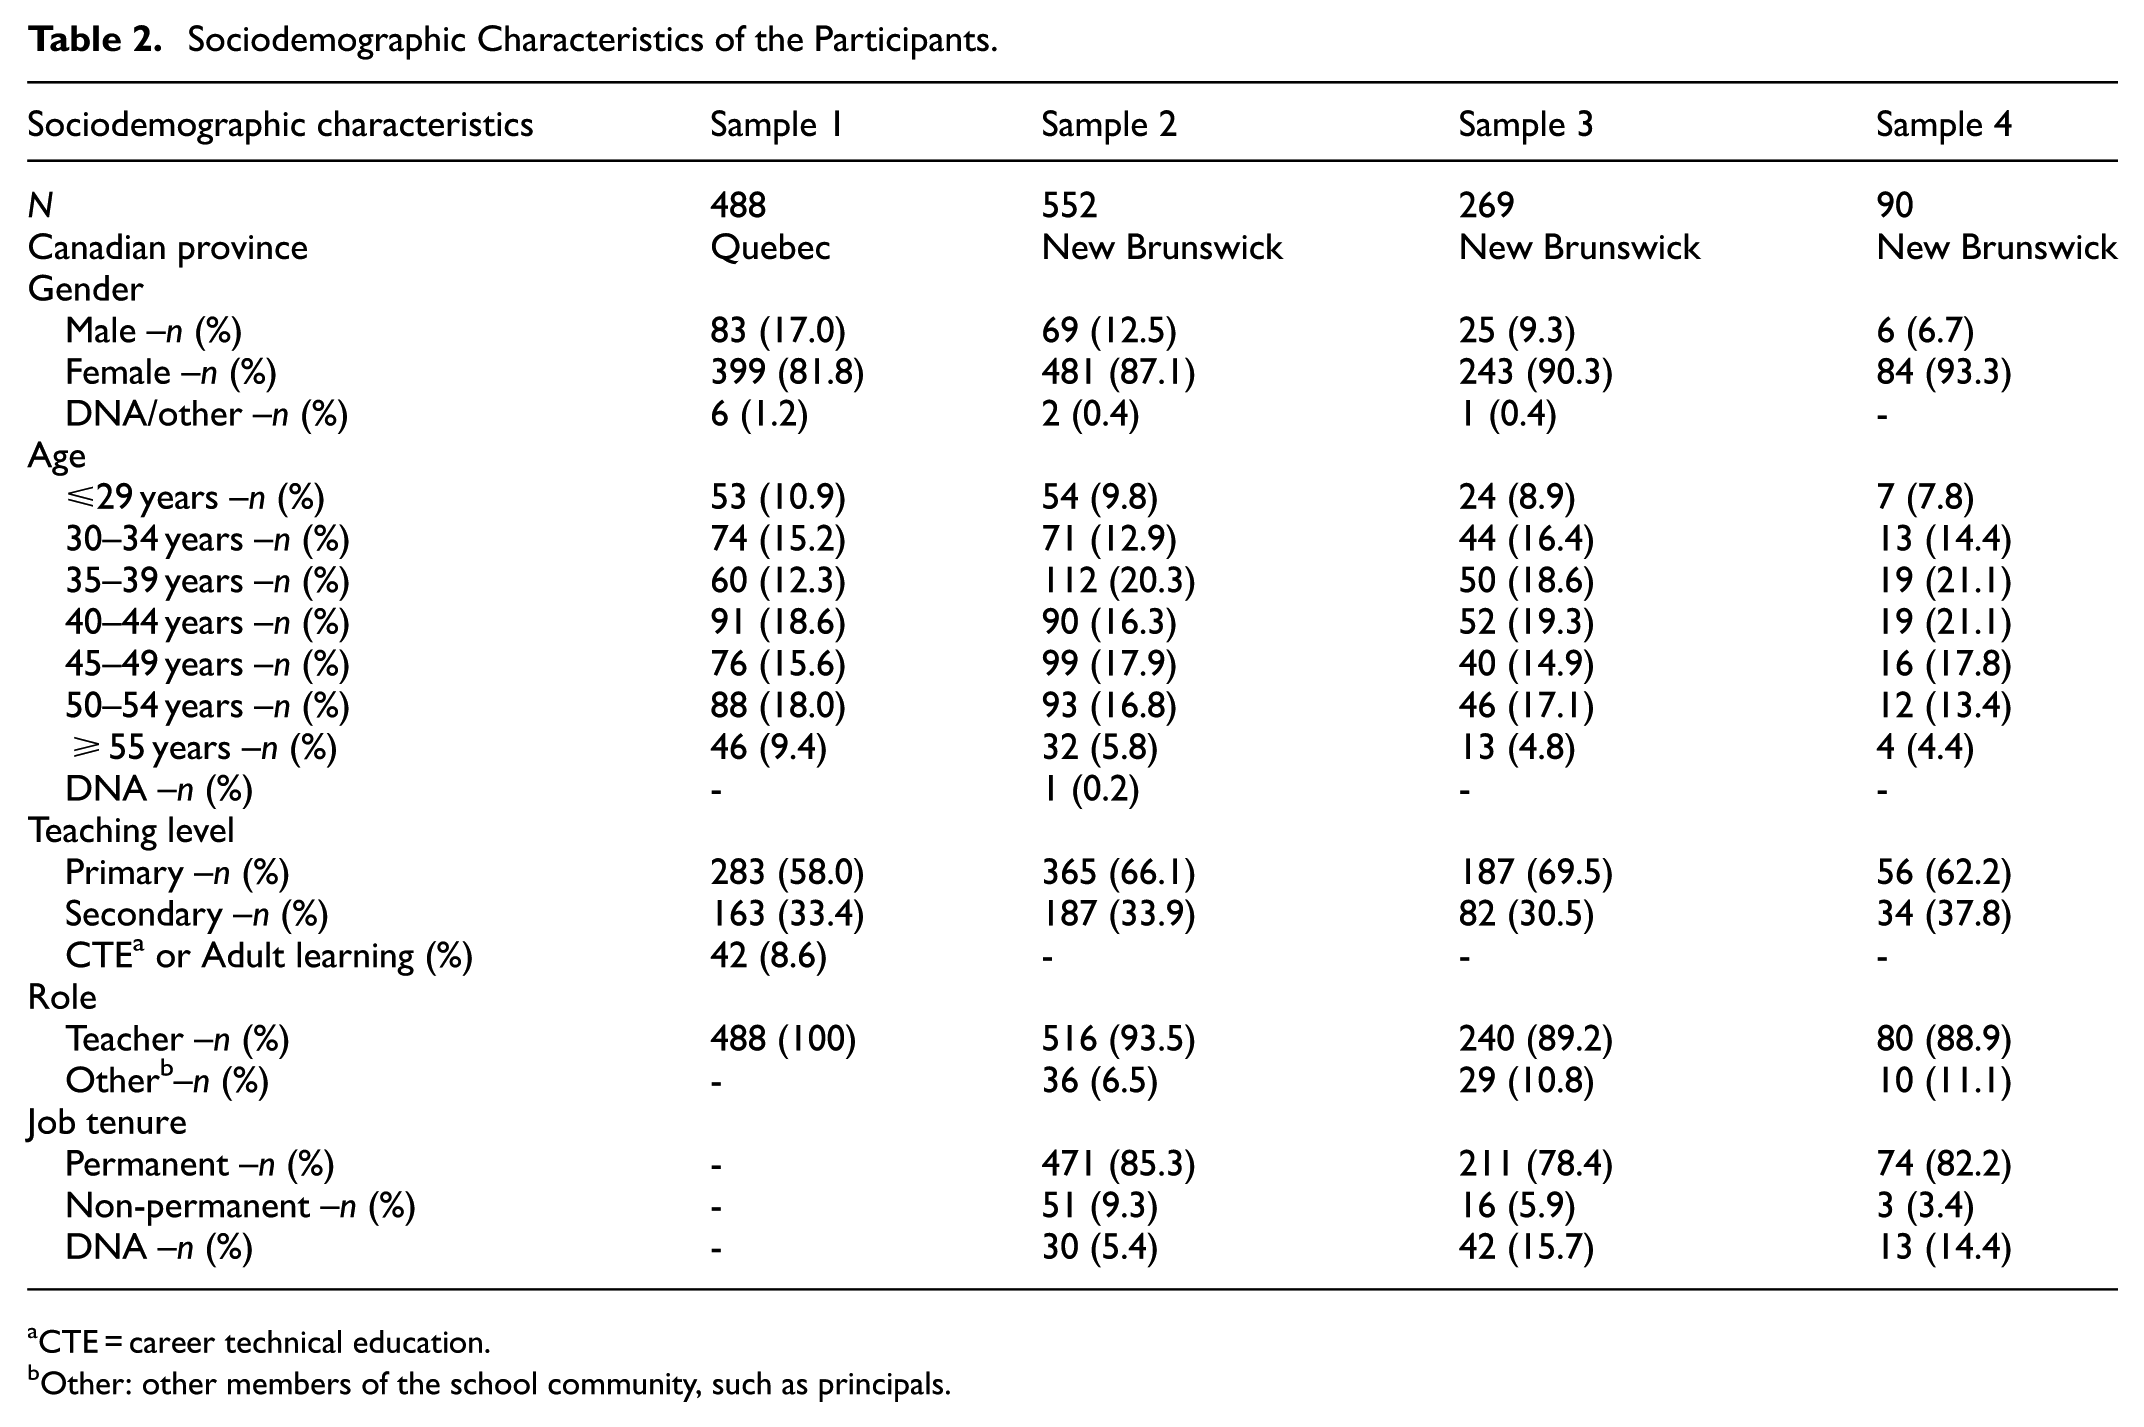
CTE = career technical education.
>Other: other members of the school community, such as principals.
Overview of the Sample Throughout the Transcultural Validation Steps.

Measures
Burnout Assessment Tool (BAT)
The short version of the BAT that measures the core symptoms (BAT-C; 12 items) and the secondary symptoms (BAT-S; 10 items) were used. The utilization of these two subscales is advised to acquire a more comprehensive understanding of burnout, which in turn allows for a more detailed examination of its manifestations (Schaufeli et al., 2020a, 2020b). The short version of the
Copenhagen Burnout Inventory (CBI)
The French version of the CBI adapted for teachers by Mamprin et al. (2022), based on the original English version developed by Kristensen et al. (2005), was used in this study. The CBI (25 items, three factors) is composed of three scales measuring three attributions: personal burnout (six items), work-related burnout (seven items), and student-related burnout (six items). Participants must indicate the frequency with which each statement applied to them (e.g., “How often do you feel tired?” [À quelle fréquence vous sentez-vous fatigué·e ?]) on a five-point Likert scale from 1 (never) to 5 (always). For this study, reliability coefficients (ordinal alpha and omega) for Sample 2 were found to be: αord = 0.936 and ω = 0.916 for personal burnout, αord = .787 and ω = 0.862 for work-related burnout, and αord = .884 and ω = 0.870 for student-related burnout.
Flourishing (FS)
The French adaptation (Villieux et al., 2016) of the original English version of FS developed by E. Diener et al. (2010) was used. The FS is a unidimensional (8-item) questionnaire designed to assess flourishing. Participants were required to indicate their level of agreement or disagreement with statements (e.g., “I lead a purposeful and meaningful life” [Je mène une vie qui a un but et un sens]) on a 7-point Likert scale from 1 (strongly disagree) to 7 (strongly agree). A high score indicates that the individual possesses multiple psychological resources and strengths. The reliability coefficients calculated for Samples 2 and 3 were .906 ≤ αord ≤ .907 and 0.866 ≤ ω ≤ 0.882.
Satisfaction with Life Scale (SWLS)
The SWLS (E. D. Diener et al., 1985), translated into French from the original English version by Blais et al. (1989) and adapted to work (see Merino et al., 2021), is a brief five-item questionnaire used to measure life satisfaction at work. Participants were asked to indicate their level of agreement or disagreement with statements (e.g., “In most ways my work is close to my ideal” [En général, mon travail correspond de près à mes idéaux] on a 7-point Likert scale (1 = strongly disagree to 7 = strongly agree). The values of the reliability coefficients calculated for Sample 2 and Sample 3 were .896 ≤ αord ≤ .909 and 0.879 ≤ ω ≤ 0.895.
Step 1 to Step 4 – Pre-test Procedures
Step 1 involved sourcing comprehensive information about the BAT, by consulting scientific and practical manuals, as well as other validation procedures. These data were mainly acquired from the official website (https://burnoutassessmenttool.be) associated with the tool in addition to recent publications (e.g., Schaufeli et al., 2023). Additionally, an extensive analysis of relevant literature concerning the BAT, such as transcultural validations (e.g., Angelini et al., 2021; De Beer et al., 2020; Mazzetti et al., 2022), was conducted by the research team. Step 2 consisted of a meticulous evaluation conducted by a committee of four individuals proficient in French (Canada). Hailing from the provinces of Quebec and New Brunswick (Canada), the committee members appraised the French (France) and Belgian iterations of the BAT-C and BAT-S accessible on the tool’s presenting website (https://burnoutassessmenttool.be). Their aim was to discern the most suitable phrasing for the initial rendition that respected the meaning of the original terms but did not create ambiguity according to French-Canadian linguistic codes in Quebec and New Brunswick. To achieve this, a comparative analysis was performed between the elements of the validated English and Italian versions being evaluated. This selection of languages was contingent upon the language competencies of the committee members. During step 3, the preliminary version was submitted to a test group of 10 people to assess the clarity of the items. Following this meticulous review, the experimental French-Canadian adaptation of the BAT was integrated into an online survey platform. During step 4 we tested the experimental version among two French-Canadian populations: Sample 1 (Quebec) and Sample 2 (T1, New Brunswick).
Step 5 – Assessment of Construct Validity
Analyses
The assessment of the construct validity of the BAT scores was carried out using exploratory factor analyses (EFAs) and confirmatory factor analyses (CFAs) in Jamovi, version 2.3.21.0 (Balci, 2022; Epskamp et al., 2019; Gallucci & Jentschke, 2021; Jorgensen et al., 2019; Patil, 2018; R Core Team, 2021; Revelle, 2019; Rosseel, 2012; The Jamovi project, 2022; Wickham et al., 2018).
The EFAs were conducted separately on the BAT-C and the BAT-S. Given the ordinal nature of the items, the violation of normality was assumed. Consequently, the principal axis extraction method was selected. In line with the theoretical model that guided the construction of the instrument and since the factors are likely to be correlated, the Oblimin rotation was applied. The number of factors to extract from the data was based on parallel analysis. Regarding the CFAs, we tested the structure of eight models previously investigated by Schaufeli et al. (2020a). For the BAT-C subscale, we compared three models of the core symptoms of burnout: the unidimensional model (Model 1), the correlated four-factor model (Model 2), and the second-order model with four first-order (Model 3). For the BAT-S subscale, we compared two models of secondary symptoms: the unidimensional model (Model 4) and the correlated two-factor model (Model 5). Finally, for the core and secondary symptoms, we tested three models: the six-factor correlated model (Model 6), the second-order model with six first-order factors (Model 7), and the second-order model with four first-order factors, two first-order factors, and two second-order factors (Model 8).
Similarly, as the ordinal nature of the items led to assume the violation of the assumption of normality, the weighted least square mean and variance adjusted (WLSMV) estimator was applied, as recommended by Bandalos (2014) and DiStefano and Morgan (2014). The model was rejected when the following model fit statistics were not met: comparative fit index (CFI)/Tucker-Lewis index (TLI) > 0.95 and standardized root mean square residual (SRMR) ≤ 0.08 (Hu & Bentler, 1999), and root mean square error of approximation (RMSEA) < 0.08 (MacCallum et al., 1992).
Results
Exploratory Factorial Analyses
For the primary symptoms (BAT-C), Bartlett’s test suggested the presence of correlations between items (Sample 1: χ2(66) = 2751, p < .001; Sample 2: χ2(66) = 2984, p < .001; Sample 3: χ2(66) = 1246, p < .001). The Kaiser-Meyer-Olkin (KMO) values (Sample 1: 0.874; Sample 2: 0.925; Sample 3: 0.870) indicated a good fit to latent factors, which seemed to be confirmed by the sample precision measurement with values between .808 and .939. The scree plots in the three samples suggested four factors that explained 51.8% to 61.3% of the total variance. All these results suggest that BAT-C is composed of exhaustion, mental distance, cognitive impairment, and emotional impairment. These four factors were positively correlated (Sample 1: .355 ≤ r ≤ .546; Sample 2: .498 ≤ r ≤ .683; Sample 3: .388 ≤ r ≤ .592). Finally, all items loaded on their respective factors (between 0.400 and 0.965) except for BAMD3 in Sample 2 and Sample 3.
For the secondary symptoms (BAT-S), Bartlett’s test suggested the presence of correlations between items (Sample 2: χ2(45) = 1834, p < .001; Sample 3: χ2(45) = 755, p < .001). The KMO test (Sample 2: 0.904; Sample 3: 0.860) indicated a good fit of data to latent factors, which seemed to be confirmed by the sample precision measurement with values between 0.802 and 0.948. The scree plots suggested two factors that explained 40.2% to 42.5% of the total variance. Together, these results suggest that BAT-S comprises psychological and psychosomatic complaints. These two factors were positively correlated (Sample 2: r = .827; Sample 3: r = .518). The structure matrix analysis of Sample 2 showed that all items loaded on their respective factors (between 0.467 and 0.788) except for BAPs5 (0.323), which loaded on psychosomatic complaints rather than psychological complaints, and BASo1 which loaded on psychological complaints (0.325). In Sample 3, items loaded on their respective factors (between 0.376 and 0.879) except for BASo1 (0.386) and BASo5 (0.340), which loaded on psychological complaints rather than psychosomatic complaints. BAPs1 and BAPs5 were rejected as they fell beneath the 0.32 threshold (Tabachnick & Fidell, 2014).
Confirmatory Factor Analyses
Table 4 presents the fit indices of the tested models (the details of the parameter estimates for the chosen models can be found in the Appendices, Table X.1–X.7). Firstly, for core symptoms (BAT-C), the results indicated that Model 1 did not fit the data well from the three samples (Samples 1, 2, and 3). Although the fit statistics for Model 2 and Model 3 were acceptable for the three samples, we favored Model 2 because it provided better results than Model 3 for each sample. Factor loadings were statistically significant for all samples, with values ranging from 0.475 to 0.918. Item variances attributable to the four latent factors ranged from 22.5% to 84.3%. However, the variance for the mental distance item BAMD3 was less than 50% in all three samples. The correlations between the four latent factors were positive in all three samples. Also, all correlations were strong (.538 ≤ r ≤ .814) except for the one between exhaustion and emotional impairment in Sample 1 (r = .492), which was moderate.
Statistics from Models in Sample 1 (n = 488), Sample 2 (n = 552), and Sample 3 (n = 269).

Note.χ2 = chi-square; df = degrees of freedom; CFI = comparative fit index; TLI: Tucker-Lewis Index; SRMR = standardized root mean square residual; RMSEA = root mean square error of approximation; CI = confidence interval; All χ2 values loadings are significant at p < .001.
Secondly, for secondary symptoms, Model 4 had a good fit for Sample 2 but a poor fit for Sample 3. On the other hand, Model 5 was a good fit for both samples. Thus, model 5 better represents the factor structure of secondary symptoms. Factor loadings were statistically significant for all samples with Model 5, ranging from 0.389 to 0.878. Item variances attributable to the two latent factors ranged from 15.2% to 77.1%. However, item variances were below 50% for psychological complaints items BAPs1 and BAPs5, and psychosomatic complaint items BASo2, BASo3, BASo4, and BASo5 in both samples. Also, both samples saw strong positive correlations for latent factors among the aforementioned items.
Third and finally, for core and secondary symptoms, Model 6, Model 7, and Model 8 fit the data well for both samples. However, Model 6 was preferred, as its indices demonstrated a better fit to the data compared to Model 7 and Model 8. Factor loadings for Model 6 were statistically significant for both samples, with values ranging from .463 to .898. Item variances attributable to the six latent factors ranged from 21.4% to 80.7%. However, the variances of the mental distance item BAMD3, emotional impairment item BAEI3, psychological complaints items BAPs1 and BAPs5, and psychosomatic complaint items BASo2, BASo3, BASo4, and BASo5 in both samples were less than 50%. In both samples, the six latent factors showed strong positive correlations.
Step 6 – Reliability Analysis
Internal Consistency Tests
The coefficients ordinal α (Zumbo et al., 2007), ω (McDonald, 1970), and H (Hancock & Mueller, 2001) were calculated for each factor of the BAT subscales to assess reliability. The integration of these three indicators provides a more comprehensive evaluation of the reliability of the variables under investigation, concurrently enabling the consideration of specific scale attributes, such as the ordinal nature of the 5-point Likert scale used for the scoring of the BAT. Table 5 shows the results of the three samples (Samples 1, 2, and 3). All the calculated coefficients are above 0.700, indicating that measured reliability is, at least, satisfactory (Nunnally & Bernstein, 1994).
Reliability Coefficients.
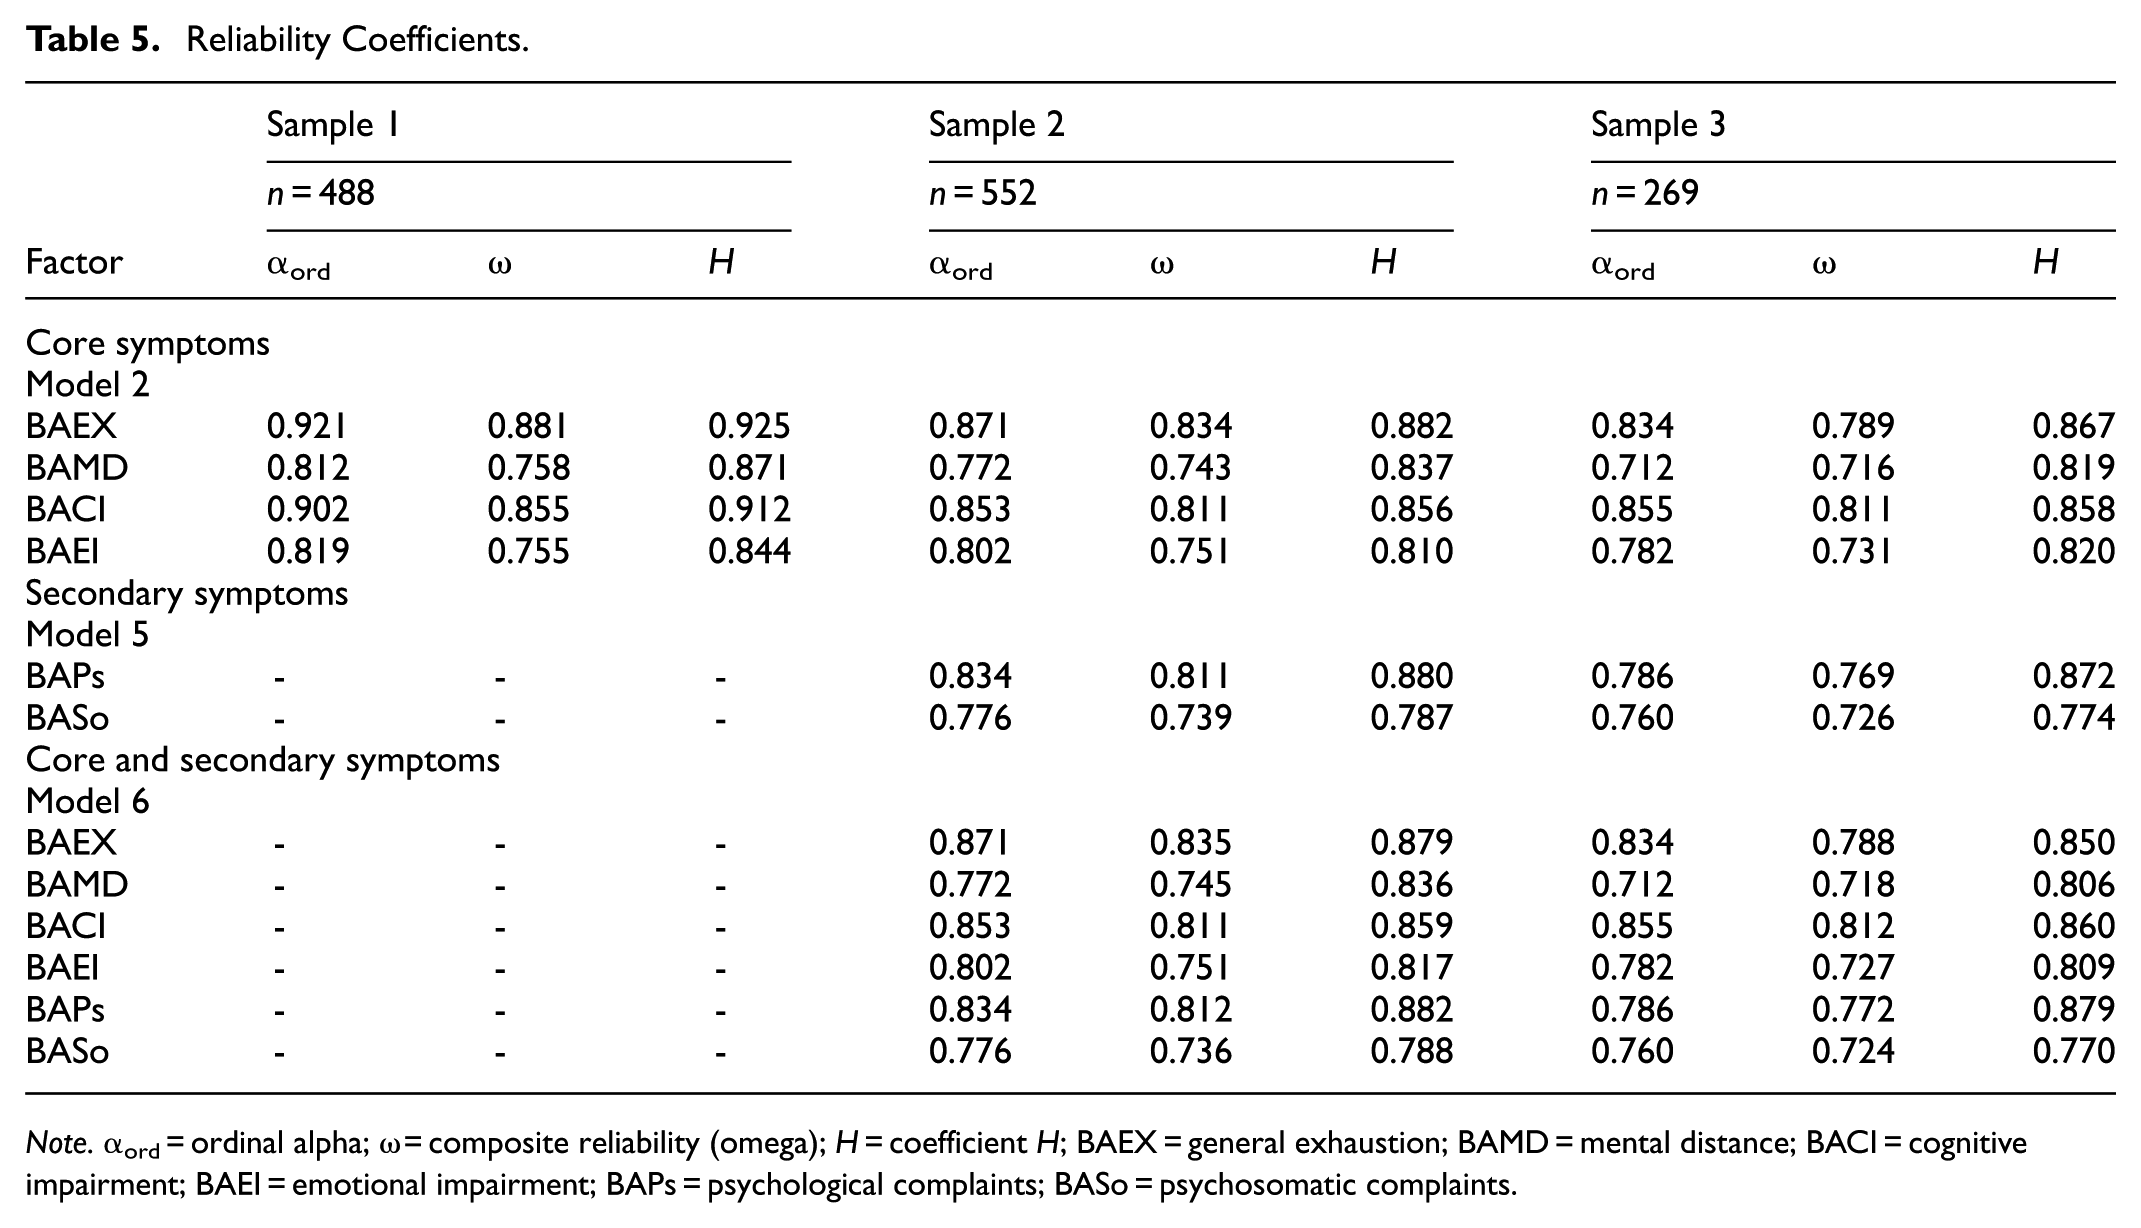
Note.αord = ordinal alpha; ω = composite reliability (omega); H = coefficient H; BAEX = general exhaustion; BAMD = mental distance; BACI = cognitive impairment; BAEI = emotional impairment; BAPs = psychological complaints; BASo = psychosomatic complaints.
Test-retest
A time interval of 5 months separates the data collection for sample 2 from that of sample 3. Sample 4 consists of participants who completed the questionnaire both samples 2 and 3. Sample 4 provides insight into the temporal stability of French-Canadian teachers in New Brunswick during both measurement periods (spring 2022 and fall 2022). The correlation between mental distance scores was moderate. In contrast, scores of general exhaustion, cognitive impairment, emotional impairment, core symptoms, psychological complaints, psychosomatic complaints, and secondary symptoms were highly correlated. In addition, the stability coefficient of the secondary symptoms was higher than its subscales and the core symptoms, including its subscales. Details of all correlations are summarized in Table 6.
Spearman’s Correlation for the Test-Retest Temporal Stability of the BAT Factors (Sample 4, n = 90).
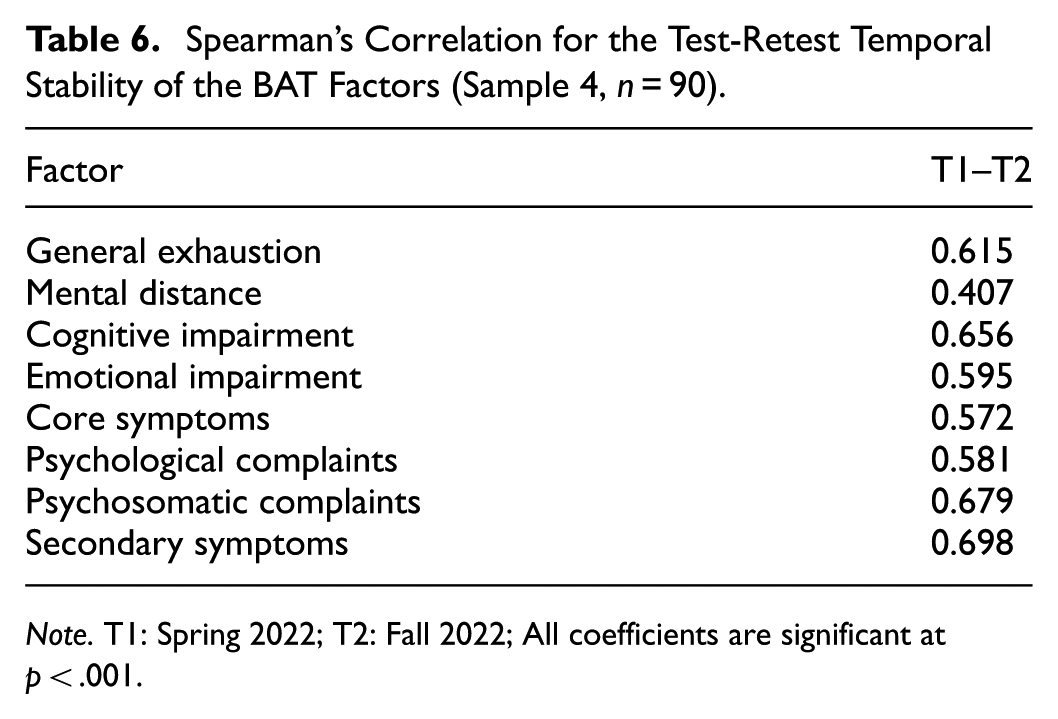
Note. T1: Spring 2022; T2: Fall 2022; All coefficients are significant at p < .001.
Step 7: Criterion-Related Validity
Analyses
Criterion-related validity was tested by calculating Spearman’s rho (rs) between the BAT factors and the CBI, FS, and SWLS measures. For the convergent validity, we studied the expected patterns between the BAT (C-S) and the CBI (Kristensen et al., 2005), as they are both designed to assess burnout. Given the widespread use of the CBI in educational settings and its cost-free availability, the BAT represents a symptom-based alternative to the CBI, particularly when compared to tools such as the MBI-ES. As for divergent validity, we calculated Spearman’s rho (rs) between the BAT factors and two measures related to well-being: flourishing, measured by the unidimensional Flourishing scale (FS; E. Diener et al., 2010), and the classic unidimensional Satisfaction with Life Scale (SWLS; E. D. Diener et al., 1985).
Results
Convergent Validity
BAT factors were moderately to strongly related to CBI measures (Sample 2 – teachers: .437 ≤ rs ≤ .824; principals: .400 ≤ rs ≤ .815). The strongest correlation is observed between personal burnout (CBI-TPB/CBI-PPB) and general exhaustion (BAEX) among teachers and principals. However, no significant correlations were observed between CBI-PSSRB and BACI, CBI-PWRB and BAEI, CBI-PSSRB and BAEI, and CBI-P and BAEI.
Divergent Validity
Correlations between BAT factors and FS were negative from weak to strong (Sample 2: .328 ≤ |rs| ≤ .504; Sample 3: .289 ≤ |rs| ≤ .469). In both sample sets, a consistent pattern emerges: The strongest correlations are observed between mental distance (BAMD) and FS, as well as emotional impairment (BAEI) and FS, while correlations with psychosomatic complaints (BASo) are relatively weaker. Finally, BAT factors were moderately to strongly negatively related to SWLS (Sample 2: .389 ≤ |rs| ≤ .616; Sample 3: .357 ≤ |rs| ≤ .642). In both samples, the highest correlations are observed between SWLS and mental distance (BAMD) as well as SWLS and general exhaustion (BAEX). Comprehensive correlation details are provided in Table 7.
Spearman’s Correlation Matrix of the BAT-C, BAT-S, CBI, FS and SWLS Factors.

Note. BAEX = general exhaustion; BAMD = mental distance; BACI = cognitive impairment; BAEI = emotional impairment; BAT-C = core symptoms; BAPs = psychological complaints; BASo = psychosomatic complaints; BAT-S = secondary symptoms; CBI = Copenhagen Burnout Inventory; CBI-TPB = teacher personal burnout; CBI-TWRB = teacher work-related burnout; CBI-TSRB = teacher student-related burnout; CBI-T = teacher general burnout; CBI-PPB = principal personal burnout; CBI-PWRB = principal work-related burnout; CBI-PSSRB = principal school staff-related burnout; CBI-P = principal general burnout; FS = Flourish; SWLS = Satisfaction with Life Scale; Lower diagonal indicates correlations from Sample 2; Upper diagonal indicates correlations from Sample 3.
p < .05. **p < .01. ***p < .001.
Step 8: Norm Analysis
Analyses
The eighth step, according to Lauzier et al. (2023), involves establishing norms. Since we cannot rely on our samples to replicate the original study, we report the means of the BAT-C and BAT-S of French-Canadian teachers, which included both the general population and a population diagnosed with burnout. Based on the guidelines provided by Schaufeli et al. (2020b), the study of burnout symptoms involves either (i) testing the cut-off scores using a sample of Dutch employees (BAT-C [12 items]), or (ii) segmenting the population according to specific key percentiles. While Schaufeli et al. (2020b) suggest using only one of these approaches, we chose to implement both. To achieve this, we initially computed the average score for the BAT factors across Sample 1, Sample 2, and Sample 3, which can be compared to those of Dutch employees. We then divided the results into percentiles, following Schaufeli et al.’s (2020b) instructions. These percentiles categorize the population into four groups: low (under the 25th percentile), average (50th percentile), high (75th percentile and above), and very high (top 5% [95th percentile]). To analyze the differences among the three samples in relation to BAT-C, we computed measures of central tendency and standard deviation to assess data dispersion. Considering that our data is ordinal, we conducted a Kruskal-Wallis test to compare Sample 1, Sample 2 (McKight & Najab, 2010a), and Sample 3 and performed a Dwass, Steel, Critchlow, and Fligner pairwise comparison (Douglas & Michael, 1991). For the same reasons, we applied a Mann-Whitney U test to compare Samples 2 and 3 with regard to BAT-S (McKnight & Najab, 2010b).
Results
The BAT scores range from 1 to 5, with responses measured on a 5-point Likert scale (ranging from “never” to “always”). A higher average score indicates a less favorable outcome for the individual (Schaufeli et al., 2020b). Table 8 presents the results of Sample 1, Sample 2, and Sample 3, the measures of central tendency and the standard deviation. We also added the reference population (Dutch workforce) proposed by Schaufeli et al. (2020b, 2020c) to have a point of comparison. As stated by Schaufeli et al. (2020b, p. 103), this reference population allows us to say: “This group (or person) has a high (or low) level of burnout compared to the average Flemish (or Dutch) employee.”
The Average Scores on the Factors of the BAT Across Four Samples: Dutch Employees (DE), Sample 1 (S1), Sample 2 (S2), and Sample 3 (S3).

Note. According to Schaufeli et al. (2020b), the percentiles can be categorized into four groups: low (under the 25th percentile), average (50th percentile), high (75th percentile and higher), very high (top fifth percentile). The data for Dutch employees (DE; in gray) are sourced from Schaufeli et al. (2020b, pp. 111, 117) and Schaufeli et al. (2020c, pp. 15–16). The scores related to secondary symptoms (BAT-S) are calculated based on the statistical norms suggested for the BAT-23, as there is no abbreviated version of the questionnaire available for the BAT-S.
As indicated by the results of the Kruskal-Wallis test, there is a slightly statistically significant difference in the distribution of Sample 1, Sample 2, and Sample 3 on BATEX (χ2[2] = 83,480, p < .001, ε2 = 0.060), BATMD (χ2[2] = 60,940, p < .001, ε2 = 0.050), BATCI (χ2[2] = 41,090, p < .001, ε2 = 0.030), BATEI (χ2[2] = 41,090, p < .001, ε2 = 0.030), and BAT-C (χ2[2] = 78,990, p < .001, ε2 = 0.060). The Dwass, Steel, Critchlow, and Fligner pairwise comparison highlights the only non-significant difference between the two groups, which is between Sample 2 and 3 on BATMD (p < .083). The Mann-Whitney U test indicates a significant difference between Sample 2 and 3 (U = 65,662.000, p < .007) on BAT-S, with a small effect (r = .120).
Discussion
The aim of the study was to assess the factor structure and the psychometric properties of the short version of the BAT among French-Canadian teachers through a transcultural validation procedure embedded in a multi-sample study. We conducted BAT testing across four samples to ensure the adoption of a robust and accessible tool for government use, the scientific community, applied organizational psychologists, and schools.
The Factor Structure of the French-Canadian Version of the BAT
BAT-C
For the BAT-C, our results support both the four-factor structure (confirmed by EFAs and CFAs) and the second-order model (confirmed by CFAs), consistent with the theoretical framework of burnout (Schaufeli et al., 2020a). The four-factor model, comprising exhaustion, mental distance, cognitive impairment, and emotional impairment, was replicated across Samples 1, 2, and 3, which include teachers from Quebec and New Brunswick. These results indicate that individual scores on each BAT-C dimension, as well as the overall composite score, can be used to assess burnout levels among French-speaking teachers in these provinces. The second-order model, reflecting burnout as a syndrome, was also confirmed in all three samples. Burnout may thus be conceptualized as a syndrome encompassing exhaustion, mental distance, cognitive impairment, and emotional impairment. The BAT-C composite score can serve as an indicator of overall burnout severity, while also allowing for the assessment of specific symptom dimensions among French-speaking teachers in Quebec and New Brunswick.
BAT-S
Our results demonstrate a clear distinction between the psychological complaints and the psychosomatic complaints (supported by the EFAs and the CFAs), both considered secondary symptoms and measured by the BAT-S. The covariances between the two factors are high, supporting a second-order model (Brown, 2015). Therefore, a composite score for the BAT-S can be calculated. These findings are consistent with a previous study by Schaufeli et al. (2020a).
However, it is worth noting that EFAs for Sample 2 indicated that all items displayed loadings on their respective factors, except for BAPs5 and BASo1. To the contrary, for Sample 3, BASo1 and BASo5 loaded on an unexpected factor. We also had to reject BAPs1 and BAPs5 because of their loadings. While some items did not load on their respective factors, and others were excluded during the EFAs, it’s important to note that these discrepancies were not observed in the CFAs. Although, in both Sample 2 and Sample 3, the CFAs indicated that items BAPs1, BAPs5, BASo2, BASo3, BAS4, and BASo5 accounted for less than 50% of the variances. The BAT-S comprises symptoms that are not exclusive to a state of professional burnout but may still be associated with it (Schaufeli et al., 2020b). This explanation can serve as a hypothesis for understanding these findings. For instance, item BAPs5 refers to “Noise and crowds disturb me,” BASo1 to “I suffer from palpitations or chest pain,” and BASo5 to “I often get sick.”
The items generally loaded as expected on their respective dimensions in the studied samples, supporting the proposed factorial structure of the BAT. However, a few exceptions were noted. Some items related to psychosomatic complaints showed weaker or cross-loadings on psychological complaints, particularly in the second and third samples. Two items were excluded from the final model due to insufficient loading strength (BAPs1 and BAPs5). These minor deviations do not compromise the overall structure, but they do suggest the need for further examination of how certain symptoms are perceived or expressed in the teaching population. These discrepancies between EFAs and CFAs may reflect cultural or contextual differences in how psychological and psychosomatic complaints are perceived by Canadian French-speaking teachers. The inconsistent loadings of items such as BAPs1 and BAPs5, despite acceptable model fit at the global level, suggest that further refinement of these items may be needed to enhance construct validity. These findings highlight the relevance of pursuing additional validation efforts and potentially include qualitative methods to better understand how these symptoms are interpreted in this context. Additional studies involving samples of employees working in sectors other than education could also be conducted.
The Combination of BAT-C and BAT-S
While all the models were deemed satisfactory based on the results of the CFAs, the six-factor model encompassing exhaustion, mental distance, cognitive impairment, emotional impairment, psychological complaints, and psychosomatic complaints, displayed better indices. Except the correlation between psychosomatic complaints and exhaustion in Sample 3, the BAT-S factors demonstrated stronger intercorrelations compared to their correlations with the BAT-C factors. These findings show minor discrepancies when compared to the findings in the study by Schaufeli et al.’s (2020a) study. However, they align with the notion that “an investigation into the latent correlations within the six-factor model reveals that the fundamental dimensions exhibit stronger associations with each other than with the secondary dimensions, except for the correlation between exhaustion and distress complaints” (Schaufeli et al., 2020a, p. 14).
Reliability Analysis
To assess the reliability analysis, we calculated the coefficients ordinal αord (Zumbo et al., 2007), ω (McDonald, 1970), and H (Hancock & Mueller, 2001) for each factor of the BAT subscales, in line with the confirmed factor structure. The results were consistent with those reported in prior studies on the original BAT (Schaufeli et al., 2020a) and in multiple transcultural validations, confirming the sound psychometric properties of the tool. For example, De Beer et al. (2020) examined the reliability of the full BAT in several countries, including the Netherlands, Belgium, Germany, Austria, Ireland, Finland, and Japan, and found evidence supporting its robustness across diverse contexts. Similarly, Sinval et al. (2022) and Oprea et al. (2021) documented the reliability of the short version (BAT-C) in Brazil, Portugal, and Romania, respectively. Research focusing specifically on teachers has also yielded comparable findings. Notably, Angelini et al. (2021) provided support for the reliability of the Italian version among educators, using both the BAT-C and the BAT-S. Altogether, these studies reinforce the reliability of the BAT, both in its full and short forms, across cultural settings and occupational groups.
According to P. Kline (2000), a high level of correlation (>.800) between two measurement points is typically required to demonstrate temporal stability in test-retest procedures. Others suggest more flexible reference scores, such as Little (1999 as cited in R. B. Kline, 2015), who proposed that values around 0.90 are typically regarded as “excellent,” values around 0.80 as “very good,” and values around 0.70 considered “adequate.” However, the results of the test-retest conducted on Sample 4 did not meet commonly accepted thresholds, suggesting limited temporal stability for the BAT and its subcomponents in this instance. Although the importance of assessing this property is widely acknowledged (e.g., De Beer et al., 2020, 2022; Mazzetti et al., 2022), only a few validation studies have reported test-retest data for the BAT. For instance, Sakakibara et al. (2020) assessed temporal stability based on established criteria for work performance measures (Sturman et al., 2005) and obtained acceptable outcomes. Similarly, the original validation by Schaufeli et al. (2020a) supports the test’s temporal stability. Nevertheless, given the variability observed in our data, further research using larger and more diverse samples appears warranted to draw firmer conclusions about this psychometric property.
Criterion-Related Validity
Criterion-related validity was examined through Spearman’s rho correlations between the BAT, the CBI, and two well-being measures: the Flourishing Scale (FS; E. Diener et al., 2010) and the Satisfaction with Life Scale (SWLS; E. D. Diener et al., 1985), and adapted to the work context. Moderate to strong associations were observed between BAT factors and the CBI, particularly between “personal burnout” (CBI) and “general exhaustion” (BAT-C), where item-level proximity may have contributed to higher correlations (e.g., How often are you physically exhausted? [CBI]; At work, I feel physically exhausted [BAT]).
However, several correlations were not statistically significant, especially between CBI subscales specific to principals (e.g., school staff-related and work-related burnout) and certain BAT dimensions such as cognitive or emotional impairment. These discrepancies may be partly explained by the small sample size for principals (n = 29 and n = 10 in Samples 2 and 3, respectively), but they could also reflect deeper conceptual differences between the instruments. The CBI adopts an attributional approach, focusing on burnout sources, while the BAT measures symptomatic manifestations of burnout. The weak or non-significant associations in some cases may suggest that attribution-based perceptions of burnout (e.g., being burned out by staff or students) are not always aligned with self-reported symptoms like emotional or cognitive exhaustion. This highlights the importance of considering both perspectives when assessing burnout in educational settings and suggests avenues for further research and refinement of the tools when used with school leadership population.
As for the divergent validity, correlations between BAT factors and FS (E. Diener et al., 2010) were negative, varying from weak to strong. Some studies have drawn connections between flourishing and burnout measures, including Freire et al. (2020) and Redelinghuys et al. (2019). For instance, when Freire et al. (2020) used the MBI in conjunction with the FS, they noted that certain aspects of flourishing were more strongly associated with burnout factors (e.g., emotional exhaustion and depersonalization). Across Sample 2 and Sample 3, a consistent trend can be observed: The most robust correlations are found between mental distance (BAMD) and FS, as well as emotional impairment (BAEI) and FS, whereas correlations with psychosomatic complaints (BASo) are comparatively weaker. Thus, the variations in these relationships may align with these findings and confirm the anticipated patterns with FS.
Several studies have explored a correlation between life satisfaction measured in school settings and burnout (e.g., Aydoğmuş & Serçe, 2021; Buonomo et al., 2022; Mijakoski et al., 2022; Padmanabhanunni & Pretorius, 2023; Parrello et al., 2019; Skaalvik & Skaalvik, 2014). While some distinctions are occasionally noted based on factors related to satisfaction or burnout (e.g., the absence of a relationship between depersonalization [MBI] and life satisfaction; Padmanabhanunni & Pretorius, 2023), generally, a negative correlation is observed between burnout and life satisfaction. In this study, BAT factors were moderately to strongly negatively related to SWLS (E. D. Diener et al., 1985). In Samples 2 and 3, the strongest correlations were found between SWLS and mental distance (BAMD), as well as SWLS and overall exhaustion (BAEX).
Norm Analysis
The BAT was designed for practitioners, and while it does not serve as a diagnostic tool, the different scales provide some guidance to help understand the situation of the studied individuals and groups. As mentioned before, in the user manual, Schaufeli et al. (2020b) propose two ways to understand the BAT results: “the average score(s) […] can be interpreted in two different ways, either using statistical norms or clinical cut-off scores” (p. 12). The statistical norms were established by comparing the results with “general” populations (e.g., Dutch workforce). Four categories are detailed: low (25% lowest scoring employees), average, high (25% highest scoring employees), and very high (top 5% scoring employees; Schaufeli et al., 2020b). This comparative population enables us to determine whether a particular group or individual exhibits a burnout level that is either elevated or lower in contrast to the typical Flemish (or Dutch) employee (Schaufeli et al., 2020b).
In Table 8, presented in the Results section, the scores for Samples 1, 2, and 3 are noticably higher than what is associated with “low” (below the 25th percentile) in the Dutch employees results. For other reference percentiles, the scores generally fall within the brackets of expected values. The difference between the scores obtained by the Dutch and the French-Canadian samples on the factor BAEX is especially interesting. Indeed, the means are higher among teachers, for the 25th, 50th, and 75th percentile (Sample 2 and 3). The BAEX refers to exhaustion or “a severe loss of energy that results in feelings of both physical (tiredness, feeling weak) and mental (feeling drained and worn-out) exhaustion” (Schaufeli et al., 2020b, p. 27), and this can align with the numerous studies that highlight the prevalence of burnout symptoms in the teaching population (e.g., Kariou et al., 2021; Mijakoski et al., 2022). Notably, the year during which the data were collected (spring and fall 2022) was still impacted by the COVID-19 pandemic, which may have led to a higher perception of burnout symptoms (Ozamiz-Etxebarria et al., 2021). As seen, a difference between the scores of Samples 2 and 3 can be observed. The period of the year, in addition to the COVID-19-related context may have had an impact on these results.
Regarding clinical cut-off scores, the average BAT score can be compared with the scores of populations that have been diagnosed with burnout (Schaufeli et al., 2020a, 2020b) and severe cases of this syndrome (Schaufeli et al., 2023). We compared the means of our samples with those of general Flemish employees (Schaufeli et al., 2020b), who served as a benchmark (BAT-C [12 items] and BAT-S). Table 9 presents the cut-off values for Flemish employees (Schaufeli et al., 2020b, p. 17) and Table 10 reports the averages of Sample 1, 2, and 3.
Cut-off Values Based on Flemish Employees.

Note. These data are sourced from Schaufeli et al. (2020b, pp. 17–18). The scores associated with secondary symptoms are derived from the cut-off values proposed for the BAT-23, as there is no abbreviated version of the questionnaire for the BAT-S. BAEX = exhaustion; BAMD = mental distance; BACI = cognitive impairment; BAEI = emotional impairment; BAT-C = core symptoms; BAT-S = secondary symptoms.
Average Scores for Sample 1 (S1) Sample 2 (S2), and Sample 3 (S3), Grouped According to BAT Factors.

Note. BAEX = exhaustion; BAMD = mental distance; BACI = cognitive impairment; BAEI = emotional impairment; BAT-C = core symptoms; BAT-S = secondary symptoms.
It is possible to highlight two particularly concerning factors among Sample 2 and, mostly, Sample 3: exhaustion, once again, and mental distance, defined as the action of “psychologically distancing oneself from the work as indicated by a strong reluctance or aversion to work” (Schaufeli et al., 2020b, p. 27). These aspects could be further explored in subsequent research conducted in a context outside of the pandemic and that considers other aspects of the teaching profession. Furthermore, the indices are noticeably lower for the teaching population with respect to the BAEI. This avenue is intriguing, given that a substantial body of literature focuses on the emotional regulation of teachers (see Wang et al., 2019 for a systematic review). It might be worthwhile to examine this path and explore whether the emotional regulation ability of teachers could have a protective effect.
Limits of the Study and Future Research
This study has certain limitations that can inform future research. First, data collection for all three samples took place during the spring and fall of 2022, a period marked by significant disruptions caused by the COVID-19 crisis. This context could have primarily impacted certain phases of transcultural validation, particularly in terms of the norm analysis. Future research should explore these findings during more stable periods. Second, we adapted the BAT-C and BAT-S from the available French and Belgian versions on the online BAT platform, and we administered BAT to two French-Canadian populations (from two separate provinces, Quebec and New Brunswick). However, given the linguistic diversity within and between French-Canadian communities, further adjustments may be needed if applying these versions to different French-Canadian groups. Third, we lacked the necessary data to complete the validation process of BAT-S with Quebec teachers (Sample 1). This research gap underscores the importance of conducting a study to accumulate more evidence related to its validity. Fourth, regarding the test-retest, we included the results of our analysis, even though the sample size was limited. In light of our study and other transcultural validations (e.g., De Beer et al., 2020, 2022; Mazzetti et al., 2022), it would be important to insist on the test-retest process, as only a limited number of results are currently available. Fifth, the convergent and divergent validity we calculated was correlational. Therefore, it would be valuable for future research to employ a predictive design to ascertain the causal relationships between BAT, its antecedents, and its outcomes. Finally, sixth, we administered the BAT to teachers (and to some extent, some principals) to gain a general and descriptive perspective on their condition. We targeted the general population and were unaware of whether any of them had a burnout diagnosis. In this case, it would be valuable to conduct studies among teachers with confirmed burnout syndrome to make more comprehensive comparisons between populations.
Conclusion
This study contributes to the validation of the BAT-C (short version) and the BAT-S among French-Canadian teachers. Based on four samples (total N = 1,309) and the recommended eight-step procedure outlined by Lauzier et al. (2023) to perform a transcultural validation, our results support the robustness of the BAT. The BAT offers a theoretically grounded, multidimensional, and freely accessible alternative to more traditional instruments such as the MBI, whose use remains widespread despite certain conceptual and practical limitations. By providing a validated instrument adapted to the French-Canadian educational context, our study supports the international comparability of findings and enhances the potential for evidence-informed interventions. Its accessibility also makes this tool even more interesting for decision-makers, professional associations, educational personnel, and the scientific community. This study also highlights the significance of examining burnout symptoms among teachers, as the repercussions are substantial not only for the individual but also for the entire educational community (Harding et al., 2019; Kariou et al., 2021; Mijakoski et al., 2022).
Statement: During the preparation of this work the authors used ChatGPT 3.5 in order to review language quality (e.g., spellcheck, grammar). Example of prompt we used: “Can you check the quality of the language to ensure it matches academic English?.” It was double-checked by a professional translator. After using this tool/service, the authors reviewed and edited the content as needed and take full responsibility for the content of the publication.
As a francophone writing in a second language, it is sometimes difficult to identify Frenchisms, etc. We used ChatGPT’s revision for certain parts of the text, but not for the entire document, hence the need to consult a translator. Moreover, I was not entirely convinced of the quality of the language and wanted to have external validation as it was the first time I used ChatGPT for revision. Sending a first version already in English to the translator allowed the authors to significantly reduce costs, which is not negligible for a new professor in a small university. It also reduces production time since translation is a process that can take several weeks. Although ChatGPT is a generative AI, I reasoned that Antidote and Grammarly are also now associated with artificial intelligence, so I didn’t see much of a difference according to how I used it.
Supplemental Material
sj-docx-1-sgo-10.1177_21582440251379632 – Supplemental material for French-Canadian Validation of the Burnout Assessment Tool Among Teachers: Results and Perspectives
Supplemental material, sj-docx-1-sgo-10.1177_21582440251379632 for French-Canadian Validation of the Burnout Assessment Tool Among Teachers: Results and Perspectives by Caterina Mamprin, Mouhamadou Thiam, Louise Clément and Caterina Fiorilli in SAGE Open
Footnotes
Author Contributions
Caterina Mamprin : Conceptualization, Investigation, Formal analysis, Writing - Original Draft, Writing - Review & Editing, Supervision. Mouhamadou Thiam: Writing - Original Draft, Writing - Review & Editing, Formal analysis. Louise Clément: Conceptualization, Investigation, Writing - Review & Editing, Supervision. Caterina Fiorilli: Writing - Review & Editing.
Funding
The authors disclosed receipt of the following financial support for the research, authorship, and/or publication of this article: This article was prepared with the financial support of the Social Sciences and Humanities Research Council awarded to the first author [892-2021-3057] and third author [892-2020-1014]. Corresponding author: Caterina Mamprin, caterina.mamprin@umontreal.ca
Declaration of Conflicting Interests
The authors declared no potential conflicts of interest with respect to the research, authorship, and/or publication of this article.
Data Availability Statement
The data reported in this study were collected in accordance with the ethical principles of human research of the Université de Moncton [affiliation of 1st author when the data was collected, file # 2122-063] and the Université Laval [file # 2022-196] as per their respective protocols. The responses analyzed in this article are from participants who provided written informed consent for the use of the data they submitted, including for scientific publication purposes. However, our protocol does not include the authorization to share the dataset. We have no conflicts of interest to disclose.
Supplemental Material
Supplemental material for this article is available online.
References
Supplementary Material
Please find the following supplemental material available below.
For Open Access articles published under a Creative Commons License, all supplemental material carries the same license as the article it is associated with.
For non-Open Access articles published, all supplemental material carries a non-exclusive license, and permission requests for re-use of supplemental material or any part of supplemental material shall be sent directly to the copyright owner as specified in the copyright notice associated with the article.