
Abstract
In Ghana and many African countries, demand for non-life insurance remains strikingly low, even in South Africa, which dominates the continent’s insurance market. This is particularly perplexing given that many non-life insurance products, such as motor insurance, are legally mandated. This study aims to investigate the determinants of non-life insurance demand in Ghana. It utilizes a robust set of regularization methods—specifically Ridge, Least Absolute Shrinkage and Selection Operator (LASSO), and Elastic net—moving beyond traditional least squares and conventional dimension reduction techniques. The study uses data that span from 1995 to 2022. The findings indicate that the two most important determinants of non-life insurance demand in Ghana are income and economic freedom driven by government expenditure. Furthermore, the study reveals that the most parsimonious model produced by the LASSO algorithm is the most reliable. Based on these insights, we recommend that the government implement economic policies that promote job creation, wage growth, and entrepreneurship to enhance disposable income. Additionally, increasing expenditure on public goods and services—such as roads, utilities, healthcare, education, security, and social intervention programs—would alleviate financial burdens on individuals and businesses, making insurance more affordable and attractive.
Plain language summary
In Ghana and many African countries, the demand for non-life insurance is very low, even in South Africa, which has the largest insurance market on the continent. This is surprising, especially since many non-life insurance products, like motor insurance, are required by law. This study looks at the factors that affect non-life insurance demand in Ghana, using advanced methods to analyze the data from 1995 to 2022. The results show that income and government spending are the most important factors influencing demand. The study found that the LASSO model was the most effective in predicting demand. Based on these findings, we suggest that the government should implement policies that create jobs, increase wages, and support entrepreneurship to boost disposable income. Additionally, increasing spending on public services—like roads, utilities, healthcare, education, and security—can help reduce financial pressures on individuals and businesses, making insurance more affordable and appealing.
Introduction
Non-life insurance is crucial for mitigating the financial impact of unforeseen events on individuals, businesses, and societies. By transferring the financial burden of potential losses to insurance companies, people and organizations can safeguard themselves against a range of threats, including natural disasters, accidents, theft, and liability claims. Beyond individual risk management, non-life insurance contributes to broader economic stability and resilience. By spreading risk across a large pool of policyholders and diversifying exposures, insurance companies help manage systemic risks that could otherwise have severe economic repercussions. In developing countries (such as Ghana), where vulnerability to economic shocks and natural disasters can be pronounced, the role of non-life insurance is increasingly critical in enhancing resilience and fostering sustainable development. According to the insurance market can impact economic growth by facilitating risk pooling, serving as a financial intermediary, providing compensation for losses, mobilizing savings, and creating investment opportunities. In recent decades, there has been growing interest in understanding the contribution of the insurance sector to Africa’s economic development. Using panel data for 11 African countries between 1995 and 2016, the authors find significant evidence in support of such a relationship.
Recognizing the essential role of insurance in the lives of individuals, businesses, and nations, governments pay close attention to the development, promotion, support, and regulation of their insurance industries. Ghana, a West African nation with a population of approximately 33 million, is no exception. Despite its importance, non-life insurance penetration in African economies remains relatively low compared to the advanced economies. As of 2022, the non-life insurance penetration in Ghana for instance was about 1.1%. Non-life insurance patronage is low not only in Ghana, but most other African countries. Even South Africa which has the most developed insurance industry in Africa, has a relatively lower insurance demand for non-life insurance compared to life insurance. According to Bagus et al. (2020), South Africa is the largest and most established insurance market in Africa, and accounts for 70% of the total premiums of the continent. However, according to Toesland (2021), non-life insurance comprises only 20% of the South African insurance sector. According to KPMG (2015) South Africa is closer to advanced economies in terms of life insurance and well behind in terms of non-life insurance.
Having acknowledged the fact that low demand for non-life insurance is a common challenge in Africa, we wish to focus our attention on the Ghanaian situation. Toesland (2021) agrees that “Ghana may not be the biggest insurance market on the continent but its current situation is largely underdeveloped” (https://newafricanmagazine.com/27373/). We believe that understanding the determinants of non-life insurance demand and identifying strategies to increase its adoption are essential tasks for policymakers, insurers, and researchers.
In Ghana, the National Insurance Commission (NIC) was established to ensure the insurance sector’s effective administration, supervision, regulation, and control. The NIC has worked diligently to invigorate the industry, resulting in consistent year-on-year growth. Between 2010 and 2022 for instance, life insurance premiums have experienced a minimum growth of 21.51% and a maximum growth of 44.39%, with geometric average growth of 26.21% annually. Non-life insurance premiums have experienced a minimum growth of 13.84% and a maximum growth of 38.27%, with a geometric average growth of 22.49% annually (Table 1).
Gross Insurance Premium for the Period 2010 to 2021.
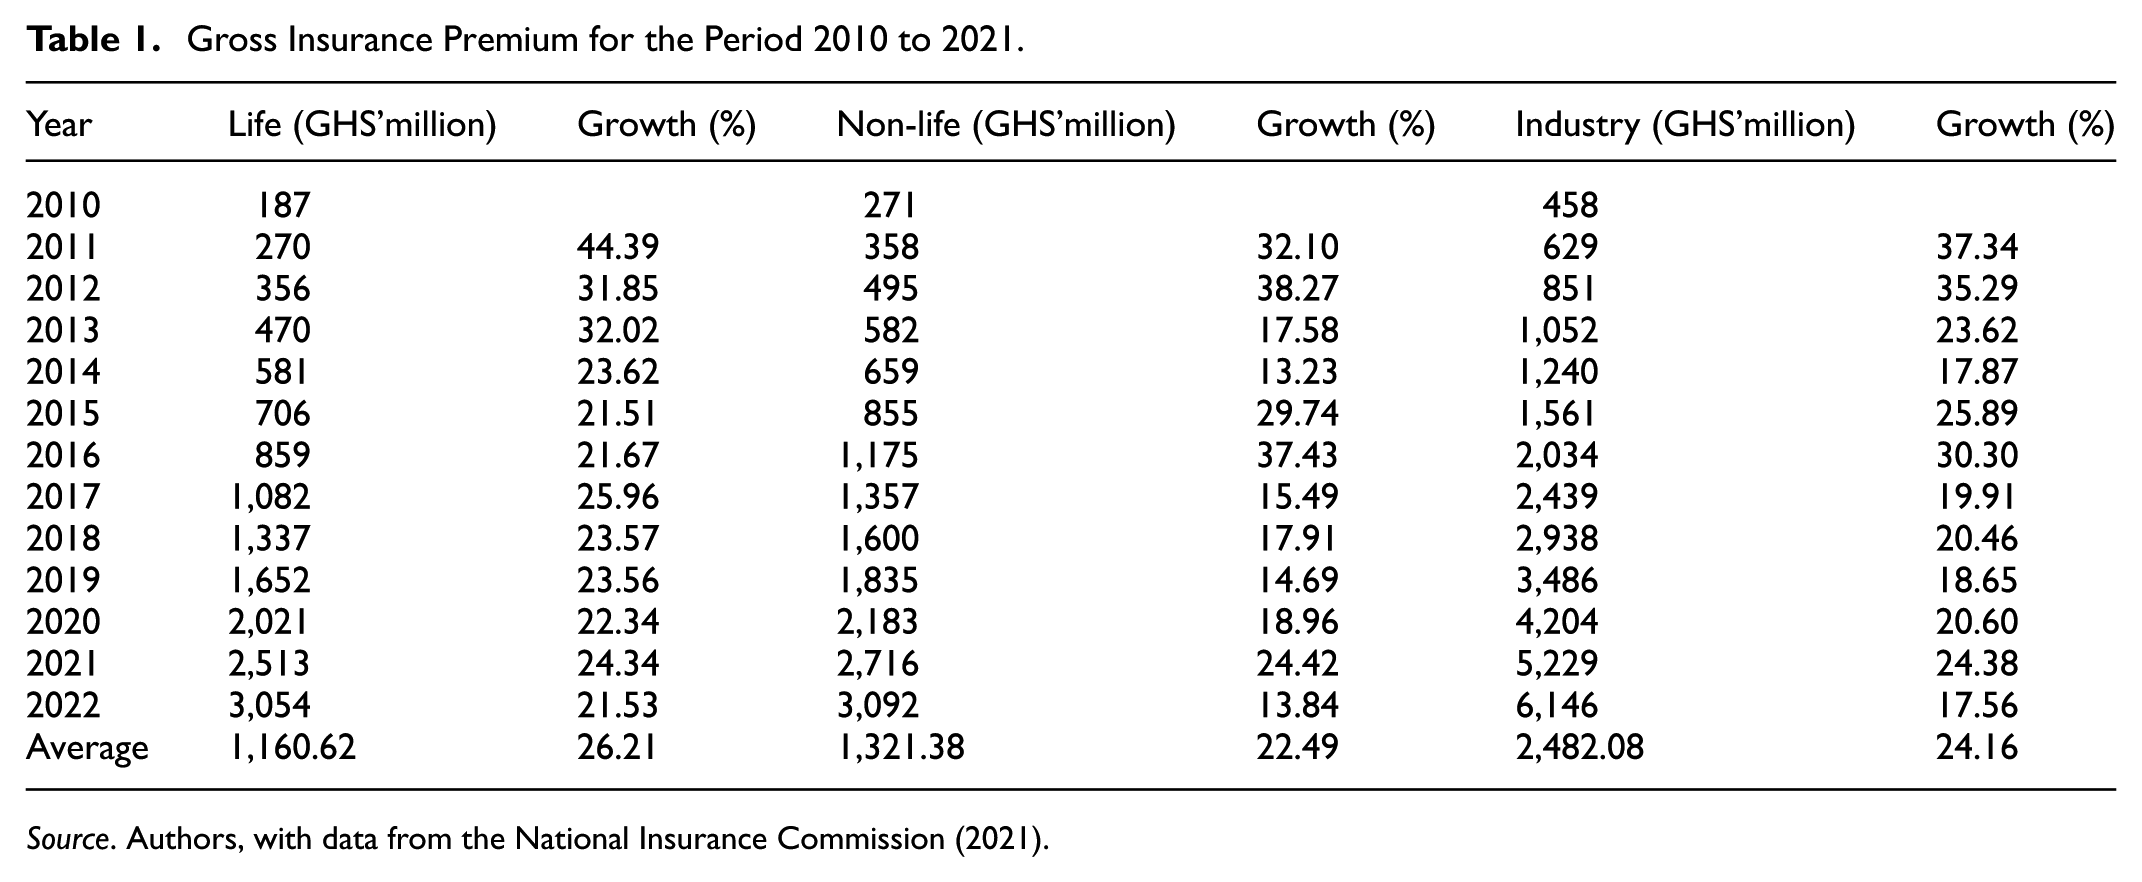
Source. Authors, with data from the National Insurance Commission (2021).
It can be seen from Table 1 that the geometric average growth rate of non-life insurance lags behind that of life insurance (even though the arithmetic average of non-life insurance premiums is higher than that of life insurance (GHS 1,321.38 million vs. GHS 1,160.62 million; the exchange rate is about GHS 15 to USD 1). Because the low insurance penetration of Ghana leaves room for potential insurance growth, it is expected that the non-life insurance premium should grow at least at the same pace as the life insurance premium. Furthermore, some non-life insurance products (such as motor insurance) are mandatory, unlike life insurance which is generally voluntary. The mandatory nature of non-life insurance, coupled with the propensity to acquire properties by a generally young population in Ghana, should lead to an increase in non-life insurance premiums (or demand). The lower nature of non-life insurance growth means that, but for the fact that it is mandatory to buy motor insurance and other similar insurance, many Ghanaians would not have bought non-life insurance at all. In 2021 for instance, motor vehicle insurance, which is mandatory for vehicle owners, accounted for 43% of all non-life premiums, followed by fire, theft, and property insurance which constituted 22% (National Insurance Commission [NIC], 2021). Note that the latter set of insurance products is also mandatory in many instances, especially for corporate institutions. Another worrying aspect of the non-life insurance patronage is that, in terms of geographical distribution, 84.5% of the premium is generated in the Greater Accra Region (the region that hosts the capital city of Ghana) followed by the Ashanti Region (which also hosts the second largest city in Ghana) with 7%. This means that only 8.5% of the annual non-life insurance premiums come from the remaining 14 regions in Ghana. (There are 16 regions in Ghana.) It is not surprising that many studies have found urbanization to be a major determinant of non-life insurance demand (Dragos, 2014; Oteng et al., 2023). The low patronage of non-life insurance in many other parts of Ghana, outside the major capital cities, calls for a concern. The NIC is doing its best to enhance the development and patronage of insurance in Ghana, including the rural areas. For instance, it has supported the development of micro-insurance products for the informal sector with the hope that this will increase insurance penetration in the country (KPMG, 2015). Even though this seems to distribute insurance to the informal sector, the insurance penetration figures don’t look anything different from previously. It has always been around 1%. So, what are the factors affecting non-life insurance demand in Ghana?
It is therefore necessary to undertake an empirical study to find the economic, demographic, and institutional factors that affect the demand and development of non-life insurance in Ghana. Even though very few studies have been done on the determinants of insurance demand in Ghana, they don’t adopt the macroeconomic approach. They rather adopt the micro-economic, household-level approach (Oteng et al., 2023). Oteng et al. (2023) adopt the macroeconomic approach but they only consider the determinants of life insurance demand. This current study aims to address this gap by investigating the economic, demographic, and institutional determinants of non-life insurance demand in Ghana and examining their implications for insurance market development and economic growth.
In this study, we focus on Ghana as a case study to examine the drivers of non-life insurance demand and explore the potential implications for insurance market development in the African emerging economies. Ghana provides an intriguing context for studying insurance demand dynamics, given its growing economy, evolving regulatory environment, and increasing exposure to various risks, including climate change impacts and economic uncertainties. This current study seeks to search beyond the macroeconomic and demographic determinants, to include the institutional factors as well. We think there is a lack of comprehensive understanding regarding the economic, demographic, and institutional factors influencing non-life insurance demand in emerging African markets such as Ghana. Understanding these determinants is crucial for policymakers, insurers, and stakeholders seeking to promote insurance market development and economic stability.
Due to the multicollinear nature of variables and data used in the study of insurance determinants, this study uses a set of robust regularization algorithms, compared to the traditional least squared, and conventional feature selection regression methods used by previous studies. Those methods are not robust enough to handle the common problem of multicollinearity in the data used. Also, the regularization methods are suitable for the large number of predictors being examined, relative to the number of observations. Further, this study does a comparative analysis of the three major regularization methods (Ridge, Least Absolute Shrinkage, and Selection Operator or LASSO, and Elastic Net). The current study therefore seeks to make the following contributions to literature.
By incorporating institutional factors as determinants alongside economic and demographic factors, this study aims to provide a holistic understanding of the factors driving non-life insurance demand in Ghana (and similar African countries) and inform targeted interventions to promote insurance market development and financial inclusion in Ghana and similar markets within the African region.
Unlike previous studies on the determinants of non-life insurance demands which use traditional regression methods, this study utilizes and compares the three major regularization methods of regression for modeling the non-life insurance demand, leveraging their ability to handle high-dimensional data and multicollinear variables. This study is the first to use a regularization method to model the determinants of non-life insurance demand.
This study holds significant practical relevance for policymakers and insurers. For policymakers, understanding the key determinants of non-life insurance demand can guide the formulation of effective policies to deepen insurance penetration, reduce regional disparities, and enhance financial inclusion. For insurers, the findings can inform product design, distribution strategies, and market outreach, particularly in underserved areas, thereby fostering sustainable growth within the sector. By addressing the persistent gap in non-life insurance uptake, the study provides actionable insights that can shape interventions aimed at building a more resilient and inclusive insurance ecosystem in Ghana and similar economies.The study therefore seeks to provide evidence-based insights and policy recommendations for policymakers, insurers, and stakeholders interested in enhancing non-life insurance uptake, improving insurance market efficiency, and fostering economic resilience in Ghana and similar emerging market environments.
The rest of the article is organized as follows. Section 2 discusses literature, Section 3 discusses data and methodology, Section 4 discusses results and analyses, and Section 5 closes with conclusion and policy recommendation.
Literature Review
Insurance Demand (Insurance Density and Insurance Penetration)
This study models the determinants of non-life insurance demand. In the literature, insurance density and insurance penetration are commonly used as measures of insurance demand (Zhang & Zhu, 2005). However, despite their similarities, they capture slightly different aspects of the insurance market. Insurance density refers to the premium per capita, reflecting the average amount individuals spend on insurance. It primarily emphasizes insurance consumption or patronage at the individual level. Higher insurance density suggests greater adoption of insurance products by the population.
Insurance penetration, on the other hand, is measured as premium per GDP, indicating the extent to which the insurance sector contributes to the overall economy. It highlights the development and integration of the insurance industry within the broader economic landscape. While insurance density focuses on individual patronage, insurance penetration provides insight into the depth of the insurance sector relative to economic output (S. C. Park & Lemaire, 2012).
Despite these differences, prior studies suggest that the determinants of insurance density and insurance penetration are largely the same. This study employs both insurance density and insurance penetration as response variables to comprehensively assess insurance demand.
Determinants of Insurance Demand
As noted by Akhter and Khan (2017), reviews by Zietz (2003) and Hussels et al. (2005) provide summaries of factors that affect insurance demand and these can be classified into economic factors, legal and political factors, social or demographic factors, and institutional factors. Many other studies have also divided the determinants of insurance demand (and insurance development) into two broad categories of macroeconomic and demographic factors (Beck & Webb, 2003; Browne & Kim, 1993; Dragos, 2014). According to S. C. Park and Lemaire (2012), factors that have been shown to impact insurance demand are income, inflation, development of the banking sector (or financial development), institutional indicators (such as investor protection, contract enforcement, and political stability), education, old and/or young dependency ratio, urbanization, size of the social security system, life expectancy, and market structure. Other studies have also considered religious and cultural factors (S. C. Park & Lemaire, 2012). Despite the varied nature of the determinants of insurance demand, some common factors run through most studies as the determinants of insurance density (and penetration). These factors include income, inflation, financial (or banking sector) development, education, dependency ratio, life expectancy, savings, and urbanization.
Income
Numerous studies have established a positive relationship between income levels and the demand for non-life insurance. Whether using household or national income figures, researchers have consistently found that higher income tends to increase the demand for property and liability insurance (Beenstock et al., 1988; Browne et al., 2000; Esho et al., 2004). The findings of Esho et al. (2004) imply that improving income levels and the general standard of living could significantly boost insurance uptake across the continent. Further supporting this view, Olasehinde-Williams and Balcilar (2022) demonstrate that real income exerts a notable influence on insurance premiums, particularly non-life insurance, suggesting that such products may be perceived as luxury goods based on income elasticity patterns.
Although income is widely recognized as a key determinant of insurance demand, its impact may vary depending on a country’s level of economic development. For instance, Beenstock et al. (1988), in their study of 45 countries in 1981, find a significant positive relationship between GDP per capita and property-liability insurance premiums per capita. However, they also note that the strength of this relationship tends to weaken as countries become wealthier. Additionally, the influence of income appears more pronounced in the household insurance segment than in corporate insurance. Browne et al. (2000), in their analysis of 22 OECD countries between 1987 and 1993, examine motor vehicle insurance (typically purchased by households) and general liability insurance (typically purchased by businesses). Their findings reveal that income, wealth, foreign ownership in the insurance sector, and the legal system significantly influence insurance purchases. Notably, income has a greater effect on household-focused insurance products like motor insurance than on corporate-oriented ones like general liability coverage.
Inflation
In terms of non-life insurance, when inflation is mentioned, what comes to mind first is the impact it has on insurance in terms of cost and profitability. Inflation causes claims to become very expensive to the insurer, which in a way favors the beneficiary. For non-life insurers, unanticipated inflation can lead to higher claims costs. This tends to erode the profitability of the insurers (Kjosevski & Petkovski, 2015). Meanwhile, from the point of view of the consumer of non-life insurance, inflation can also have negative effects on their demand for insurance. Firstly, insurance premiums are often adjusted to account for inflation and rising costs. As insurers face higher expenses, they may raise premiums to maintain profitability. This can lead to increased costs for policyholders, potentially reducing the affordability of insurance coverage. Secondly, Inflation can impact consumers’ disposable income and overall wealth. In times of high inflation, consumers may experience a decrease in purchasing power, which could lead them to prioritize essential expenses over discretionary purchases such as insurance. Conversely, inflation can also have positive effects on the demand for non-life insurance products. For instance, as inflation drives up the cost of goods and services, the replacement cost of assets such as property, vehicles, and machinery also rises. This can lead individuals and businesses to seek higher coverage limits for property and casualty insurance to ensure they are adequately protected against potential losses due to inflation-induced increases in replacement costs.
Financial Development
Outreville (1990) explores the role of insurance markets in developing economies and concludes that banks dominate the financial landscape in these regions. Besides income elasticity, the study identifies financial development as a major determinant of non-life insurance demand in such countries. As financial systems mature, they promote credit-based transactions, enabling individuals and firms to finance property acquisitions and other valuable assets. These possessions often necessitate protection, thereby increasing the demand for property and liability insurance. Liu and Zhang (2016) highlight the strong link between the insurance and banking sectors, noting that banks are more inclined to issue loans for homes and vehicles when insurance coverage is available—sometimes even using such policies as collateral. Moreover, insurers benefit from bank partnerships through direct distribution of insurance products (Cummins & Venard, 2008). Balcilar et al. (2018) further examine the interaction between banks and insurance firms in Africa, analyzing whether these sectors function as substitutes or complements. Their study of 10 African nations—representing the majority of the continent’s financial activity—reveals that banking and insurance sectors work together synergistically, with their collaboration contributing positively to economic growth.
Education
In terms of non-life insurance, S. C. Park and Lemaire (2012) find a positive relation between education and non-life insurance demand. As Browne and Kim (1993) suggests, higher educational attainment generally correlates with increased risk aversion and a heightened recognition of the importance of insurance. Education can increase individuals’ awareness of various risks they may face in life, including property damage, liability claims, or unexpected events like accidents and natural disasters. As people become more educated, they may better understand the importance of protecting themselves against such risks through insurance coverage, leading to an increased demand for non-life insurance products. Education also correlates with financial literacy and can enhance individuals’ understanding of financial concepts, including insurance principles, policy terms, and coverage options. A higher level of financial literacy can empower consumers to make more informed decisions about insurance products, assess their insurance needs accurately, and choose appropriate coverage levels, leading to a higher demand for non-life insurance. Furthermore, education is often positively correlated with income and wealth levels. Higher-income individuals may have more assets to protect, such as homes, vehicles, and valuable possessions, increasing their demand for property and casualty insurance coverage. Meanwhile, contrary findings by Szpiro (1985) and Outreville (1990) demonstrate a negative association between education level and risk aversion. Their research indicates that higher education tends to decrease risk aversion, leading to greater risk-taking behavior among educated individuals. Browne et al. (2000) and Esho et al. (2004) also utilized education level as a proxy for risk aversion when discussing non-life insurance.
Dependency Ratio
Literature seems to be more concerned about the effect of the dependency ratio on life insurance. Some studies argue that having more dependents can put financial burden on people and hence reduce their insurance purchases (Akhter & Khan, 2017). Alhassan and Biekpe (2016) thus find that dependency ratio leads to decline in life insurance consumption in Africa. On the other hand, others argue that breadwinners with many dependents would tend to buy insurance to cushion them in case of calamities, such as the demise of the breadwinner (Li et al., 2007). Redzuan (2011) thus finds a positive impact of the number of dependents on life insurance in Malaysia. Both of these arguments can hold for non-life insurance as well. A high dependency ratio can strain household finances. Families may have to allocate more of their income to supporting dependents, leaving less available for discretionary spending such as insurance premiums. Conversely, people with many dependents would not have a lot of disposable income to acquire more properties. Hence, they would protect or secure their already acquired properties, including buying insurance coverage, to keep them safe. Furthermore, many people with old-aged dependents buy funeral policies to ease their financial burden in times the dependent passes on.
Savings
Rose and Mehr (1980) believe that savings can cause a reduction in insurance consumption. The higher the savings (and other similar financial assets) owned by a very wealthy person, the lower the propensity to purchase property or liability insurance. This is because the very wealthy person might think he has enough financial resources to rely on in times of unexpected eventualities. This therefore suggests a negative relationship between savings and non-life insurance. On the contrary, Headen and Lee (1974) argue that savings may rather cause a push in demand for non-life insurance; because savings could cause increased acquisition of properties and household assets that require insurance cover.
Urbanization
Several studies have linked urbanization to non-life insurance demand. For instance, Dragos (2014) reports a significant positive association between urbanization and non-life insurance uptake in both Asian and Central and Eastern European countries. Similarly, S. C. Park and Lemaire (2012) identify urbanization as a driver of increased demand for non-life insurance. According to Sherden (1984), urban dwellers are more likely to perceive higher risks such as theft and car accidents, prompting greater interest in insurance coverage. Browne et al. (2000) note that urban environments lead to more frequent interpersonal interactions, which they interpret as an indicator of elevated loss probability—and by extension, heightened insurance demand. Esho et al. (2004) add that the dense concentration of people and property in cities may lead to increased delinquency risks, reinforcing the need for additional financial protection mechanisms such as insurance. Moreover, Beck and Webb (2003) argue that as urban populations grow, reliance on informal risk-sharing arrangements tends to decline, fostering greater use of formal insurance products. In contrast, Treerattanapun (2011) finds no statistically significant relationship between urbanization and demand for non-life insurance.
Economic Freedom and Institutional Structures
Economic freedom refers to the ability of individuals and businesses to engage in voluntary economic activities without undue interference from the government or other external forces. It encompasses several key principles and conditions that contribute to a free-market economy. Economic freedom and the institutional structure of a country are deeply intertwined, as institutions play a crucial role in shaping the economic environment in which individuals and businesses operate. The viability of a vibrant non-life insurance market depends to a large extent on the institutional structure of a country. If distrust clouds the judgment of potential customers, they may lack the motivation to purchase insurance coverage. Moreover, impediments faced by customers in appealing breaches of non-life insurance contracts can diminish satisfaction derived from insurance and deter consumers from committing to it. Fraud perpetuated during claim reporting can render the insurance mechanism prohibitively costly for insurers and, by extension, customers. The lack of contract enforcement may discourage potential customers and impede insurers’ ability to invest efficiently and control the price of their products (Beck & Webb, 2003). Additionally, a lack of political stability shortens the economic horizon for businesses, affecting the interests in insurance engagements for both potential customers and insurers.
Institutions, as defined by North (1989), “are rules, enforcement characteristics of rules, and norms of behavior that structure repeated human interaction” (page 1,321). In other words, institutions are human-created limitations that shape human conduct. Institutions play a crucial role in diminishing uncertainty experienced by firms and individuals (Peng, 2002). The institutional structure of a nation refers to the formal and informal mechanisms regulating human behavior, including legal frameworks established to safeguard the property rights of individuals and businesses. Consequently, institutional structures are prone to shaping people’s behaviors and attitudes regarding decisions to purchase insurance (Elango & Jones, 2011). Few studies have found the impact of institutional determinants on non-life insurance demand (Elango & Jones, 2011; H. Park et al., 2002). H. Park et al. (2002) for instance use the economic freedom index of the Heritage Foundation and Wall Street Journal as a proxy for government economic regulations, and they found that government regulation has a significant negative impact on insurance (both life and non-life). Per their interpretation, countries with more stringent regulations are less likely to attract and retain insurance companies willing to provide insurance services, resulting in a lesser degree of insurance pervasiveness. Elango and Jones (2011) study the impact of economic freedom indicators such as property rights, business freedom, fiscal freedom, governmental spending, freedom from corruption, financial freedom, and openness of the economy, on non-life insurance demand and non-life insurance growth. The results, among others, show that financial freedom and openness of the economy have a positive impact on non-life insurance density while business freedom, and governmental spending have a negative impact on non-life insurance demand. In terms of growth, financial freedom is negatively related to the growth of non-life business. The explanation given to this finding is that as loans for property increase, so does the demand for insurance as lenders require insurance to protect their interests. Trinh et al. (2016) also discover that heightened economic freedom might elevate expenditures on non-life insurance, facilitated by avenues like investment and regulation of business and trade barriers. Their findings suggest that initiatives endorsing enhancements in economic freedom (including reduced tariffs, robust enforcement of the law and protection of property rights, and increased personal choice) could stimulate spending on non-life insurance.
Competition
Across various sectors, including insurance, competition serves as a catalyst for efficient resource allocation, fostering balanced national development, spurring product innovation, and driving economic growth (Caminal & Matutes, 2002). The merits of competitive markets are starkly illustrated by the adverse social welfare ramifications of monopolies (Guzman, 2000). Within a monopoly framework, companies tend to set prices above competitive levels, enabling managerial practices that sustain unreasonable costs. Such monopolistic dominance often perpetuates inefficiencies in management, leading to heightened cost inefficiency (Abel & Le Roux, 2016). Conversely, competition incentivizes firms to continually enhance production and distribution efficiency, embrace superior technology, and foster innovation (Cooke et al., 2007). In the insurance realm, competition plays a pivotal role in mitigating risk and uncertainty (Claessens, 2009; Owusu-Antwi & Antwi, 2013), while furnishing consumers with an array of choices. Competitive dynamics exert downward pressure on insurance prices, rendering coverage more accessible and affordable. Outreville (1996) posits that monopolistic market structures stifle insurance growth. Unfortunately, regulatory interventions can compromise competition. Pasiouras and Gaganis (2013) contend that measures such as imposing high minimum capital requirements, while mitigating bankruptcy risk, erect entry barriers that curtail competition. It is therefore imperative for governmental bodies to undertake initiatives that bolster competition, thereby fostering economic expansion.
Data and Methodology
This study uses data that span over the period 1995 through 2021. This period is chosen based on the availability of data.
Response Variables
We consider two response variables as proxies for non-life insurance demand: non-life insurance density (DEN) and non-life insurance penetration (PEN). While some studies use only one of these measures, our study employs both to provide a more nuanced and comprehensive view of insurance demand. Using both metrics allows us to explore whether certain factors impact one measure of demand more significantly than the other, offering a deeper understanding of the drivers of insurance demand. Additionally, this approach serves as a robustness check and facilitates cross-validation, helping to confirm whether theoretical relationships between insurance demand and the independent variables are consistent across different definitions of demand. Consistent findings across both measures reinforce the validity of these theoretical relationships, thereby strengthening the basis for policy recommendations aimed at improving insurance market performance and addressing demand issues. Insurance density is calculated by dividing the annual gross premium by the total population, while insurance penetration is expressed as the annual gross premium as a percentage of the country’s GDP. We source gross premium data from the National Insurance Commission’s annual reports and obtain population and GDP data from the World Bank’s economic indicators database.
Predictor Variables
Seventeen predictors were used in the study, all of which are based on the literature review. Table 2 shows the descripting of the predictor variables.
Description of Predictor Variables.

Model Specification
The following econometric models are formulated for the study
Model 1

Model 2

Where:
DEN = Non-life Insurance Density
PEN = Non-life Insurance Penetration
SAV = Savings
INC = Income
URB = Urbanization
EDU = Education
INFL = Inflation
FDEV = Financial Development
DEPT = Dependency ratio (Total dependents)
HHI = Herfindahl-Hirschman Index
PROP = Property Rights
GVINT = Government Integrity
TAXB = Tax Burden
GVEXP = Government Expenditure
BUSFR = Business Freedom
MONFR = Monetary Freedom
TRADFR = Trade Freedom
INVFR = Investment Freedom
FINFR = Financial Freedom
Regularized Regression and Its Relevance to the Study
Regularized regression techniques—commonly referred to as regularization—have gained significant traction in empirical research across various fields, including finance, economics, and econometrics (Athey, 2017; Kleinberg et al., 2018; Mullainathan & Spiess, 2017; Varian, 2014). These methods offer a robust framework for addressing estimation challenges such as multicollinearity and high-dimensional predictor spaces, which are common in studies involving numerous economic and financial variables.
Traditional multiple regression models estimated via ordinary least squares (OLS) often suffer from instability when predictors are highly collinear. Although OLS estimates are unbiased, they can exhibit inflated variances, undermining predictive reliability (Buonaccorsi, 2010). This issue is particularly relevant to the present study, which investigates the determinants of non-life insurance demand in Ghana using a relatively large set of predictors. Classical variable selection methods such as stepwise regression, backward elimination, and forward selection (Zerriaa et al., 2017) address multicollinearity by discarding statistically insignificant variables. However, these approaches are prone to overfitting, model instability, and the risk of omitting potentially relevant predictors (Smith, 2018).
In contrast, regularization techniques introduce a penalty term into the regression model, which shrinks coefficient estimates and selectively removes irrelevant variables, thus mitigating multicollinearity and enhancing model stability. The three primary forms of regularization applied in this study are ridge regression (Hoerl & Kennard, 1970), least absolute shrinkage and selection operator (LASSO) regression (Tibshirani, 1996), and elastic net regression (Zou & Hastie, 2005). Ridge regression applies an L2 penalty that shrinks all coefficients toward zero without eliminating any, reducing variance but not performing variable selection. LASSO uses an L1 penalty, which not only shrinks coefficients but also forces some to zero, thus enabling both estimation and variable selection. Elastic net combines the L1 and L2 penalties of LASSO and ridge, respectively, making it particularly effective in settings with highly correlated predictors by allowing grouped selection rather than arbitrary exclusion.
The use of regularization in this study is especially pertinent for several reasons. First, unlike prior studies that used a limited set of predictors, this analysis incorporates 17 variables covering macroeconomic, demographic, and institutional dimensions to capture a comprehensive picture of the drivers of non-life insurance demand in Ghana. The relatively high ratio of predictors to observations introduces a risk of overfitting and unstable OLS estimates, which regularization effectively addresses by introducing a small bias in exchange for substantial variance reduction.
Second, many of the predictors—such as inflation, financial development, and income—are often correlated, further complicating OLS estimation. Ridge regression is beneficial in this context for reducing the impact of multicollinearity, while LASSO and elastic net enhance interpretability by automatically excluding irrelevant predictors. This contributes to a more parsimonious and interpretable model without compromising predictive accuracy.
Third, regularization provides computational efficiency over traditional model selection techniques. Instead of exhaustively searching across models, these methods determine the optimal penalty parameter (λ) via cross-validation, balancing model complexity, and generalizability. Specifically, in this study, 10-fold cross-validation is used to identify the λ that minimizes mean squared error (MSE) while applying the “one-standard-error” rule to enhance generalization. The results—including coefficients and model performance—are reported and discussed in the relevant tables and figures provided in the empirical section.
Overall, the adoption of ridge, LASSO, and elastic net regression offers a more stable and interpretable modeling framework compared to traditional OLS. These methods not only improve estimation accuracy and reduce overfitting but also facilitate clearer insights into the relative importance of various economic and institutional factors driving non-life insurance demand.
The Estimation Process
The mathematical formulation follows Oteng et al. (2023). MATLAB (version R2022a), specifically the Statistics and Machine Learning Toolbox, is used for estimation, following the procedure outlined by The MathWorks, Inc (2022) The inbuilt functions ridge (for ridge regression) and lasso (for LASSO and elastic net regressions) perform the estimations. The alpha (α) values in these functions determine the specific regularization method: α = 0 specifies ridge regression, α = 1 specifies LASSO, and values ranging from α = .1 to .9 specify elastic net. Small values of α approaching 0 (e.g., α = .001) can also closely approximate ridge regression. The function allows direct specification of the α value; in this study, α = 0 is used for ridge regression, α = 1 for LASSO, and α = .1, .2, …, .9 for elastic net. A separate simulation is conducted for each α value, resulting in 11 different simulations—one each for ridge and LASSO and nine for elastic net. Each simulation produces multiple lambda (λ) values, each corresponding to different predictor coefficients.
Through a cross-validation process, the optimal λ and the corresponding coefficients are selected. The function includes an inbuilt cross-validation algorithm that determines the optimal λ, allowing for the specification of the preferred k-fold value for cross-validation. In this study, a 10-fold cross-validation (k = 10) is used. The 10-fold cross-validation provides an optimal trade-off between bias and variance, ensuring a stable and reliable estimate of model performance. Studies (e.g., Kohavi, 1995) have shown that 10-fold cross-validation offers a good estimate of test error while keeping computational costs reasonable.
Each λ value is associated with Mean Squared Error (MSE) and MSE plus one standard deviation. In this study, the optimal λ is selected based on the minimum MSE plus one standard deviation rather than the absolute minimum MSE. This approach ensures a more parsimonious and robust model. The minimum MSE corresponds to a higher degree of freedom (i.e., more non-zero coefficients), leading to a more complex model. By selecting the λ associated with MSE plus one standard deviation, a slightly higher regularization penalty is applied, reducing model complexity while maintaining strong predictive performance. This enhances generalizability and minimizes sensitivity to data variations.
The algorithm automatically standardizes the variables, optimizes or estimates the parameters, and reconverts the results to reflect the original values. The comparison of regularization methods is based on analyzing the optimal coefficients (determined by the optimal λ in each simulation) across different α values. This serves as both a robustness check and a sensitivity analysis, further validating the model beyond the k = 10 cross-validation process.
Results and Discussion
Table 3 shows the summary statistics of the variables used for the regression analysis. Insurance density (DEN) has a high mean of 17.28 but also a large standard deviation (20.18), indicating wide disparities in insurance uptake. Income (INC) also displays considerable variation, with a mean of 3,657.23 and a standard deviation of 985.69, reflecting differences in economic conditions. Table 4 and Figure 1 also present the correlation matrix and heatmap, respectively. It is evident that some of the predictors are highly correlated, justifying the use of regularization techniques for the data analysis to address potential multicollinearity. Beyond the technical justification, the correlation matrix and heatmap reveal important economic relationships among the variables. Income (INC) and government expenditure (GVEXP) are both positively and relatively strongly correlated with non-life insurance density (DEN) and penetration (PEN), which aligns with the empirical findings that these are key drivers of insurance demand. Conversely, inflation (INFL), dependency ratio (DEPT), and tax burden (TAXB) show negative correlations with the insurance demand proxies, suggesting that macroeconomic pressures and household financial constraints may discourage insurance uptake. Interestingly, financial development (FDEV) and financial freedom (FINFR), while conceptually important, show only weak to moderate correlations with insurance demand, potentially indicating limited practical impact within the Ghanaian context. These observed correlations provide useful intuition for interpreting the regularization results and reinforce the economic reasoning behind the model outcomes (Tables 5 and 6).
Summary Statistics.

Note. DEN = non-life insurance density; PEN = non-life insurance penetration; SAV = savings; INC = income; URB = urbanization; EDU = education; INFL = inflation; FDEV = financial development; DEPT = dependency ratio; HHI = Herfindahl-Hirschman Index; PROP = property rights; GVINT = government integrity; TAXB = tax burden; GVEXP = government expenditure; BUSFR = business freedom; MONFR = monetary freedom; TRADFR = trade freedom; INVFR = investment freedom; FINFR = financial freedom.
Correlation Matrix.

Note. DEN = non-life insurance density; PEN = non-life insurance penetration; SAV = savings; INC = income; URB = urbanization; EDU = education; INFL = inflation; FDEV = financial development; DEPT = dependency ratio; HHI = Herfindahl-Hirschman Index; PROP = property rights; GVINT = government integrity; TAXB = tax burden; GVEXP = government expenditure; BUSFR = business freedom; MONFR = monetary freedom; TRADFR = trade freedom; INVFR = investment freedom; FINFR = financial freedom.
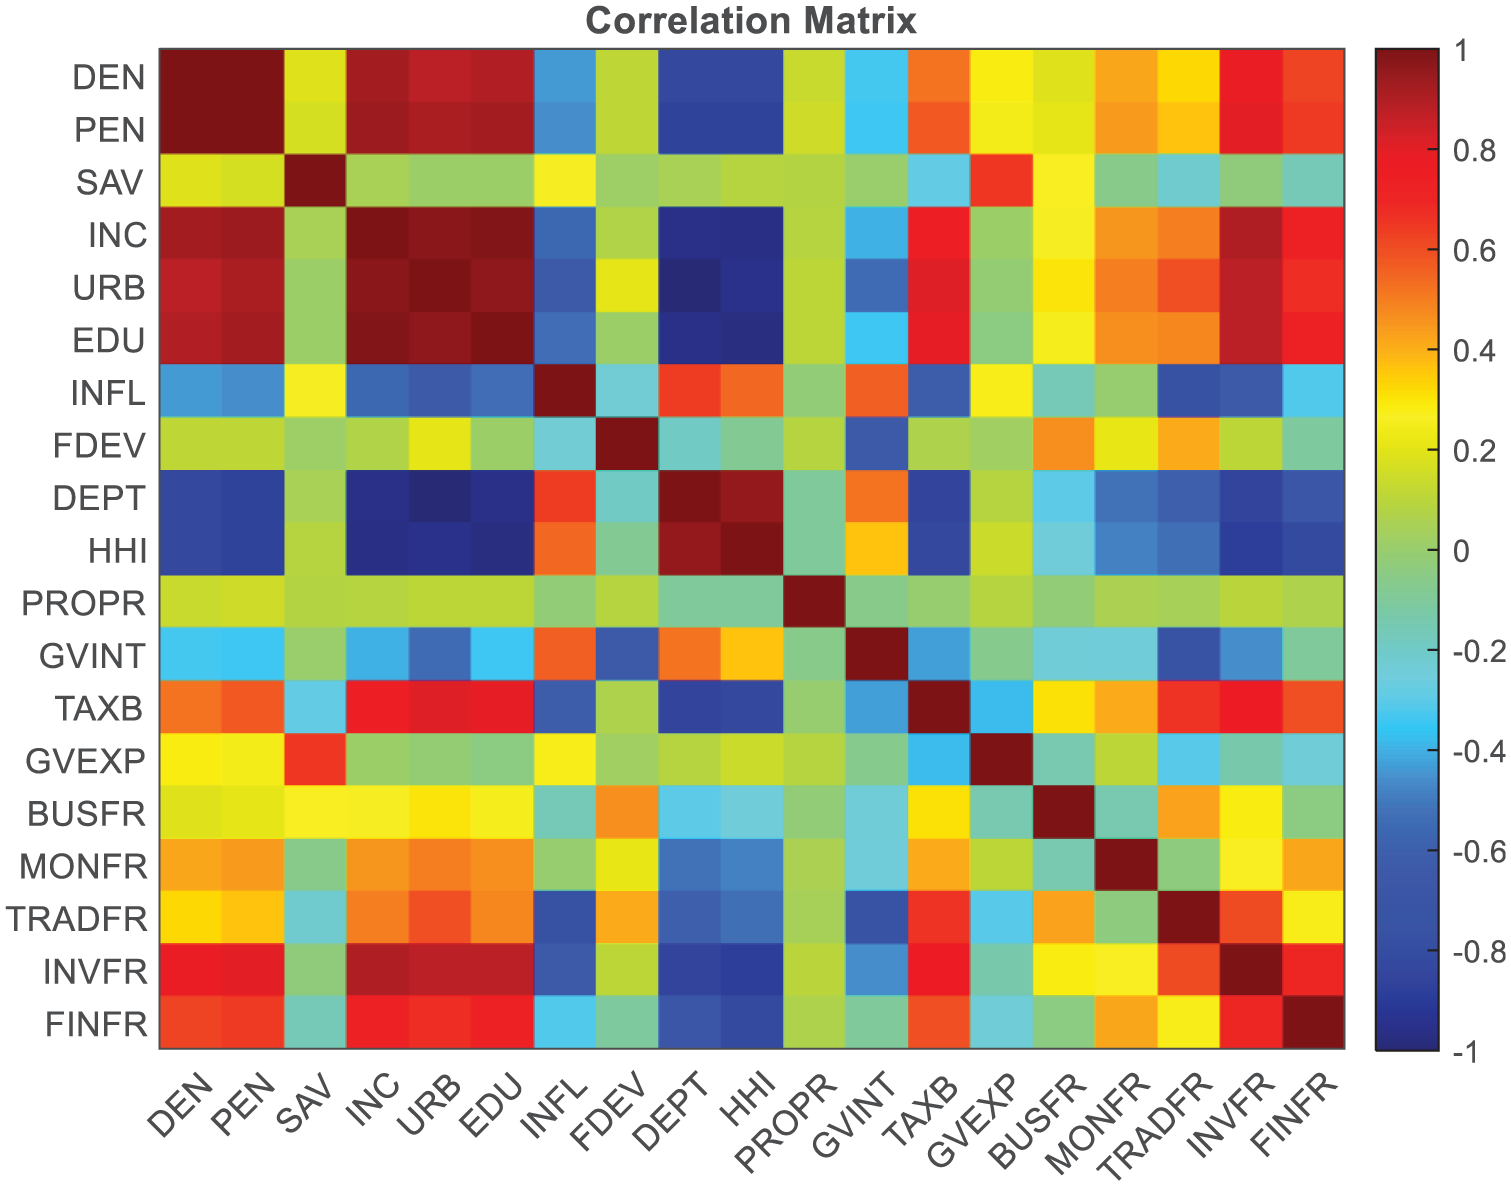
Heatmap of correlation coefficient.
Determinants of Non-Life Insurance Density.

Note. SAV = savings; INC = income; URB = urbanization; EDU = education; INFL = inflation; FDEV = financial development; DEPT = dependency ratio; HHI = Herfindahl-Hirschman Index; PROP = property rights; GVINT = government integrity; TAXB = tax burden; GVEXP = government expenditure; BUSFR = business freedom; MONFR = monetary freedom; TRADFR = trade freedom; INVFR = investment freedom; FINFR = financial freedom.
Determinants of Non-life Insurance Penetration.

Note. SAV = savings; INC = income; URB = urbanization; EDU = education; INFL = inflation; FDEV = financial development; DEPT = dependency ratio; HHI = Herfindahl-Hirschman Index; PROP = property rights; GVINT = government integrity; TAXB = tax burden; GVEXP = government expenditure; BUSFR = business freedom; MONFR = monetary freedom; TRADFR = trade freedom; INVFR = investment freedom; FINFR = financial freedom.
Table 5 shows the outputs of econometric model 1 (determinants of non-life insurance density), with various α values. α = 0 means Ridge regression, α = .1, .2, …, .9 means Elastic net regression, and α = 1.0 means LASSO regression. Similarly, Table 6 also shows the outputs of econometric model 2 (determinants of non-life insurance penetration), with various α values. Each α value corresponds to an output model. For each α value, there are corresponding coefficients (β values) for each predictor. There are also values for the intercept, lambda (λ), R-squared, adjusted R-squared, and mean-squared error (MSE). The β values shrink (approach zero) as the α values become larger (approach 1.0). In some cases, the β values are zero. This signifies that those predictors have no effect on the response variable at a particular α value. The larger the alpha value, the less the non-zero β values, and the more parsimonious the output model becomes.
It is worthy of note that each α value corresponds to a separate simulation. There are 11 simulation results in Table 5, and 11 in Table 6, making 22 simulations in all. Each simulation (which corresponds to each α) generates over 100 values of λ. For each of these λ values in a particular simulation, there are different corresponding sets of coefficients (β values) for the predictors, as well as different sets of R-squared, adjusted R-squared, and mean squared error (MSE). In each simulation (for each α), the larger the λ, the more the tendency of β’s shrinking to zero (especially the relatively less important predictors).
We use a cross-validation algorithm of k = 10 to select the optimal λ value (and its corresponding β, R-squared, adjusted R-squared, and MSE values) in each simulation (i.e., for each α value). These optimal values are the information presented under the various α values in Tables 5 and 6. In determining the optimal λ our algorithm selects the one that produces the minimum MSE plus one standard deviation.
For instance, Figures 2 and 3 show the trace plots of econometric models 1 and 2 respectively, at α = 1 (LASSO). The trace plots show the β values at various λ values. The larger the λ value (toward the left), the smaller the β value (the higher the tendency of β approaching zero). In other words, the higher the λ value, the smaller the degrees of freedom (df), which is the number of non-zero β values. The green dotted lines correspond to the λ that produces the minimum MSE. The blue dotted line corresponds to the λ that produces the minimum MSE plus one standard deviation. The optimal λ values and their corresponding β values and other parameters are shown in Tables 5 and 6.

Trace plot of determinants of non-life insurance density (α = 1).

Trace plot of determinants of non-life insurance penetration (α = 1).
Figures 4 and 5 show the cross-validation results (with error bars) of economic models 1 and 2 respectively. They show that generally, the higher the λ value (toward the left), the higher the MSE. Again, the green dotted lines correspond to the λ that produces the minimum MSE, while the blue dotted line corresponds to the λ value that produces the minimum MSE +1 standard deviation (optimal λ). The reason for choosing the marginally higher MSE over the minimum MSE is to make the model as parsimonious as possible while also making it as robust as possible. The minimum MSE corresponds to higher degree of freedom, resulting in less parsimonious model. By choosing the λ corresponding to MSE plus one standard deviation, we are selecting a slightly larger regularization penalty, which reduces model complexity while still maintaining good predictive performance. This leads to a more robust model that is less sensitive to variations in the data, ultimately improving its performance on unseen data. This approach prioritizes model simplicity and generalizability

Cross-validation of MSE for non-life insurance density model (α = 1).

Cross-validation of MSE for non-life insurance penetration model (α = 1).
Econometric Model 1—Determinants of Non-insurance Density
At α = 0 (Ridge regression), inflation, dependent ratio, HHI (concentration), tax burden, and trade freedom have a negative relationship with insurance density. On the other hand, savings, income, urbanization, education, financial development, property rights, government integrity, government expenditure, business freedom, monetary freedom, investment freedom, and financial freedom have a positive relationship with insurance density. Note that negative relationship with HHI (concentration) means positive relationship with competition. Therefore, competition has a positive relationship with insurance density. At α = 0, the optimal λ is 0.5597, R-squared is .8986, adjusted R-squared is .7072, and MSE is 81.9963. As the α increases toward 1, some of the coefficients (β values) become zero. Business freedom becomes zero right from α = .1. This means its contribution in determining density is relatively not significant. At α = .6, inflation, government integrity, business freedom, and monetary freedom have zero coefficients. At α = 1 (LASSO), only income and government expenditure have non-zero coefficients. This is the most parsimonious output model. Interestingly, the α that gives the highest adjusted R-squared (0.8702) is also α = 1. This makes it the output model with the highest predictive power. Again, the α that produces the minimum MSE among the optimal set of MSEs (58.9024) is α = 1. This makes α = 1 the best-performing output model to determine non-life insurance density. The fact that only income and government expenditure have non-zero coefficients at α = 1 also means that these are the two most significant determinants of non-life insurance density.
Econometric Model 2—Determinants of Non-insurance Penetration
At α = 0 (Ridge regression), inflation, dependent ratio, HHI (concentration), tax burden, and trade freedom have a negative relationship with non-life insurance penetration. On the other hand, savings, income, urbanization, education, financial development, property rights, government integrity, government expenditure, business freedom, monetary freedom, investment freedom, and financial freedom have a positive relationship with non-life insurance penetration. At α = 0, the optimal λ is 0.5203, R-squared is .9188, adjusted R-squared is .7654, and MSE is 0.0191. Most of the coefficients (β values) become zero at α = .1 and beyond. At α = .6, all but income, urbanization, education, and government expenditure are zero. At α = 1 (and also α = .9), all but income and government expenditure are zero. This shows that income and government expenditure are the two most significant predictors of non-life insurance penetration. The largest adjusted R-squared occurs at α = .9 (0.8921), followed by α = 1 (0.8844). Note that the non-zero coefficients at α = .9 and α = 1 are the same (income and government expenditure). The lowest MSE occurs at α = 1. Therefore, generally, we can say that α = 1 which is the most parsimonious model, is also the most reliable model for predicting non-life insurance demand in general (whether measured by density or penetration). We can also say that income and government expenditure are the most significant predictors of insurance demand, whether measured by density or penetration. Both have a positive effect on insurance demand. Apart from the income and government expenditure, the other predictors that tend to have non-zero coefficients under most of the α values are urbanization (positive), education (positive) dependent ratio (negative) and HHI or concentration (negative).
Comparative Insights Across Models
Two econometric models were estimated: one explaining non-life insurance density and the other non-life insurance penetration. While insurance density is more responsive to a broader range of socio-economic factors at lower α values, insurance penetration shows greater resilience in fewer predictors as regularization increases (Table 7). Across both models, income and government expenditure consistently emerged as the most robust and influential predictors, retaining positive effects regardless of the regularization method applied. Notably, education and urbanization, although not retained under strict LASSO conditions, showed recurring importance across models with lower penalization levels. This makes education and urbanization the next two most inportant predictors of insurance demand after income and government expenditure (Table 7). These findings underscore the central roles of economic capacity and fiscal policy in promoting insurance uptake in Ghana.
Comparative Insights Across Models.
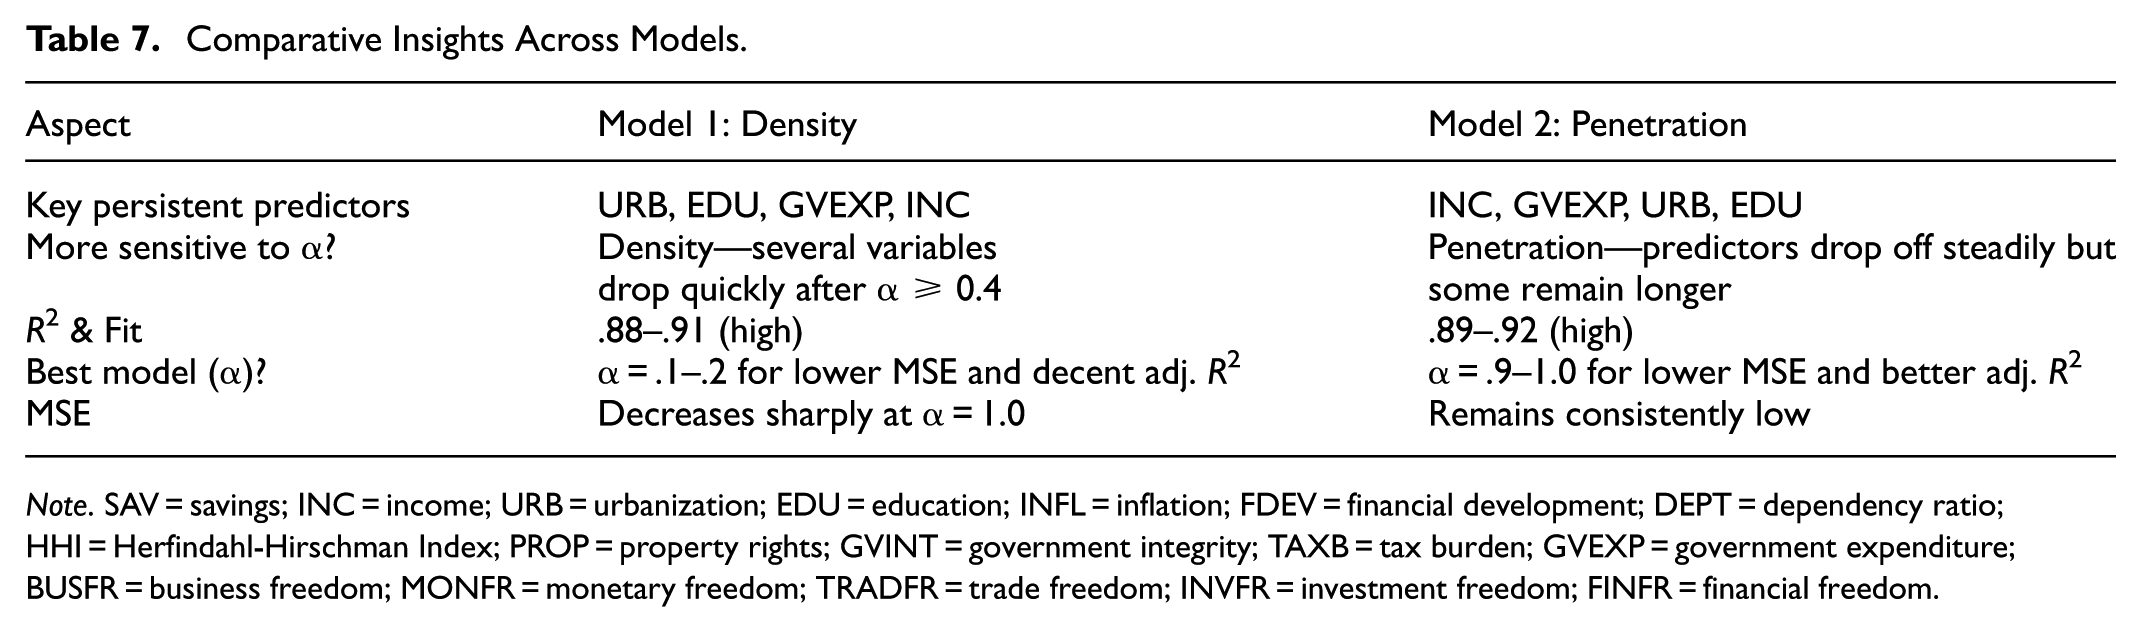
Note. SAV = savings; INC = income; URB = urbanization; EDU = education; INFL = inflation; FDEV = financial development; DEPT = dependency ratio; HHI = Herfindahl-Hirschman Index; PROP = property rights; GVINT = government integrity; TAXB = tax burden; GVEXP = government expenditure; BUSFR = business freedom; MONFR = monetary freedom; TRADFR = trade freedom; INVFR = investment freedom; FINFR = financial freedom.
Among the three regularization methods, LASSO (α = 1) produced the best-performing models in both density and penetration cases—achieving the highest adjusted R2 and lowest mean squared error (MSE; retaining only income and government expenditure). In comparison to traditional variable selection methods such as stepwise regression, backward elimination, and forward selection (e.g., Zerriaa et al., 2017), the regularization approach employed here offers a more robust and replicable framework. By introducing a penalty term that shrinks and eliminates less important coefficients, regularization methods avoid overfitting while preserving the most informative predictors—making them especially suitable in high-dimensional economic settings.
Discussion of Findings
This section discusses the study’s key empirical findings in light of existing literature on non-life insurance demand.
The positive and robust association between income and non-life insurance demand reinforces the classical economic view that insurance is a normal good. This finding is consistent with prior empirical studies by Esho et al. (2004), and Olasehinde-Williams and Balcilar (2022), which identify income as one of the most important predictors of insurance uptake. As income increases, individuals have greater capacity to purchase insurance to protect accumulated assets, making income a persistent driver across various contexts.
The study also finds government expenditure to be a significant and positive determinant of insurance demand, which contrasts with Elango and Jones (2011), who reported a negative relationship. The positive effect observed in the Ghanaian context may be due to the role of public investment in infrastructure, education, and healthcare, which indirectly enhances disposable income and encourages financial inclusion. Public spending in these areas reduces private household burdens, thereby improving the enabling conditions for insurance uptake.
While education and urbanization were not consistently retained under the LASSO method (which applies stricter penalization), they reappeared in less restrictive models, indicating meaningful though less dominant effects. These findings align with Lou et al. (2024), Barrese et al. (2016) and Akotey et al. (2011), who suggest that education improves risk awareness and financial literacy, while urbanization increases access to insurance products and exposure to insurable risks. Their partial influence in this study may reflect structural challenges in Ghana’s urban development and education systems.
Several variables traditionally regarded as significant—including inflation, financial development, government integrity, business freedom, property rights, trade freedom, and monetary freedom—were either weak or excluded under penalized models. These results suggest that, in Ghana’s context, these variables may exert more long-term or indirect effects and are overshadowed by more immediate and tangible factors like income and government expenditure. This finding is consistent with studies such as Zerriaa et al. (2017), which highlight context-specific determinants of insurance demand. The limited significance of market competition, measured by the Herfindahl-Hirschman Index, may indicate structural market inefficiencies or limited consumer sensitivity to competitive pricing in the insurance sector.
Conclusion and Policy Recommendations
This study examines the determinants of non-life insurance demand in Ghana using regularization techniques—Ridge, LASSO, and Elastic Net regression—to address model complexity and multicollinearity among predictors. Drawing on a comprehensive dataset, the analysis identifies key drivers of insurance demand, including income, government expenditure, urbanization, and education. These factors are positively associated with insurance uptake, while inflation, dependency ratio, tax burden, and market concentration have negative or weak effects.
Among all predictors, income and government expenditure emerge as the most influential, consistently retained across models and explaining a substantial portion of the variation in both insurance density and penetration. These findings offer empirical clarity on which macroeconomic and structural factors matter most in shaping insurance demand in Ghana. Based on the study’s findings, the following policy actions are recommended:
First, policymakers should prioritize employment creation, wage enhancement, and entrepreneurship support. Insurers should design products aligned with income levels to improve affordability and uptake.
Second, Government investments in infrastructure, healthcare, and education reduce household financial pressure and foster economic participation. Such spending indirectly enhances insurance demand by increasing disposable income and asset ownership.
Third, although not a dominant predictor, inflation affects real income. Maintaining price stability through prudent fiscal and monetary policy supports household financial planning and insurance participation.
Fourth, the negative effect of market concentration suggests a need for a more competitive landscape. Regulators should reduce entry barriers, enforce consumer protection, and promote innovation.
Fifth, high tax burdens can deter insurance purchases. Targeted tax relief, particularly for low-income earners and small businesses, can incentivize participation.
Sixth, expand financial literacy through public education and integrate insurance education into school curricula. Urban policies should support asset accumulation and access to formal employment.
Finally, With high dependency ratios, insurers should design flexible, affordable policies for informal sector workers and low-income households. Microinsurance and mobile-based distribution can improve accessibility.
Contributions of the Study
This study advances the understanding of non-life insurance demand determinants by offering methodological, theoretical, and empirical insights.
Methodological Contribution. Unlike previous studies that relied on traditional regression models (e.g., OLS, stepwise regression), this study employs regularization techniques, which effectively handle high-dimensional data and multicollinearity. These methods ensure a more stable and interpretable model.
Theoretical Contribution. This study extends the theoretical framework of insurance demand by incorporating institutional factors alongside economic and demographic variables. Although some prior studies have considered institutional dimensions, they remain relatively underexplored. By highlighting the interplay between institutional quality and insurance demand, this study broadens the analytical lens and contributes to a more comprehensive understanding of market development in emerging economies.
Empirical Contribution. Using a high-dimensional dataset of 17 predictors, this study provides novel evidence from Ghana, addressing gaps in African insurance literature. Unlike previous studies that used fewer predictors, this research captures a more comprehensive set of economic, financial, and institutional influences, ensuring broader policy relevance.
Limitations and Future Research
Non-causal design. This study prioritizes predictive accuracy over causal inference, offering valuable insights into the most influential factors associated with non-life insurance demand. Futures studies can build on this work by employing causal inference methods, such as instrumental variable approaches or quasi-experimental designs, to uncover cause-effect relationships.
Structural shifts. The study does not account for possible structural changes over time, such as economic policy reforms or market disruptions. Future research could incorporate time-varying models to capture such dynamics.
Omitted variable bias. Despite using a relatively large set of 17 predictors—among the most comprehensive in the literature—the risk of omitted variable bias cannot be entirely ruled out. Future work may explore additional variables or domain-specific factors that could influence insurance demand.
Data quality limitations. The study relies on secondary data, which may be subject to measurement errors or inconsistencies. Future research could benefit from more granular or primary data sources to enhance reliability.
The study covers the period from 1995 to 2021, excluding other years due to data unavailability. Additionally, the focus is solely on Ghana, and the economic conditions in other emerging economies may not align perfectly with those of Ghana. Future studies should apply methodology to data from other countries.
Footnotes
Acknowledgements
We would like to acknowledge the significant contributions of the late Mr. Emmanuel Oteng to this study. He was the leader of the research project until his unfortunate passing. As a PhD candidate at the University of Electronic Science and Technology of China, his dedication and insights were invaluable. May his soul rest in peace. We dedicate this work to his memory.
Author Note
We recommend extending this study to model insurance demand in other countries using regularization algorithms.
Ethical Considerations
This study did not involve any human participants or animals, and therefore, ethical approval was not required.
Funding
The authors received no financial support for the research, authorship, and/or publication of this article.
Declaration of Conflicting Interests
The authors declared no potential conflicts of interest with respect to the research, authorship, and/or publication of this article.
Data Availability Statement
The authors are willing to share their data in Excel format with those who wish to replicate the results of this study.