
Abstract
The 2008 global financial crisis, triggered by the U.S. subprime mortgage collapse, prompted central banks to adopt Quantitative Easing (QE) policies to stabilize financial markets and stimulate economic recovery. This study investigates the influence of QE on stock market behavior, focusing on feedback trading dynamics and volatility asymmetry in broad-based and sector-specific indices. The results reveal that QE amplifies positive feedback trading, strengthens market trends, and fosters investor overconfidence. Additionally, asymmetric volatility patterns emerge, with negative market shocks exerting a more pronounced effect on volatility than positive ones. These behavioral responses suggest that QE not only supports asset price growth but may also unintentionally reinforce speculative momentum and systemic vulnerability. The findings offer valuable implications for investors and policymakers, emphasizing the psychological consequences of unconventional monetary interventions. By bridging behavioral finance and monetary policy perspectives, the study contributes to a deeper understanding of how QE reshapes investor sentiment and market stability.
Introduction
The 2008 global financial crisis, triggered by the collapse of the U.S. subprime mortgage market, marked a profound disruption in global economic and financial systems. Widespread panic and collapsing credit markets prompted central banks led by the U.S. Federal Reserve to implement a series of unprecedented monetary policy responses. At the heart of this policy innovation was Quantitative Easing (QE), a nontraditional tool involving large-scale asset purchases aimed at restoring liquidity, lowering long-term interest rates, and stimulating economic activity when conventional interest rate policies reached their effective lower bound (Bernanke, 2020; D’Amico et al., 2020). Between 2008 and 2014, three rounds of QE (QE1, QE2, and QE3) were launched, drastically reshaping the monetary landscape and altering investor expectations across the globe.
From a macroeconomic standpoint, QE played a critical role in stabilizing financial markets and facilitating recovery. By injecting liquidity and compressing yields on government and mortgage-backed securities, QE promoted credit expansion, increased asset prices, and reduced borrowing costs for households and firms (Gertler & Karadi, 2020; Swanson, 2021). Moreover, QE indirectly stimulated aggregate demand and bolstered confidence by signaling the central bank’s commitment to economic stabilization. However, beyond these well-established macro-financial effects, a new strand of literature has begun to examine how QE policies affect investor behavior and trading dynamics, particularly in the presence of heightened liquidity and policy-induced distortions.
While the macroeconomic impacts of QE are widely explored in seminal studies (Bernanke, 2020; Bhattarai & Neely, 2022), and its influence on asset prices and yields is well-documented (Gertler & Karadi, 2020; Swanson, 2021), there remains a substantial gap in understanding how QE shapes micro-level investor behavior, especially through feedback trading mechanisms. Most studies focus on aggregate market outcomes returns, yield curves, capital flows without modeling how monetary policy influences behavioral trading strategies that drive short-term volatility and price momentum.
A few recent studies have begun to examine QE’s behavioral dimensions. For example, Cieslak et al. (2019) document cyclicality in stock returns around FOMC meetings, hinting at sentiment-driven trading. Lin et al. (2011) and Porras and Ülkü (2015) provide sectoral evidence of volatility asymmetry influenced by speculative foreign capital. However, these contributions either do not focus on QE directly or fail to isolate QE phases using rigorous econometric modeling.
Furthermore, widely cited empirical studies such as Joyce et al. (2011), Krishnamurthy and Vissing-Jorgensen (2011), and Kuttner (2018) have made notable contributions to understanding QE’s asset pricing effects but stop short of analyzing how QE-induced liquidity conditions interact with investor psychology, such as herding, overreaction, and trend-following. The omission of behavioral modeling in these works leaves a critical dimension underexplored. Therefore, the current literature lacks an integrated framework that combines: (1) behavioral finance theories (feedback trading, overconfidence, herding), (2) econometric modeling of volatility asymmetry under monetary shocks, and (3) empirical testing of QE’s behavioral impact across distinct market indices.
This study addresses this gap by applying GARCH and GJR-GARCH models enhanced with QE-specific variables to test whether QE policies intensify feedback trading and volatility asymmetry in both the S&P 500 and SOX indices. By situating QE within a behavioral framework and conducting sector-level comparative analysis, this research contributes to a more nuanced understanding of how unconventional monetary policy shapes market microstructure and investor behavior.
Insights from behavioral finance suggest that environments characterized by low interest rates and ample liquidity typical of QE periods tend to amplify investor biases, such as overconfidence, herding, and risk-seeking behavior (Barberis et al., 1998; Daniel et al., 1998). These behavioral shifts can trigger positive feedback trading, a pattern in which investors follow price trends by buying assets during price increases and selling during declines. Such momentum-driven strategies deviate from fundamentals and can lead to excessive volatility, market bubbles, and systemic fragility. As Swanson (2021) and Cieslak et al. (2019) argue, QE not only stimulates macroeconomic growth but may also unintentionally encourage speculative behavior, distorting price discovery, and increasing the likelihood of market overreactions.
Despite growing recognition of these behavioral consequences, existing research remains fragmented. Most prior studies focus on QE’s impact on interest rates, asset prices, and cross-border capital flows (Bhattarai & Neely, 2022; Curcuru et al., 2018), while relatively few address the systematic influence of QE on trading behavior and volatility structure. Moreover, few studies differentiate between broader market indices and sector-specific indices, limiting our understanding of heterogeneous investor responses across industries with varying levels of volatility and risk sensitivity.
This study addresses these gaps by empirically investigating how QE policies reinforce positive feedback trading behavior and volatility asymmetry in U.S. equity markets. Specifically, we examine two representative indices the S&P 500, which captures broad market behavior, and the Philadelphia Semiconductor Index (SOX), which reflects sectoral characteristics of technology and innovation-driven firms. By integrating GARCH-family volatility models with behavioral insights and QE phase indicators, we provide a comprehensive analysis of how unconventional monetary policy alters market dynamics from both macro-financial and micro-behavioral perspectives.
Accordingly, this study pursues three interrelated objectives; First, to assess whether QE policies systematically reinforce positive feedback trading behaviors by amplifying investor trend-following and momentum strategies; Second, to evaluate the presence of volatility asymmetry, where negative market shocks exert greater influence than positive ones under QE conditions; Third, to compare the magnitude of these effects across the S&P 500 and SOX indices, shedding light on sector-specific sensitivity to monetary interventions.
To address the gaps identified in the literature and guide the empirical investigation, this study poses the following research questions (RQs):
These research questions are informed by behavioral finance theory (Barberis et al., 1998; Daniel et al., 1998), and empirical studies ( Bhattarai & Neely, 2022; Cieslak et al., 2019; Swanson, 2021), which suggest that monetary policy can alter investor psychology and trading behavior in systematic ways, though such relationships remain underexplored in existing econometric studies.
In doing so, we aim to bridge the gap between macroeconomic policy analysis and behavioral finance theory, offering new insights into the multifaceted effects of QE on investor behavior and financial market stability. This study introduces a model that integrates behavioral finance with conditional volatility modeling to examine how QE policies influence feedback trading and volatility dynamics. Unlike previous research, which primarily focuses on the macro-level impacts of QE, our model captures how investor behavior particularly momentum trading and asymmetric responses to market shocks varies across different policy regimes and market sectors. By embedding these behavioral mechanisms within a GJR-GARCH framework and explicitly distinguishing QE phases, the model provides a novel approach to understanding the microstructural and psychological consequences of unconventional monetary policy.
This paper is structured as follows. Section 2 details the data sources and methodological approach. Section 3 presents the empirical findings and interprets the results. Finally, Section 4 concludes by summarizing the study’s implications and potential avenues for future research.
Literature Review
Quantitative Easing (QE) has been widely studied in macroeconomic and financial literature; however, its subtle effects on investor behavior, market microstructure, and feedback trading dynamics remain underexplored. This section reviews key contributions across three thematic domains: (1) the macroeconomic impacts of QE, (2) QE’s influence on financial market dynamics, and (3) the behavioral dimensions of QE, particularly feedback trading.
Macroeconomic Impacts of QE
QE policies emerged as critical countercyclical tools to combat post-crisis economic stagnation, aiming to boost aggregate demand and restore financial stability through increased liquidity and reduced borrowing costs. By engaging in large-scale asset purchases, central banks especially the U.S. Federal Reserve effectively lowered long-term interest rates, thereby improving credit availability and stimulating investment and consumption (Swanson, 2021). These actions contributed to global economic recovery, lowered unemployment, and stabilized inflation expectations (D’Amico et al., 2020; Gertler & Karadi, 2020). Bernanke (2020) further emphasized QE’s role in shaping expectations and enhancing consumer and investor confidence through wealth effects.
Despite these benefits, QE has not been free of criticism. Bauer and Rudebusch (2020) argue that while QE provides short-term relief, it does not resolve deeper structural challenges, such as stagnant productivity and rising inequality. Additionally, several studies have questioned the diminishing marginal effectiveness of successive QE rounds, raising concerns about the sustainability of QE as a long-term policy tool for economic recovery (Bauer & Rudebusch, 2020; Gagnon, 2016). This body of literature provides essential context but focuses largely on macro-level outcomes, leaving micro-behavioral mechanisms relatively underexamined.
QE and Financial Market Dynamics
QE’s influence on financial markets has been studied through its effects on asset prices, liquidity, and capital flows. Bhattarai and Neely (2022) find that QE significantly raised equity and bond prices while compressing yields, supporting the wealth effect hypothesis. Curcuru et al. (2018) document international spillovers of QE, demonstrating its influence on global capital reallocation and competitive monetary easing. Similarly, Q. Chen et al. (2024) provide new evidence that U.S. QE has substantial spillover effects on emerging markets, reinforcing the global transmission channel of unconventional monetary policies. These findings are echoed by Joyce et al. (2011) and Krishnamurthy and Vissing-Jorgensen (2011), who show that QE affects a broad range of asset classes, including commodities and emerging markets.
In terms of market functioning, QE is associated with improved liquidity, lower transaction costs, and higher trading volumes. Svensson (2021) notes that by reinforcing investor confidence, QE can stimulate risk-taking. However, this can also induce speculative bubbles and excessive valuation. Studies such as Weale and Wieladek (2016) and Eren and Malamud (2021) raise concerns about QE’s potential to distort market expectations, inflate asset prices, and induce mispricing through prolonged yield compression. While these contributions highlight the dual role of QE as both stabilizer and source of systemic risk, they often overlook the investor-level psychological and trading responses that drive short-term volatility.
Recent studies continue to affirm the far-reaching effects of QE on financial markets, with an increasing focus on its long-term implications for asset pricing, liquidity risk, and investor behavior. For instance, Eren and Malamud (2021) highlight that QE policies have led to excess returns in risk assets through prolonged yield compression, while Kiley (2020) documents persistent distortions in financial market expectations due to forward guidance and balance sheet expansion. In emerging markets, H. Chen et al. (2022) find that QE-induced capital inflows increase market sensitivity to global risk sentiment. These studies highlight the evolving nature of QE’s market impact and the necessity of understanding its behavioral and structural consequences.
Behavioral Finance and Feedback Trading
A more recent stream of literature connects QE to shifts in investor psychology and trading behavior. Swanson (2021) and Cieslak et al. (2019) argue that QE enhances investor optimism and reduces perceived risk, encouraging momentum-driven and speculative behavior. Foundational behavioral theories (Barberis et al., 1998; Daniel et al., 1998) suggest that such liquidity rich environments exacerbate biases like overconfidence, herding, and trend-chasing conditions that can trigger positive feedback trading.
These behavioral tendencies are grounded in well-established psychological mechanisms. Overconfidence bias leads investors to overestimate their knowledge and underestimate risk, especially in liquidity-rich environments encouraged by QE. Herding behavior reflects the inclination of investors to follow the actions of others, often due to informational uncertainty or fear of missing out (FOMO), which further fuels price momentum. Trend-chasing and representativeness bias also play a role, as investors extrapolate recent returns into future expectations. Under QE conditions characterized by prolonged low interest rates and central bank signaling such biases are likely amplified. These theories provide the conceptual underpinning for our modeling of feedback trading and asymmetric volatility responses within a behavioral GARCH framework.
Empirical studies support this behavioral transmission channel. Lin et al. (2011) and Porras and Ülkü (2015) show that non-hedging speculative capital intensifies volatility and momentum in foreign and sector-specific markets. Nakamura and Steinsson (2018) document how QE liquidity reduces risk aversion and accelerates procyclical trading. More recently, Duca (2023) and Li and Liu (2022) find that QE compresses risk premia and fosters market overreaction, particularly among retail investors and in technology-heavy sectors. This pattern is echoed by Christensen and Gillan (2024), who show that QE environments increase risk-taking behavior among U.S. banks, highlighting how policy-driven liquidity can induce institutional feedback behavior.
However, these studies either do not isolate QE phases rigorously or focus on generalized market indices, neglecting sectoral nuances. Moreover, while they acknowledge behavioral effects, they rarely incorporate econometric models such as GARCH-family frameworks that capture volatility dynamics linked to QE-induced sentiment.
Importantly, QE’s behavioral effects likely vary across investor types and market sectors. Institutional investors may exhibit more disciplined responses, while retail participants are more prone to sentiment-driven feedback loops. Sectors like semiconductors, with high valuation sensitivity and speculative exposure, may react differently than broader indices. However, few empirical studies have compared the behavioral dynamics of different sectors under QE conditions.
Despite growing recognition of behavioral responses to QE, critical gaps persist in the literature. First, few studies empirically quantify how QE affects feedback trading and volatility asymmetry, especially across varying market segments. Second, behavioral finance insights have not been systematically integrated into volatility modeling frameworks like GJR-GARCH to assess asymmetric investor responses to positive versus negative shocks. Third, the sector-specific implications of QE remain largely underexplored, limiting generalizability and policy relevance.
This study responds to these gaps by combining macro-financial theory and behavioral finance with advanced econometric modeling. By analyzing both the S&P 500 and the Philadelphia Semiconductor Index (SOX), we uncover sector-specific variation in feedback trading under QE. Our findings provide actionable insights for policymakers and investors, demonstrating how QE not only stabilizes markets but also alters behavioral trading patterns with potentially destabilizing consequences.
Hypothesis Development
Building upon the preceding discussions, this study bridges the gap between macroeconomic interventions and micro-level investor behavior. The literature affirms that QE stimulates growth via liquidity injections, lower interest rates, and asset price appreciation (D’Amico et al., 2020; Swanson, 2021). At the same time, behavioral finance research emphasizes that these liquidity conditions intensify psychological biases such as herding, overconfidence, and momentum trading (Barberis et al., 1998; Cieslak et al., 2019; Daniel et al., 1998).
However, the empirical quantification of QE’s behavioral transmission channels especially feedback trading is lacking. While Gorodnichenko et al. (2024) explore how monetary policy uncertainty impacts asset prices through a quantile regression framework, they stop short of modeling feedback trading dynamics or volatility asymmetry across market sectors. Moreover, previous models fail to account for how these behaviors vary across sectors with different risk profiles. By employing GARCH and GJR-GARCH models, this study integrates QE-specific indicators into conditional variance structures, capturing how investor sentiment responds to market shocks.
This study aims to address these gaps by empirically evaluating the extent to which QE policies reinforce positive feedback trading and volatility asymmetry in major U.S. stock indices. Based on this integrated theoretical and empirical framework, we propose the following testable hypotheses:
These hypotheses aim to link macro-level monetary interventions with micro-level trading psychology, offering a more comprehensive view of QE’s multifaceted effects on financial market dynamics.
Methodology
Data and Methods
This study utilizes historical stock index data for the S&P 500 Index and the Philadelphia Semiconductor Index (SOX) to analyze volatility dynamics and feedback trading behavior in U.S. equity markets. Daily closing prices for both indices are collected over the period January 2, 1992, to October 21, 2015, for the S&P 500, and May 4, 1994, to October 21, 2015, for the SOX. Return rates are computed as the logarithmic difference of consecutive daily prices. Weekly returns are also calculated to analyze behavior across different time frequencies. The data are sourced from the Taiwan Economic Journal (TEJ) database, which provides comprehensive global financial data, including major U.S. market indices such as the S&P 500 and SOX. TEJ aggregates and offers international financial data to support academic and professional research. For instance, studies such as “A novel discovery model for revealing substitution relationships from international stock markets with association rule analysis” have utilized TEJ for data on international stock markets, including U.S. indices. To ensure data accuracy and consistency, we cross-validated the TEJ data with corresponding datasets from Bloomberg and Yahoo Finance. The choice of this time frame captures multiple cycles of QE implementation (QE1, QE2, and QE3) and allows for robust empirical analysis of policy effects on investor behavior and market volatility.
Empirical Strategy and Model Justification
The selection of econometric models in this study is guided by both theoretical and empirical considerations. Given the objective of capturing volatility dynamics and feedback trading behavior under QE, the GARCH(1,1) and GJR-GARCH models are employed due to their robustness in modeling time-varying volatility and asymmetry in financial returns. The inclusion of QE factors within the GJR-GARCH framework allows us to explicitly test policy-period effects on conditional volatility and behavioral patterns. Variables such as index returns are chosen to capture high-frequency investor reactions, while both daily and weekly frequencies are used to assess short- and medium-term behavioral shifts. These modeling choices are consistent with previous studies in financial econometrics (e.g., Engle & Ng, 1993; Sentana & Wadhwani, 1992), ensuring methodological rigor and alignment with the study’s objectives.
To accurately capture the time-varying nature of financial market volatility and the behavioral effects of QE, this study employs the GARCH(1,1) and GJR-GARCH models. These models are particularly suited to analyzing stock return dynamics due to their ability to model volatility clustering a common feature in financial time series where large changes in returns tend to be followed by further large changes. The standard GARCH model, introduced by Bollerslev (1986), is effective in estimating conditional variance based on past shocks and past variances. However, it assumes symmetrical responses to market news. To address this limitation, we incorporate the GJR-GARCH model (Glosten et al., 1993), which introduces an asymmetry term that allows for leverage effects where negative shocks have a larger impact on volatility than positive shocks of equal magnitude. This is particularly relevant to our research questions, as investor behavior under QE may differ based on whether market conditions are improving or deteriorating. Furthermore, the inclusion of QE-specific dummy variables in the conditional variance equation enables us to assess whether feedback trading behavior and volatility responses intensify during periods of unconventional monetary easing. This approach allows us to quantify not only the existence of feedback mechanisms but also how they evolve in response to macroeconomic policy interventions.
Three GARCH models (GARCH, GJR-GARCH, and GJR-GARCH with QE) are employed in this study to test whether positive feedback behavior exists in American stocks, whether stock volatility exhibits an asymmetric effect, and how QE policies enhance positive feedback in the stock market.
Where,
Variable Construction and QE Phase Indicators
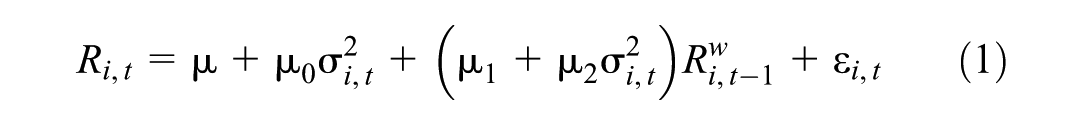
The variables, constructs, and operational definitions used in the following model equations are summarized in Appendix Table A1 for clarity and replicability. To estimate the sensitivity of positive feedback trading behavior, this study applies a volatility-dependent return specification based on Engle (1993), incorporating volatility asymmetry following Sentana and Wadhwani (1992). The model equations are as follows:
Return Equation:
Error Term Distribution:

Conditional Variance Equation (GJR-GARCH(1,1)):

Where Rw
i,t
is the return at time t for index i and Rw
i, t-1
is the lagged return representing trend-following behavior.
According to Sentana and Wadhwani (1992), when positive feedback effects dominate,
To estimate the conditional volatility of returns, we apply the GJR-GARCH model, which extends Bollerslev’s (1986) original GARCH formulation to account for volatility asymmetry. In this model:
GJR-GARCH Model With QE Factors
To assess how QE policy phases influence feedback trading dynamics, we introduce a QE dummy variable into the return equation. The model is specified as follows:
Extended Return Equation with QE Factor:

Error Term:

Variance Equation

Where
This specification allows us to isolate the behavioral impact of QE on momentum-driven investor behavior and assess whether policy-induced liquidity alters feedback sensitivity.
Empirical Results and Analysis
Descriptive Statistics
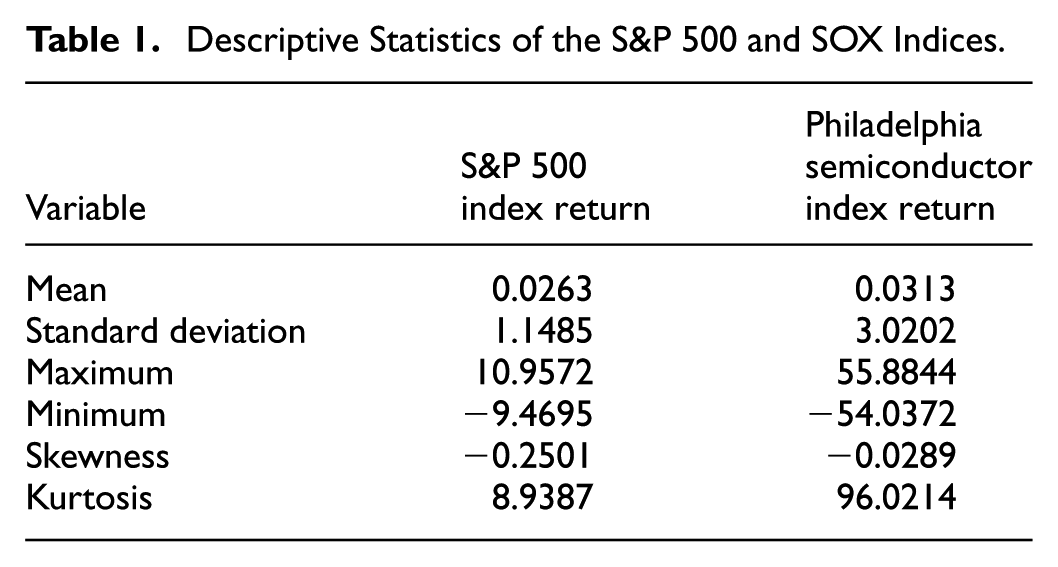
The descriptive statistics of the S&P 500 and SOX indices are summarized in Table 1. The mean returns for the S&P 500 and SOX are 0.0263 and 0.0313, respectively, while their standard deviations are 1.1485 and 3.0202. The higher standard deviation of SOX indicates greater return volatility compared to the S&P 500, reflecting heightened uncertainty in the semiconductor sector during unstable periods. The kurtosis for SOX (96.0214) is significantly larger than 3, suggesting a heavy-tailed distribution that aligns with the assumptions of the ARCH and GARCH models. Both indices exhibit negative skewness, indicating a tendency toward negative returns during the observation period.
Descriptive Statistics of the S&P 500 and SOX Indices.
Figures 1 and 2 display the S&P 500 index levels and returns, illustrating a significant market downturn that bottomed out in March 2009 after the implementation of QE1. Figures 3 and 4 depict similar trends for the SOX index, highlighting the severe contraction in the semiconductor sector due to reduced shipments and excess inventory during the financial crisis. These trends underscore the stabilizing effect of QE policies in reversing market declines and promoting recovery.

U.S. S&P500 stock index.
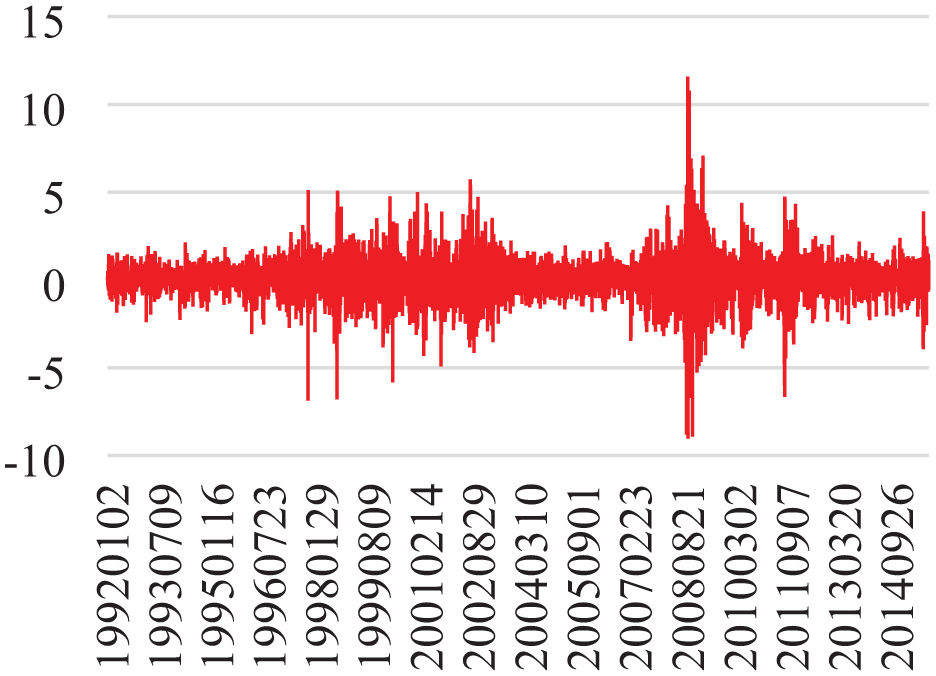
U.S. S&P500 stock returns.

Philadelphia semiconductor stock index.

Philadelphia semiconductor stock return.
Stationarity and ARCH Effects
The unit root test results, presented in Table 2, reveal that the price levels of the S&P 500 and SOX are non-stationary, as expected for financial time series. However, the return series for both indices are stationary at the 1% significance level across all tested models, confirming their suitability for further analysis using volatility models.
Unit Root Test Results for S&P 500 and SOX Returns.

Significant at the 10% level, ** at 5%, *** at 1%.
Volatility Asymmetry and Feedback Trading
The results of the ARCH tests, presented in Table 3, confirm the presence of volatility clustering for both indices, as evidenced by significant ARCH(1) and ARCH(4) statistics at the 1% level. Further asymmetry tests indicate that both the S&P 500 and SOX exhibit volatility asymmetry, with negative shocks having a greater impact than positive shocks. The significance of the joint tests supports the hypothesis of asymmetry in market volatility.
Results of Volatility Asymmetry Tests for S&P 500 and SOX.

Note.
Engle and Ng (1993) proposed four types of asymmetry volatility test. Sign bias test:
, **, and *** denote significance at the 10%, 5%, and 1% levels, respectively.
Comparative Results Across QE Phases
The results of the GARCH and GJR-GARCH models confirm the presence of significant positive feedback trading behavior in both the S&P 500 and SOX indices, underscoring the role of Quantitative Easing (QE) policies in amplifying market dynamics. Positive feedback trading, characterized by investors buying assets during price increases and selling during price declines, is evident in the statistically significant parameters across the models.
These findings are consistent with a growing body of literature emphasizing the amplification of momentum-driven trading strategies during liquidity-rich periods induced by QE. Chau and Deesomsak (2015) provide empirical evidence that positive feedback trading intensifies during phases of monetary easing across G7 economies, suggesting that accommodative policy environments reinforce behavioral trading patterns. Similarly, Schauten et al. (2015) find that hedge funds tend to engage in more pronounced feedback trading when liquidity is abundant, reinforcing market momentum and contributing to trend persistence. These results support the proposition that QE policies stimulate speculative behavior by altering investor expectations and risk perceptions.
The parameters α and β in the GARCH models consistently demonstrate the persistence of volatility clustering, where periods of high volatility tend to be followed by similar levels of volatility. For instance, in Model 1 for the S&P 500, β is highly significant at the 1% level (0.910), indicating strong persistence of volatility. This finding suggests that large market returns in the current period are likely to be followed by substantial returns in subsequent periods, a phenomenon commonly observed in financial time series.
The asymmetry parameter γ in the GJR-GARCH models provides further insights. For both indices, γ is significant at the 1% level in Models 3 and 4, highlighting that negative shocks exert a greater impact on market volatility than positive shocks. This asymmetry reflects investor sensitivity to adverse market news, which disproportionately amplifies volatility during periods of negative sentiment. The pronounced asymmetry observed in market volatility where negative shocks exert a stronger influence than positive ones is well documented in prior studies. Engle and Ng (1993) highlight that negative news tends to generate disproportionately larger increases in volatility due to investor loss aversion and market overreactions. Lin et al. (2011) further demonstrate that cross-border capital flows, particularly from non-hedging investors, can intensify volatility asymmetry, especially in sectors sensitive to global demand fluctuations. Consistent with this, Porras and Ülkü (2015) report that sectors with high foreign investor participation, such as technology and semiconductors, exhibit heightened volatility in response to adverse news, reinforcing our findings for the SOX index.
Notably, the Philadelphia Semiconductor Index (SOX) exhibits greater sensitivity to negative market shocks than the S&P 500, consistent with its higher volatility and risk profile.
The significance of parameters such as α (−0.6368 for the S&P 500 Model 1 and −3.4982 for the SOX Model 1) and other coefficients in Table 4 further confirms the existence of positive feedback trading behavior. This behavior is characterized by the tendency of investors to pursue price trends, exacerbating market momentum. Positive feedback trading not only contributes to price increases during bullish periods but also amplifies declines during bearish phases.
Estimation of Positive Feedback in GARCH and GJR-GARCH Models.

Note. In the GARCH model,
, **, and *** denote significance at the 10%, 5%, and 1% levels, respectively.
The incorporation of QE factors in the GJR-GARCH Model (Table 5) reveals a significant enhancement of positive feedback trading during QE periods. The coefficient for μ2 and μ3 before and after the crisis indicates significant differences at the 1% level for most QE phases, with the exception of QE3 for the Philadelphia Semiconductor Index. This finding suggests that QE policies—through liquidity injections and reduced borrowing costs—create an environment conducive to speculative trading and heightened investor optimism. The results also highlight that weekly returns exhibit stronger positive feedback effects compared to daily returns, indicating that longer time horizons allow for more pronounced market adjustments under QE conditions.
GJR-GARCH Model Results With QE Factors.

Note. QE is employed in the GJR-GARCH model, so model 5 is weekly returns. During QE,
, **, and *** denote significance at the 10%, 5%, and 1% levels, respectively.
The findings are larger return changes tend to be followed by similarly large changes in subsequent periods, a feature reinforced during QE phases. Both indices show heightened sensitivity to negative shocks, with SOX displaying greater asymmetry, underscoring its higher risk profile. So, QE significantly enhances positive feedback trading, fostering a cycle of rising prices and heightened market optimism. The findings of this study provide actionable insights for investors during QE periods:
Selective Stock Picking: Investors should focus on undervalued, high-performance stocks during market downturns. As these stocks gain traction during QE-driven recoveries, their prices are likely to rise, further stimulating investor optimism and positive feedback cycles.
Stop-Loss Strategies: To mitigate the risks associated with volatility clustering and asymmetry, investors should establish clear stop-loss points to manage potential downturns effectively. Without these safeguards, investors risk exacerbating losses during periods of heightened volatility.
These empirical results directly support the hypotheses developed in Section 2.4. The significant negative coefficients associated with positive feedback behavior during QE periods confirm H1, indicating that monetary easing fosters trend-following behavior. The strong and significant asymmetry parameters across models provide robust support for H2, where negative shocks induce greater volatility, particularly in the SOX index, consistent with its sector-specific risk exposure. The heightened sensitivity of SOX relative to the S&P 500 underlines H3, validating the premise that sectoral characteristics moderate the behavioral impact of QE. These findings are aligned with earlier works such as Chau and Deesomsak (2015) and Schauten et al. (2015), who document similar policy-induced feedback mechanisms in international markets.
Using the GJR-GARCH model with the addition of QE factors, this study examines the differences in the parameters μ2 and μ3 before and after the financial crisis, testing the hypothesis H0:μ2 = μ3. The results, summarized in Table 5, show that for most QE phases, H0:μ2 = μ3 is rejected at the 1% significance level, with the exception of QE3 for the Philadelphia Semiconductor Index (SOX). This indicates that QE policies significantly enhance positive feedback trading behavior, particularly during QE1 and QE2.
Key Findings from Model 5 is that the parameters for both the S&P 500 and SOX during QE periods indicate strengthened positive feedback trading behavior, as evidenced by significant coefficients in the GJR-GARCH model. Positive feedback trading reflects a pattern where investors buy assets experiencing price increases and sell those experiencing declines, thereby amplifying market trends. In addition, weekly returns show a more pronounced positive feedback effect compared to daily returns, suggesting that over longer time horizons, the influence of QE on market dynamics becomes more apparent. Thus, the asymmetry parameter γ consistently demonstrates that negative shocks have a more substantial impact on volatility than positive shocks. This sensitivity is particularly significant in the SOX, where negative news disproportionately increases market volatility, reflecting the sector’s higher risk profile and susceptibility to external shocks.
For the S&P 500, coefficients such as −0.6368 in Model 1 and −1.3729 in Model 4 are statistically significant at the 1% level, confirming strong positive feedback trading. These results illustrate that investors in this index tend to buy winners and sell losers, reinforcing upward trends during QE periods. The SOX demonstrates similar patterns, with coefficients such as −3.4982 in Model 1 and −3.9715 in Model 3 also significant at the 1% level. However, the sector’s heightened volatility, indicated by the significant asymmetry parameter γ, suggests greater vulnerability to adverse news, underscoring the unique dynamics of the semiconductor industry.
The addition of QE factors in the GJR-GARCH model highlights how monetary policy interventions amplify market trends; QE policies, by injecting liquidity and reducing borrowing costs, create an environment that fosters speculative trading and heightened investor confidence. This is particularly evident during QE1 and QE2, when both indices show significant positive feedback trading effects. While the overall QE period demonstrates enhanced positive feedback, QE3 shows less pronounced effects, particularly for the SOX, possibly reflecting diminishing marginal impacts of monetary easing in later phases.
A closer examination of the results reveals notable distinctions in the market responses across the three QE phases. During QE1, which was introduced in response to the global financial crisis, both the S&P 500 and SOX indices exhibit the strongest positive feedback trading effects and heightened volatility asymmetry. This may reflect a highly reactive investor environment, where elevated uncertainty and extreme undervaluation amplified behavioral responses to policy interventions. In contrast, QE2 still produced significant feedback trading patterns but with slightly diminished magnitude, suggesting that while liquidity injection continued to influence investor sentiment, the market had partially adjusted to unconventional monetary policy by this point. QE3, however, displays a more subdued effect especially in the SOX index possibly due to policy fatigue or expectations being increasingly priced into the market. These results suggest that the marginal behavioral and volatility effects of QE weaken over time, as markets adapt to continued easing and the novelty of intervention diminishes. Nonetheless, consistent evidence of volatility asymmetry and feedback trading across all three phases underscores the persistent influence of QE on investor behavior and market dynamics, even as the strength of these effects evolves.
Conclusion and Implications
This study investigated the impact of Quantitative Easing (QE) policies on the U.S. stock market, focusing on the S&P 500 and SOX indices. Using a comprehensive set of econometric tools, including unit root tests, ARCH effects, volatility asymmetry tests, and GARCH models, we examined whether QE policies stimulate economic growth, drive stock market performance, and enhance positive feedback behavior among investors.
The findings indicate that during the implementation of QE1, the Dow Jones Industrial Average rose by approximately 74%, followed by a 30% increase during QE2 and a 43% rise during QE3. These results suggest that the undervaluation of high-quality stocks at the onset of QE created significant investment incentives, leading to increased stock market participation. Positive feedback trading behavior where investors pursue rising trends and sell during declines was prevalent, contributing to volatility clustering, as captured by the GARCH model. Additionally, the analysis confirms the presence of asymmetric volatility, wherein periods of large (or small) market fluctuations tend to persist. These findings highlight the dual role of QE in fostering stock market growth and amplifying feedback trading mechanisms.
The observed patterns of positive feedback trading and volatility asymmetry carry important implications for market functioning and investor behavior, particularly when interpreted through the lens of behavioral finance. During QE periods, abundant liquidity and central bank signals of support may lead investors to overestimate market stability and underestimate downside risks a classic case of overconfidence bias. Simultaneously, herding behavior becomes more pronounced as investors mimic market trends, reinforcing upward momentum during bullish phases and accelerating sell-offs during downturns. These reactions are not entirely rational but are shaped by psychological responses to uncertainty, including loss aversion and FOMO. By embedding these mechanisms in our volatility framework, the study shows how unconventional monetary policy can unintentionally intensify feedback loops driven by investor sentiment, offering a more behaviorally grounded perspective on QE’s market effects.
From a behavioral finance perspective, these findings highlight the influence of cognitive biases such as herding and overconfidence in shaping market outcomes under unconventional monetary regimes. Recognizing these mechanisms is essential for regulators and institutional investors seeking to mitigate systemic risk, deploy stabilizing policy tools, or adjust portfolio strategies during periods of aggressive monetary easing.
Furthermore, the empirical patterns identified in this study are broadly consistent with prior research on the behavioral and financial market effects of QE. Sentana and Wadhwani (1992) provide early evidence of positive feedback behavior in daily stock returns, indicating that such dynamics may persist across varying market conditions and monetary regimes. More recent studies by Chau and Deesomsak (2015) and Cieslak et al. (2019) similarly demonstrate that feedback trading becomes more prominent during QE phases, as increased liquidity lowers perceived risk and encourages momentum-driven strategies. The observed volatility clustering and asymmetric responses in our GARCH-based models align with these behavioral interpretations, further validating the robustness and relevance of our findings. Our evidence of volatility asymmetry also parallels earlier findings from Sentana and Wadhwani (1992), but extends their work by explicitly linking asymmetric volatility to investor sentiment during QE episodes, rather than attributing it solely to price-based technical factors. This behavioral framing offers a more integrative and psychologically grounded view than traditional volatility-based approaches.
These findings may surprise readers familiar with the traditional macro-financial literature, which often emphasizes QE’s stabilizing role in asset markets. Contrary to the conventional assumption that QE uniformly reduces market volatility and promotes orderly investment, our results reveal that QE can exacerbate volatility asymmetry and reinforce momentum-based feedback trading, particularly in sectors like semiconductors. While our results are consistent with prior behavioral theories, few empirical studies have previously demonstrated this relationship using GARCH-family models with sector-level granularity. Thus, our study offers new evidence that QE may unintentionally fuel market instability through behavioral amplification mechanisms, challenging the prevailing view of QE as a purely stabilizing policy tool
Policy Implication and Limitation
The findings of this study offer several important implications for both policymakers and investors navigating QE driven financial markets. For policymakers, the evidence of enhanced positive feedback trading and volatility asymmetry during QE periods underscores the need for caution in designing and communicating unconventional monetary policies. Central banks should consider the behavioral distortions that may arise from prolonged liquidity injections, including inflated asset valuations, speculative trading, and broader financial instability. Incorporating macroprudential tools such as countercyclical capital buffers or risk-weighted asset controls could help temper excessive risk-taking. Transparent communication of exit strategies and forward guidance may also reduce overreactions and mitigate market mispricing driven by cognitive biases.
From a managerial standpoint, this study offers novel guidance for institutional investors and asset managers by revealing how QE amplifies behavioral trading biases in specific sectors, particularly in high-volatility, innovation-driven indices like the SOX. Unlike general macro-financial models that treat markets as homogenous, our findings show that feedback trading behavior is not uniform across market segments. This distinction helps managers better anticipate risk concentration, improve portfolio diversification across sector sensitivities, and adopt more adaptive risk management strategies under QE regimes. By accounting for behavioral volatility dynamics, asset managers can more effectively respond to central bank signals and mitigate exposure to trend following mispricing and downside volatility asymmetry.
For investors, understanding the behavioral dynamics triggered by QE is critical for risk management and strategic decision-making. The tendency for markets to exhibit heightened sensitivity to negative shocks under QE conditions suggests the need for more disciplined stop-loss strategies and broader portfolio diversification. Investors may also benefit from adopting contrarian or fundamentals-based approaches during periods of excessive optimism, as trend-following behavior can lead to momentum-driven mispricing. Additionally, monitoring central bank communication and macroeconomic indicators becomes increasingly important for anticipating regime shifts and adjusting asset allocations accordingly. Ultimately, awareness of feedback loops and volatility clustering during QE phases can empower investors to make more informed decisions and avoid the pitfalls of herd-driven sentiment.
These implications align with Christensen and Gillan (2024), who found that QE driven environments can increase institutional risk-taking, particularly in the presence of prolonged low interest rates and yield compression. However, while their study focuses on banking-sector risks, our findings contribute new insights from an equity market perspective, highlighting how QE alters behavioral patterns among broader investor groups, not just institutional portfolios.
Additionally, while the study demonstrates a relationship between QE and positive feedback trading, it does not fully disentangle the underlying psychological mechanisms driving this behavior. Future studies could explore how specific biases such as overconfidence, availability heuristics, and investor attention cycles interact with liquidity shocks and policy signals. Experimental designs or sentiment-based indices may further help quantify these psychological responses, enriching our theoretical understanding of the behavioral channels through which monetary policy affects market outcomes.
These recommendations are particularly timely given the recent shift from QE to quantitative tightening (QT) in major economies. With central banks reassessing the long-term impact of ultra-loose monetary policy, understanding how QE-induced behaviors affect market stability can guide the design of more balanced interventions in the future. Similarly, asset managers navigating today’s uncertain macroeconomic conditions can apply these findings to recalibrate their portfolios in anticipation of policy reversals, market overreactions, or liquidity shocks.
Limitations and Future Research
While this study provides valuable insights into the behavioral dynamics of QE and its influence on stock market volatility, several avenues remain open for future exploration. First, subsequent research could investigate how feedback trading behavior evolves under different monetary policy regimes, including interest rate hikes and tapering phases, to assess potential asymmetries in investor reactions.
Second, disaggregating investor types such as institutional versus retail participants or utilizing high-frequency trading data could help capture intraday behavioral shifts and uncover more granular dynamics during QE episodes. Third, incorporating sentiment indices or experimental methods could provide deeper insights into the psychological mechanisms such as fear, overconfidence, and confirmation bias that shape investor responses to unconventional monetary interventions.
In addition, future research could employ machine learning algorithms or agent-based simulations to model nonlinear behavioral responses to QE signals, particularly under conditions of heightened market uncertainty or financial stress. Comparative cross-country studies using panel GARCH models may further reveal how institutional frameworks such as capital controls, regulatory environments, and financial market development mediate the behavioral effects of QE across jurisdictions.
Prior studies, including Bailey et al. (2024), emphasize that QE influences expectations through performative signaling, suggesting that future work could also examine how central bank communication strategies not just liquidity levels affect behavioral trading responses in real time. Finally, extending this research to international markets would help clarify how QE induced behavioral effects propagate across borders, especially in emerging economies that are more sensitive to global liquidity conditions.
By pursuing these directions, future research can further deepen our understanding of the behavioral dimensions of unconventional monetary policy and contribute to more resilient, psychology-informed frameworks for financial market stability.
Footnotes
Appendix
Operational Definitions of Model Constructs and Variables.

| Variable/Construct | Symbol | Operational definition | Source/Notes |
|---|---|---|---|
| Return | Daily log return for index i at time t | Computed from index price data | |
| Lagged return | Rw i, t-1 | Return from the previous period t−1; used to model momentum or feedback trading | Sentana and Wadhwani (1992) |
| Risk-free return | μ | Constant term representing baseline return in absence of risk | Set as a constant |
| Conditional variance | Conditional variance of returns, modeled via GARCH or GJR-GARCH | Bollerslev (1986); Glosten et al. (1993) | |
| Innovation / Shock | Residual term from return equation; interpreted as market shock or “news” | GARCH error term assumption | |
| Risk–return relationship | Coefficient capturing sensitivity of return to conditional variance | Modeled empirically | |
| Feedback return effect | Sensitivity of current return to past return | Feedback/momentum trading | |
| Volatility-modified feedback | Volatility-weighted feedback coefficient; reflects strength of feedback trading behavior | Sentana and Wadhwani (1992) | |
| QE-modified feedback | Feedback trading effect during QE periods; estimated separately | Introduced in current study | |
| QE phase indicator | Dummy variable equal to 1 during QE1–3 periods and 0 otherwise | Follows QE calendar (Fed announcements) | |
| Volatility asymmetry | Coefficient on the indicator function for negative shocks in GJR-GARCH model | Glosten et al. (1993) | |
| Negative shock indicator | Equals 1 if <0, 0 otherwise | GJR-GARCH framework |
Funding
This study is supported by the Scientific Innovation Teams of GuangXi MinZu Normal University (KYTD202403).
Declaration of Conflicting Interests
The authors declared no potential conflicts of interest with respect to the research, authorship, and/or publication of this article.
Data Availability Statement
Data sharing not applicable to this article as no datasets were generated or analyzed during the current study.