
Abstract
Learning trajectories refer to the progression of students’ knowledge acquisition and skill development within a specific domain. By identifying students’ proficiency levels across specific knowledge points or attributes, cognitive diagnostic models (CDMs) allow researchers to systematically describe and analyze learning trajectories. This study utilized 42 eighth-grade mathematics items from the Trends in International Mathematics and Science Study (TIMSS) 2019 dataset and responses from 4,460 students across eight countries or regions. Based on seven attributes identified by the TIMSS framework, CDM was employed to investigate variations in learning trajectories across different content domains. Specifically, the study examined relationships between knowledge states and attribute patterns to identify distinct learning trajectories. The findings reveal that the United States and Dubai (UAE) exhibited only a single dominant learning trajectory, while other countries or regions demonstrated greater diversity in their students’ learning pathways. Across all contexts, most students tended to first master attributes related to geometry or data and probability, suggesting these areas as common starting points for skill development. These results highlight the potential of CDMs to uncover nuanced patterns of knowledge progression and inform tailored educational strategies.
Plain Language Summary
Mathematics learning should consider which knowledge to first introduce and which knowledge to talk about later. This article uses international data to analyze the order of learning mathematical knowledge in different countries and regions. These conclusions can be used to discuss the establishment of mathematics courses or textbook writing.
Introduction
In recent decades, the exponential advancement of science and technology has precipitated an unprecedented proliferation of novel knowledge. This deluge of information has necessitated a reevaluation of educational standards and curriculum design, compelling educators to emphasize more efficient and adaptive learning methodologies among students. Moreover, curricular reforms have increasingly prioritized the early introduction of advanced topics traditionally deferred to higher grade levels, thereby posing novel pedagogical challenges for educators. In response to these evolving educational dynamics, a rigorous scientific analysis of the hierarchical architecture of knowledge frameworks becomes imperative. The concept of learning trajectories provides a structured model for understanding the progressive mastery of knowledge within particular disciplinary contexts, acting as an integrative framework to inform both pedagogical strategies and student engagement. Learning trajectory reflects the natural developmental progressions identified in theoretically and empirically grounded models of students’ thinking, learning, and development (Carpenter & Moser, 1984; Griffin & Case, 1997). By integrating both theoretical principles and empirical evidence on human cognition and educational development, learning trajectories encapsulate the incremental and sequential nature of student learning. Educational systems that align curricula and instructional practices with these developmental trajectories are poised to deliver more streamlined and impactful pedagogical outcomes. Moreover, adhering to a scientifically derived teaching sequence, as defined by the learning trajectory, is believed to enhance student learning outcomes (Clements & Sarama, 2012). Thus, investigating the sequential acquisition of mathematical knowledge is crucial for facilitating effective math education.
The concept of learning trajectory has evolved as a theoretical framework for shaping mathematics instruction over recent decades. Simon introduced the notion of hypothetical learning trajectory (Simon, 1995) . This model delves into the rational structuring of teaching methods rooted in psychological theories, specifically focusing on children’s cognition and advancement within a specific mathematical domain (Clements, 2010). While investigating psychological developmental progressions or instructional sequences independently can yield valuable insights, the essence of learning trajectories lies in their inseparable linkages between these two realms (Clements & Sarama, 2012). Some studies propose that learning trajectory research in mathematics education progresses under the moniker of “learning progressions.” These frameworks encompass conjectures concerning the sequence and essence of the stages in students’ mathematical comprehension development, as well as the instructional milieu conducive to guiding them systematically toward their educational math objectives (Daro et al., 2011).
Learning trajectories serve not only as representations of regional pedagogical sequences but also as benchmarking tools for enhancing instructional practices across diverse international contexts. Early methodologies in the study of learning trajectories employed frequency or probability-based approaches (English, 1991, 1993). The foundational premise of this approach involves identifying critical junctures where significant shifts occur in students’ cognitive development processes. In a seminal study, Wu et al. (2020) examined the distinct learning trajectories in mathematics using data from the Program for International Student Assessment (PISA) 2012. Another notable study utilized nine statistical items from the PISA 2012 assessment to investigate learning trajectories in statistical knowledge (Jia et al., 2021). By analyzing response data from 30,092 students across 14 countries, the researchers employed a cognitive diagnostic model (CDM) to identify and characterize students’ progression through four key attributes of statistical understanding. This approach yielded insights into cross-national variations in how students develop statistical competencies. Beyond PISA, the Trends in International Mathematics and Science Study (TIMSS) holds significant sway as another pivotal international assessment. This study follows established research frameworks to explore mathematical knowledge learning trajectories from TIMSS data.
Research Questions
The study aims to address three key research questions:
Research Question (RQ)1: What are the characteristics of mathematical knowledge attribute mastery probability across different countries or regions?
Research Question (RQ)2: What are the characteristics of mathematical knowledge learning trajectories across different countries or regions?
Research Question (RQ)3: What commonalities and variations exist among mathematical knowledge learning trajectories across various nations or regions?
Trends in International Mathematics and Science Study
TIMSS is an international exam organized by The International Association for the Evaluation of Educational Achievement (IEA), which is a leading association that evaluates student achievement levels worldwide. TIMSS has been conducted every 4 years since 1995. The TIMSS measures students’ knowledge and skills in mathematics and science and collects information about their home and school environments. The TIMSS exam is divided into the fourth and eighth grade levels. The TIMSS uses questionnaires for students, teachers, and schools and other methods to assess student achievement.
The TIMSS provides participating countries or regions comparative data to help them re-evaluate their students’ learning. One of the main purposes of the TIMSS is to inform educational policy and compare countries or regions in terms of the quantity and quality of student learning (Shannag et al., 2013). A key component of the TIMSS is the evaluation of mathematical achievement. Mathematics is essential for the development of science and technology (Kusmaryono, 2014) and for people’s everyday activities and transactions (Rudhumbu & Rudhumbu, 2018). Mathematics can also foster critical thinking skills, reasoning, and problem-solving (Firdaus et al., 2015). Many studies have used TIMSS data to investigate mathematics as one of the core tests. For instance, some studies have examined how girls in Kuwait perform better than boys in Mathematics (Al-Mutawa et al., 2021), how school factors are significantly related to students’ achievement in the TIMSS (Wardat et al., 2022), and how socioeconomic status (SES) and TIMSS results in mathematics are mediated by two factors among Norwegian fifth graders (Østbø & Zachrisson, 2022). The test items and data of the TIMSS 2019 have been released, and the content domain, topic area, and cognitive domains of each item have been calibrated, facilitating the use of CDM for learning trajectory analysis.
Cognitive Diagnostic Model
CDM is a psychometric model that uses responses to analyze the mastery of the different attributes of subjects. This model is a new generation of measurement methods and has been widely used in educational and psychological research. The construction of the CDM is based on two elements. One element is the item and attribute association matrix called Q-matrix (Tatsuoka, 1983); the other is a list of models used to identify students’ potential cognitive characteristics or skill mastery patterns. Each row in the Q matrix represents which attributes are tested for an item, and each column represents which items are tested for each attribute. The Q matrix and the attribute patterns are insufficient. The process by which candidates respond based on these attributes must also be considered. These processes can be explained by CDMs.
The CDM describes how students answer items and how their responses relate to their attribute pattern, Q matrix, and responses. Different CDMs are available, such as deterministic input, the noisy-or-gate (DINO) model (Templin & Henson, 2006), the deterministic input noisy and gate (DINA) model (Junker & Sijtsma, 2001), the general DINA (GDINA) model (de la Torre, 2011), additive CDM (A-CDM; de la Torre, 2011), and the reduced reparameterized unified model (R-RUM, Hartz et al., 2002). CDMs serve as frameworks for explaining the various cognitive processes underlying examinees’ performance. Due to the inherent complexity of cognitive processes and the limitations in directly observing them, researchers typically rely on model selection techniques to identify the most appropriate CDM for a given dataset. By leveraging the Q-matrix, selected CDMs, and examinees’ response data, researchers employ statistical methods to model the answering process and infer examinees’ attribute patterns. Through this process of attribute pattern analysis, learning trajectories are derived, providing insights into students’ cognitive development and knowledge acquisition.
Materials and Methods
Methods and Materials
This study utilized publicly available data from 4,460 eighth-grade students from the TIMSS 2019 G8 assessment, selecting data from eight countries or regions: United Arab Emirates, Finland, Malaysia, Singapore, Chinese Taipei, the United States, and Abu Dhabi and Dubai of UAE. These countries or regions administered identical test booklets within the TIMSS framework. Based on TIMSS’s specifications regarding the attributes assessed by each item in the booklet, a Q matrix was constructed to map items to their corresponding knowledge and skill requirements. The most suitable cognitive diagnostic model (CDM) was selected based on both absolute and relative fit indices. Additionally, an item quality analysis was conducted to ensure the robustness and validity of the subsequent analyses. Through the application of the chosen CDM, students’ attribute mastery probabilities and attribute patterns were estimated. These estimates were then used to analyze variations in mathematical proficiency across different countries or regions by examining attribute mastery probabilities. Furthermore, the study explored the internal relationships among attribute patterns to map out students’ learning trajectories and investigated potential differences in these trajectories between countries or regions. All the data is available for download from the TIMSS public database. The number of students from each countries or regions is shown in Table 1.
The Number of Students From Each Countries or Regions.

Items
The students of these eight countries or regions all answered the same 43 items. However, the preliminary research revealed that the absolute fitting of item ME72180C failed (absolute fitting is introduced later). Therefore, item ME72180C was removed from this research. The usable items are shown in Table 2.
The Items for Research.

Details of these items are available on the TIMSS website.
Q Matrix
The Q-matrix shows which attributes are examined by the items. In the TIMSS, the attributes of the item examination are marked (IEA, 2019). This study directly used the existing item information. The attributes in the TIMSS included content and cognitive domains. The content domain included different topic areas. The definitions of these areas are shown in Tables 3 and 4.
Dimensions of Content Domain.

Dimensions of Cognitive Domains.
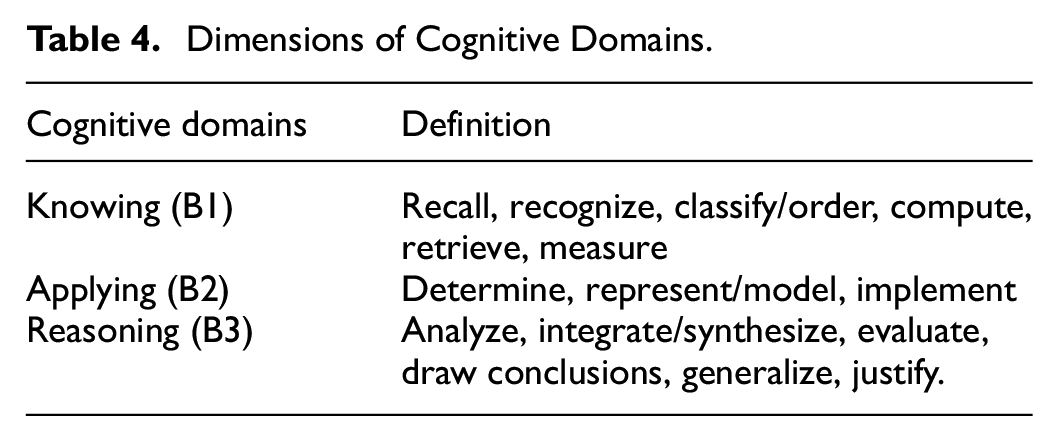
In Tables 3 and 4, the topic area includes all the content learned in the eighth grade, whereas the cognitive domain divides the cognitive difficulty. These two dimensions include students’ learning content and cognitive level. For consistency with existing research (see Wu et al., 2020), this study used the content and cognitive domains-built Q matrix. The Q matrix is shown in Table 5.
Q-Matrix of 17 Test Items in TIMSS.

Table 5 displays the Q matrix, which indicates the attributes tested by each item and the items that test these attributes. These attributes are identified by the TIMSS (IEA, 2019), but further analysis is necessary to determine if the data fit the CDM. To assess whether the data and the model fit, a two-step test involving both relative and absolute fit indicators is required.
Relative Fit
Relative fit is a statistic that describes the degree of matching between the theoretical and baseline models. Many cognitive diagnosis practices have shown that choosing an appropriate CDM is an important prerequisite for accurately diagnosing or classifying subjects (Tatsuoka, 1984). The most popular reference standards are Akaike’s information criterion (AIC) and the Bayesian information criterion (BIC). The result of model selection by the GDINA and CDM packages of the software R Studio Version 1.4.1103 is shown in Table 6.
The Result of the Model Selection.

Table 6 shows that GDINA has the minimum value for AIC and the BIC. Thus, GDINA should be selected as the CDM. The results of model selection show that some attributes influence each other, and some do not.
Absolute Fit
The effect of the GDINA model and data fitting needs further verification. This process is called absolute fit. Absolute fit evaluates whether a model really fits the data by judging the difference between the data and the alternative model. The root mean square error of approximation (RMSEA) is the most popular absolute fit statistics. If the RMSEA is less than 0.1, than the effect is very good (Oliveri & von Davier, 2011). The result of the RMSEA by the GDINA and CDM packages of the software R Studio Version 1.4.1103 is shown in Table 7.
The RMSEA of 42 Items.
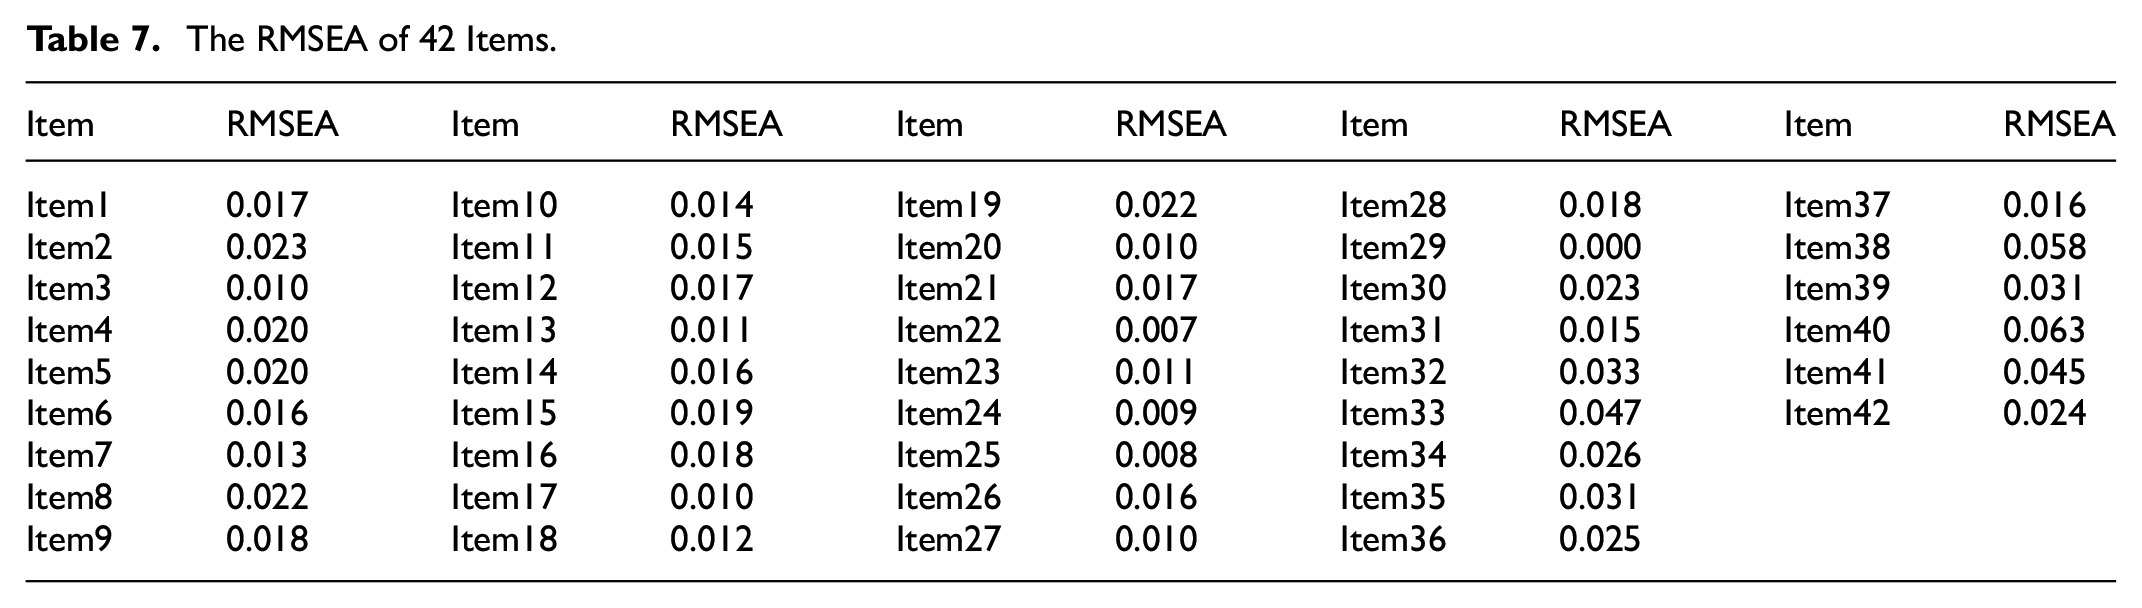
Table 7 shows that the maximum RMSEA value of the 42 items is 0.063, and the RMSEA values of all the 42 items are less than 0.1. SRMSR (the standardized root mean squared residual) is another fit indices to determine the quality of data fitting. SRMSR is a degree of the mean of standardized residuals between the predicted and the observed covariance matrices (Chen, 2007). The acceptable SRMSR values range between 0 and 0.08 (Hu & Bentler, 1999; Shafipoor et al., 2021). The result of SRMSR is 0.056, less than 0.08. Thus, the data fits the model very well. The results of relative fit and absolute fit show that using the GDINA model to analyze data is scientific and optimal.
According to the above results, the GDINA model presented the best model fit and a quality of the items. Thus, in the following study, the GDINA model was used to evaluate the parameters from the 4,460 responses.
Results
Results for Research Question 1
On the basis of the estimated mastery probability of each student on each attribute, the average mastery probability of each country and region on each attribute can be calculated, which is expressed as an average. The average mastery probabilities of the content and cognitive domains are shown in Figures 1 and 2.

Average mastery probability of content domain.

Average mastery probability of cognitive domain.
To address Research Question 1, Figure 1 shows the trends in average mastery probabilities for the content domain attributes. Students from different countries or regions have different average mastery probabilities on the four attributes. Dubai students have higher probabilities of mastery in all four levels than the UAE average, but the probabilities of mastery of Abu Dhabi students is lower than the average level of UAE. The students of Abu Dhabi and Dubai have opposite trends in the mastery of geometry attributes. This suggests that the learning trajectories of students in the two emirates may be different. Chinese Taipei, the United States, Malaysia, and Abu Dhabi (UAE) show a similar trend, that is, they have the best grasp of the geometry attribute. Singapore and Dubai (UAE) exhibit the opposite, that is, their curves show a decline in the probability of geometry attribute mastery. The students’ mastery probability curve of Finland is a check mark shape. Overall, students from Chinese Taipei and Singapore have better mastery of the four attributes than those from the other regions, while those from Abu Dhabi (UAE) perform the worst on the four attributes. A 2010 study showed that algebra and measurement problems are much more difficult than numbers, geometry, and data on a global scale (OECD, 2010). However, Figure 1 shows that among the eight countries or regions, only the students from Finland and the United States have a lower probability of mastering algebra than number. This suggests that changes in students’ mastery of different knowledge may occur over time. Students’ mastery of the number attribute is generally lower than that of the other three attributes.
To address Research Question 1, Figure 2 shows the trends in average mastery probabilities for cognitive domain attributes for students. The students from Singapore have the best mastery of cognitive domain attributes, while those from Abu Dhabi (UAE) have the lowest probability of mastering cognitive domain attributes. Students from Chinese Taipei, the United States, Finland, United Arab Emirates, and Abu Dhabi (UAE) are the worst at applying attribute, while those from Singapore, Dubai (UAE), and Finland have the lowest probability on reasoning attribute. This also shows that there are differences between UAE emirates.
Overall, mastery probabilities vary significantly across countries/regions. In content domains (Figure 1), Chinese Taipei and Singapore excel overall, while Abu Dhabi performs worst; geometry mastery rises in Chinese Taipei, US, etc., but falls in Singapore. Finland shows a check-mark shape, and number mastery is generally lowest. Historically, algebra was harder, but only Finland and US now have lower algebra than number mastery. In cognitive domains (Figure 2), Singapore is best, Abu Dhabi worst; students struggle with applying in Chinese Taipei, US, etc., and reasoning in Singapore, Dubai, etc. Differences exist within UAE emirates.
Results for Research Question 2
Attribute pattern is a vector of which attributes are mastered. Usually, 1 is used to represent that a certain attribute has been mastered (probability of mastery is greater than 0.5), and 0 is used to represent that a certain attribute has not been mastered (probability of mastery is less than 0.5). The main purpose of this research is to build a knowledge trajectory, so this part only reports the attribute mode of the content domain. The top three attribute patterns of proportion in the content domain are shown in Table 8.
The Three Most Frequency Patterns in Content Domain.

Table 8 indicates that eight countries or regions are quite differentiated in the content domain. Half of the students in Singapore and Chinese Taipei have mastered all four attributes, but most of the students in United Arab Emirates (include Abu Dhabi and Dubai), Finland, and Malaysia have mastered none of attributes.
Learning trajectories can be constructed according to attribute patterns. The basic idea is that internal hierarchical relationships exist between different attribute patterns. The learning trajectory assumes that students learn easy knowledge first and difficult knowledge later. A learning trajectory is a learning procedure from a simple knowledge structure to a complex knowledge structure. Therefore, the attribute hierarchy reflects the order of attribute learning. For example, the three most frequently mastered attribute patterns by Chinese Taipei students are (1,1,1,1), (0,0,1,0), and (1,1,1,0). Thus, students first master the third A3 attribute Geometry, and the last attribute they master is A4 Data and Probability. That is, from the order point of view, (1,1,1,0)→(1,1,1,1) is reasonable. The biggest advantage of cognitive diagnostic assessment is that it can grasp the cognitive laws of the subjects more deeply than content assessment (Wu et al., 2020). Next, the learning trajectory is constructed according to the frequency of attribute patterns in different countries or regions for the content domain. The result is shown in Figure 3.

Learning trajectories of eight countries or regions.
To address Research Question 2, Figure 3 shows the learning trajectories for the eight countries or regions. The solid line is the primary learning trajectory, and the dashed line is the secondary learning trajectory. The Dubai and Unite States has only one main learning trajectory, whereas other countries or regions show diversity. The trajectories are not only directly related to the cognitive order of students but also influenced by factors such as curriculum arrangements and extracurricular tutoring (De Lange, 2007). Thus, differences in learning trajectories exist across countries or regions. Figure 3 shows that primary learning trajectory of Finland is same as the secondary learning trajectory of Malaysia. Explain that there are connections and differences in mathematics learning within different countries. All the students master A3 geometry or A4 data and probability first, indicating that these attributes are easier for students to master than the other attributes. Wu found that most students first master uncertainty and data (Wu et al., 2020), Figure 3 shows that students in Dubai, UAE, Finland, and Singapore have the same characteristics. He also found that most students master space and shape last (Wu et al., 2020), the TIMSS data shown that Dubai, UAE, and Singapore reflect this feature.
Results for Research Question 3
Learning trajectories of different countries or regions are shown on Table 9.
The Learning Trajectories of Different Countries or Regions.
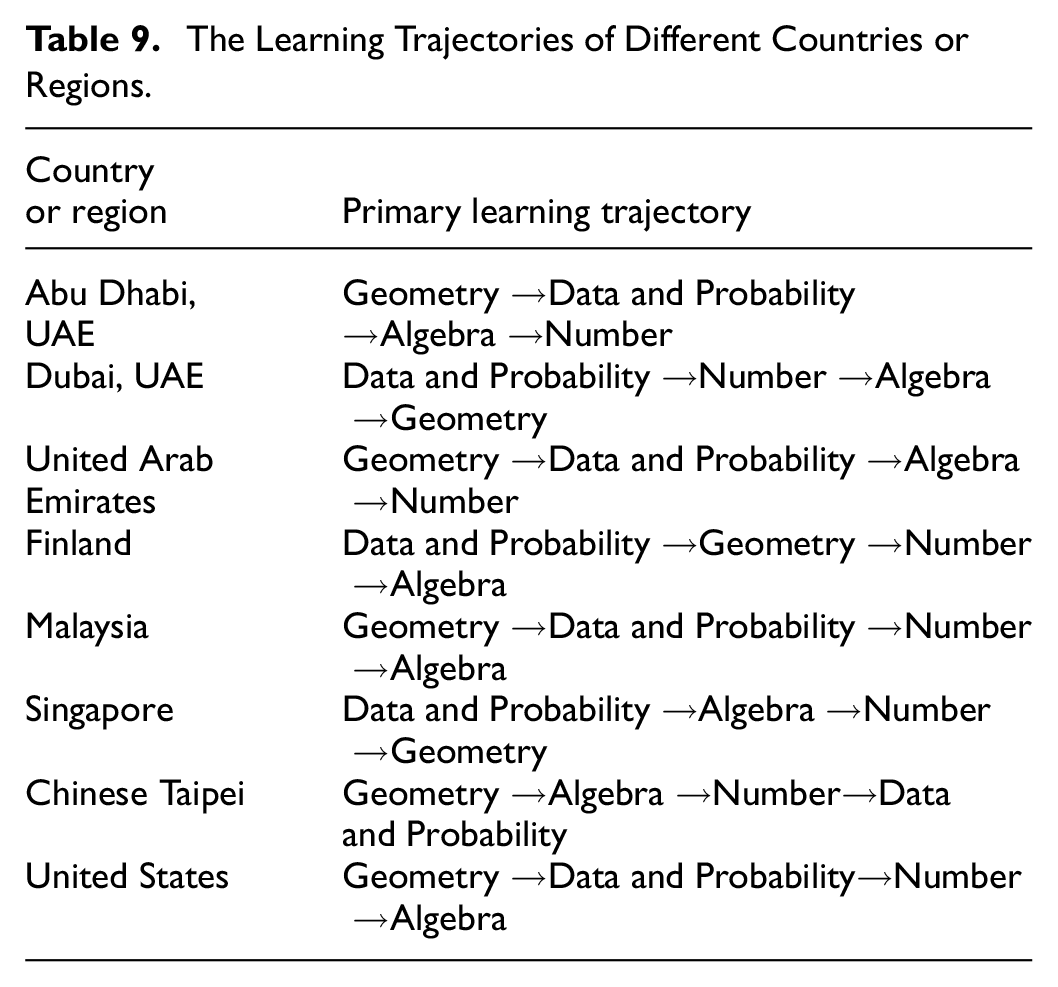
To address Research Question 3, Table 9 shows that there are no learning trajectories of different countries or regions starting with Algebra or Number or ending with Data and Probability. This reflects common characteristics of different countries or regions in education. This means that other countries or regions can also refer to this conclusion when teaching. Learning trajectories were constructed based on hierarchical mastery of content domain attributes (Number, Algebra, Geometry, and Data/Probability). Results revealed significant regional variations. For instance, Singapore and Chinese Taipei exhibited high mastery across all attributes, with about 50% of students mastering all four content domains. Conversely, UAE (excluding Dubai), Finland, and Malaysia showed lower overall proficiency, with most students mastering none or few attributes. Notably, intra-country disparities emerged: Dubai (UAE) outperformed Abu Dhabi in Geometry, while Abu Dhabi prioritized Data/Probability.
The analysis identified both universal patterns and regional idiosyncrasies. Commonalities included: Firstly, sequential prioritization: All regions prioritized Geometry or Data/Probability as initial learning nodes, suggesting these domains are cognitively or pedagogically foundational. Secondly, avoidance of Algebra/Number as endpoints: No trajectory concluded with Algebra or Number, implying systemic recognition of their complexity. Thirdly, constrained diversity: Only six unique trajectories emerged from 24 possible permutations, indicating shared hierarchical logic. Variations included: Firstly, Intra-country disparities: UAE’s emirates (Dubai vs. Abu Dhabi) diverged sharply in Geometry/Data emphasis, likely reflecting localized curricula. Secondly, curricular influence: Singapore’s centralized curriculum produced a singular, efficient trajectory (Geometry→Algebra→Number→Data), whereas the U.S. and Malaysia exhibited bifurcated pathways, possibly due to decentralized educational policies. Thirdly, cognitive thresholds: Chinese Taipei and Singapore achieved full attribute mastery (1,1,1,1) for 50% of students, whereas Finland’s “checkmark” trajectory (partial mastery peaks) suggested intermediate skill stagnation. These findings underscore the interplay between cognitive development, curricular design, and regional policy in shaping trajectories, as posited by De Lange (2007).
The findings partially align with prior research while revealing nuanced discrepancies. Consistent with OECD (2010), Algebra and Number emerged as challenging domains globally, yet this study observed exceptions: Finnish and U.S. students struggled more with Algebra than Number, contradicting textbook sequencing where Number typically precedes Algebra. This suggests evolving curricular challenges or pedagogical gaps. Similarly, Wu et al. (2020) identified Data/Probability as the simplest attribute, corroborated here for Dubai, UAE, Finland, and Singapore. However, differences arose in attribute hierarchies: Wu’s study on PISA (15-year-olds) reported late mastery of Geometry, whereas TIMSS (Grade 8) data showed Geometry as an early milestone for most regions. This divergence may stem from age-related cognitive development or assessment frameworks (PISA’s applied focus vs. TIMSS’s content specificity).
Discussion
This study advances the understanding of cross-national mathematical learning trajectories by integrating cognitive diagnostic modeling with TIMSS data. The application of the GDINA model revealed distinct hierarchical patterns in content domain mastery across eight countries/regions, while identifying both shared tendencies and localized divergences. A key finding is the prioritization of Geometry or Data/Probability as initial learning nodes in all regions, which suggests these domains serve as cognitive gateways for adolescent learners. The results partially reinforce prior studies: consistent with OECD (2010), Algebra and Number remained challenging globally, yet the Finnish/U.S. exception highlights the dynamic interplay between curriculum design and learning outcomes. Notably, the absence of trajectories concluding with Algebra/Number underscores systemic recognition of their complexity, while the limited diversity of pathways (six trajectories vs. 24 possible permutations) implies universal hierarchical logic in mathematics education. These findings advocate for policy reforms emphasizing adaptive teaching strategies aligned with diagnostic insights. Future research should expand to underrepresented regions and longitudinal designs to track trajectory evolution.
Limitations
Several important limitations of this study should be acknowledged. Firstly, it focuses on a subset of countries or regions involved in the TIMSS exam, utilizing data from TIMSS 2019 and responses from 4,460 students across 8 countries or regions. This selection was necessitated by the variability in test items among countries or regions. However, from the perspective of international exams, the amount of data is insufficient because students in each country and region are divided into different groups for testing. Some of the test questions in different groups are the same and some are different. Therefore, the number of students that answer the same topic is insufficient. To comprehensively discuss data from all participating nations, employing the item-linking method as proposed by van der Linden and Barrett (2016) would be essential in the future. Secondly, the study only examines 7 attributes, encompassing 4 content domains and 3 cognitive domains, to construct learning trajectories primarily based on content domains. While the study delves into the content domain, it omits discussion on the cognitive domain. Incorporating the cognitive domain is crucial for enhancing the accuracy of content domain data, as well as for broadening the scope beyond the predominant focus on content domains in learning trajectory studies. Considering the potential of Topic Areas in constructing learning trajectories, future investigations could explore this avenue further. Furthermore, the study’s reliance solely on TIMSS exam data presents limitations inherent to international assessments. To address this, future analyses could involve aggregating results from different test such PISA to better capture learning trajectories.
Footnotes
Acknowledgements
First and foremost, I would like to show my deepest gratitude to my wife and son. They are my driving force. Second, I want to thank all my friends for their encouragement and support.
Ethical Considerations
The ethics statement for animal and human studies is not applicable to this research.
Author Contributions
ZZ designed the study, wrote this manuscript, reviewed the manuscript and provided comments. BJ wrote the text, proofread the data, created the charts, and provided targeted answers to the reviewers’ questions. The author contributed to the article and approved the submitted version.
Funding
The authors disclosed receipt of the following financial support for the research, authorship, and/or publication of this article: This research was partially supported by the Beihua University Youth Innovation Team, Teaching Reform Project of Higher Education in Jilin Province Research on the Application of Knowledge Graph in Curriculum Structure Design and Implementation: Taking “Educational Research Methods” as an Example (No. SJZD20250002).
Declaration of Conflicting Interests
The authors declared no potential conflicts of interest with respect to the research, authorship, and/or publication of this article.
Data Availability Statement
Data sharing not applicable to this article as no datasets were generated or analyzed during the current study.