
Abstract
Large-scale assessments are generally designed for summative purposes to compare achievement among participating countries. However, these nondiagnostic assessments have also been adapted in the context of cognitive diagnostic assessment for diagnostic purposes. Following the large amount of investments in these assessments, it would be cost-effective to draw finer-grained inferences about the attribute mastery. Nonetheless, the correctness of attribute specifications in the Q-matrix has not been verified, despite being designed by domain experts. Furthermore, the underlying process of TIMSS (Trends in International Mathematics and Science Study) assessment is unknown as it was not developed for diagnostic purposes. Thus, this study suggests an initial validating attribute specifications in the Q-matrix and thereafter defining specific reduced or saturated models for each item. In doing so, the two analyses were validated across 20 countries that were selected randomly for TIMSS 2011 data. Results show that attribute specifications can differ from expert opinions and the underlying model for each item can vary.
Introduction
A recent popular psychometric model, called cognitive diagnosis model (CDM), in contrast to classical test theory (CTT) and item response theory (IRT), aims to mainly investigate a specific finer-grained set of multiple skills within a domain of interest. These predefined skills are used to classify examinees based on whether they have mastered or not. This is a critical point where CDMs differ from the other two commonly used unidimensional test theories. The CTT and IRT usually locate and assess examinees on an ability continuum by a single overall test score. Instead of reporting a single overall score, CDMs provide pedagogical information by which students’ strengths and weaknesses regarding the acquisitions of specific skills in a domain can be identified. Therefore, CDMs serve important purposes, such as offering a more precise tool to diagnose academic needs and creating a different perspective to design a better learning environment.
Till date, several models and methodological developments have been introduced in the context of cognitively diagnostic assessments (CDAs). In terms of model developments, two types of CDMs have been proposed, classified as reduced and general models. Specifically, the deterministic inputs, noisy “and” gate (DINA; Haertel, 1989; Junker & Sijtsma, 2001) model, the deterministic input, noisy “or” gate (DINO; Templin & Henson, 2006) model, compensatory and reduced reparameterized unified model (C-RUM and R-RUM; Hartz & Roussos, 2008), the additive CDM (A-CDM; de la Torre, 2011), and the linear logistic model (LLM; de la Torre & Douglas, 2004) are examples of reduced models. The general diagnosis model (GDM; von Davier, 2005), the log-linear diagnostic classification model (Henson, Templin, & Willse, 2009), and the generalized DINA model (G-DINA; de la Torre, 2011) are examples of generalized models. Although developing new models with peculiar assumptions, researchers have encountered new theoretical and practical issues. These concerns have led to considerable advances in methodological developments in various studies, such as the model-data fit (Chen & de la Torre, 2014; Chen, de la Torre, & Zhang, 2013; Cui & Leighton, 2009; Sen & Bradshaw, 2017), inferential item-fit evaluation (Sorrel, de la Torre, Abad, & Olea, 2017), person fit evaluation (Liu, Douglas, & Henson, 2009), Q-matrix validation (Chiu, 2013; DeCarlo, 2011; de la Torre, 2008; de la Torre & Chiu, 2016; Liu, Xu, & Ying, 2012; Terzi, 2017; Terzi & de la Torre, 2018), empirical applications of CDMs (Akbay, Terzi, Kaplan, & Karaaslan, 2018; Dogan & Tatsuoka, 2008; Lee, Park, & Taylan, 2011; Tjoe & de la Torre, 2014), and computerized adaptive testing in CDM (Cheng, 2009; Hsu, Wand, & Chen, 2013; Kaplan, de la Torre, & Barrada, 2014).
Generally, international large-scale exams (e.g., TIMSS; Trends in International Mathematics and Science Study) have been analyzed with IRT models, which provide a single total score for each examinee. With recent advancements in CDAs, however, there has been a trend toward providing more elaborate results on testing practices. A number of CDMs have been developed to obtain more detailed test results (Rupp, Templin, & Henson, 2010). The shift from single score reporting practices to CDM approaches has also been applied to TIMSS data in several studies (Birenbaum, Tatsuoka, & Yamada, 2004; Choi, Lee, & Park, 2015; Dogan & Tatsuoka, 2008; Im & Park, 2010; Lee et al., 2013; Lee et al., 2011; Liu, Huggins-Manley, & Bulut, 2018; Sen & Arıcan, 2015; Toker & Green, 2012). The applied diagnostic models have varied on these studies. These applications of CDMs to TIMSS data can be considered examples of retrofitting of CDMs to large-scale assessments, which have been generally developed and analyzed with IRT or CTT. For example, the rule space method has been used in several studies, including Im and Park (2010), Toker and Green (2012), Dogan and Tatsuoka (2008), and Birenbaum et al. (2004). Another example is that the TIMSS data have been analyzed using one of the commonly used reduced models, the DINA model, as highlighted by Lee et al. (2011), Lee et al. (2013), Choi et al. (2015), and Sen and Arıcan (2015). While carrying out these types of relevant analyses, CDMs typically assume that the test was developed based on specific attributes and a Q-matrix (Tatsuoka, 1983), which relates test items to particular attributes. For instance, Lee et al. (2011) focused on the DINA model with two purposes in view—to identify item characteristics and to investigate the mastery of attributes. Two main limitations of Lee et al. (2011)’s study were solely relying on the domain experts for attribute specifications without validating the correctness of attribute specifications and assuming the DINA model as the underlying correct model without evaluating model-data fit.
Moreover, the underlying process of TIMSS assessment for each item is unknown because it was not developed for diagnostic purposes. Nonetheless, nondiagnostic assessments can still be adapted for diagnostic purposes (Chen & de la Torre, 2014). As such large-scale assessments are not designed to obtain diagnostic information given the intensive efforts required, retrofitting multidimensional CDMs to these assessments can provide a way of obtaining the benefits of CDMs based on the current promises (Liu et al., 2018). Given the opportunity, large-scale assessments (TIMSS and PISA) have been adapted in the context of CDA. Considering the large amount of investments in these assessments, it would be cost-effective to draw finer-grained inferences about what attributes students have or have not mastered (Chen & de la Torre, 2014). Thus, there is need to emphasize the importance of doing CDA analyses using such large-scale data sets.
In particular, Chen et al. (2013) proposed a systematic procedure to adapt large-scale assessments in the context of CDM using the following steps: constructing initial and final attributes, and Q-matrix; evaluating reduced CDMs; and cross-validating the selected models. Chen et al. (2013) demonstrated using 26 released items in reading-domain of the Program for International Student Assessment (PISA), administered in 2000; initial attributes were defined by domain experts, followed by statistical analyses based on absolute and relative fit indices. After redefining those initial attributes and Q-matrix specifications, the selected Q-matrix was evaluated across reduced CDMs. Finally, the results were investigated using data from different countries. However, in Chen et al. (2013)’s study, attribute specifications were not validated using statistical procedures. Therefore, validating the correctness of attribute specifications in the Q-matrix and then defining a specific reduced or general model for each item, if possible, should be one of the earlier steps to be taken. Otherwise, attribute misspecifications in the Q-matrix and model-data misfit can classify examinees into inaccurate latent classes.
Purpose of the Study
Using the eighth-grade mathematics section of the TIMSS 2011 assessment (Mullis, Martin, Foy, & Arora, 2012), this study has three purposes. The first purpose is to validate attribute specifications in the Q-matrix under the G-DINA model in that any reduced model needs not to be known. Rather than constructing the Q-matrix of the test, it was adapted from Şen and Arıcan (2015). The validation of attribute specifications was implemented by the G-DINA model discrimination index (GDI; de la Torre & Chiu, 2016). After verifying the correctness of attribute specifications, the second purpose is to define the most appropriate model. This step is important because the fit of the model to the data should be evaluated (Chen et al., 2013). The Wald test used to investigate the item-level fit of a saturated CDM relative to the fitting of three reduced models (DINA, DINO, and A-CDM) was carried out (de la Torre & Lee, 2013). The third purpose is to validate results across 20 countries that were selected randomly.
Background
Q-Matrix
Regardless of assuming a reduced or general model, the Q-matrix is a crucial component of CDMs, in that each item is associated with the required attributes to be mastered by examinees for correctly answering the item. Let
The process of constructing the Q-matrix typically involves experts’ judgments that could be considered subjective in nature. This can cause serious validation problems as a result of inaccurate parameter estimation and attribute classifications. Moreover, there have been some studies implemented for Q-matrix validation (Chiu, 2013; DeCarlo, 2011; de la Torre, 2008; de la Torre & Chiu, 2016; Liu et al., 2012; Terzi & de la Torre, 2018).
Saturated and Reduced CDMs
The primary purpose of CDMs is to classify examinees into latent classes based on which among K attributes have been mastered. This classification procedure differs because of the underlying model. At this point, saturated and reduced CDMs play various roles. For instance, among the reduced CDMs, the DINA is a commonly used model that classifies examinees into two groups, those who have mastered all the required attributes and those who have not mastered at least one of the required attributes. In other words, in the DINA model, examinees have to master all the required attributes; otherwise, nonmastery of even one of the required attributes can result in answering the item incorrectly. However, in the DINO model, mastery of even one of the required attributes would be enough to answer the item correctly. There is also another type of reduced models, which are additive in nature for instance, the A-CDM, the LLM, and the R-RUM, with different link functions (de la Torre, 2011) have the cumulative probability of success associated with one attribute that has an independent impact from other attributes. Because of the same nature rather than being based on different link functions, among these additive models, the A-CDM (i.e., additive) is used in this study in addition to the DINA model (i.e., conjunctive) and DINO model (i.e., disjunctive) associated with different condensation rules.
Nonetheless, each of these three reduced models has its own limitations. The G-DINA model is a generalization of the DINA model that partitions examinees into

where
As earlier mentioned, if all the parameters in Equation 1 are set to zero except for

where
These models were compared and contrasted in a number of studies for various purposes (Chen & de la Torre, 2014; de la Torre & Lee, 2013; Liu et al., 2018; Ma, Iaconangelo, & de la Torre, 2016; Sorrel et al., 2017). Such studies demonstrated the importance of implementing model-data fit analyses. Focusing on model-data fit at the item level is crucial because using a single model for all the test items does not reflect the reality according to current empirical applications (Sorrel et al., 2017). Thus, this present study aims to carry out model-data fit analyses after verifying the correctness of attribute specifications in the Q-matrix.
Given the purpose of this study, the next section of this article first presents information about the data source and statistical procedures implemented. Second, results regarding the Q-matrix validation and model-data fit evaluation are provided in the following section, followed by summary and discussions.
Method
Data Source
TIMSS 2011 eighth-grade mathematics responses from the students of 20 countries (e.g., Australia, Bahrain, Italy, Korea, Malaysia, Romania, Turkey, and the United States) were randomly selected for this study (Table 1). The administration of Booklet 2 to students from these countries was selected for CDM analyses in this study. Booklet 2 was composed of 32 items, including 15 multiple choice and 17 constructed response items. The sample sizes ranged from 272 (England) to 743 (the United States) students who took Booklet 2.
Average Scale Score for the TIMSS 2011 Eighth-Grade Participants.
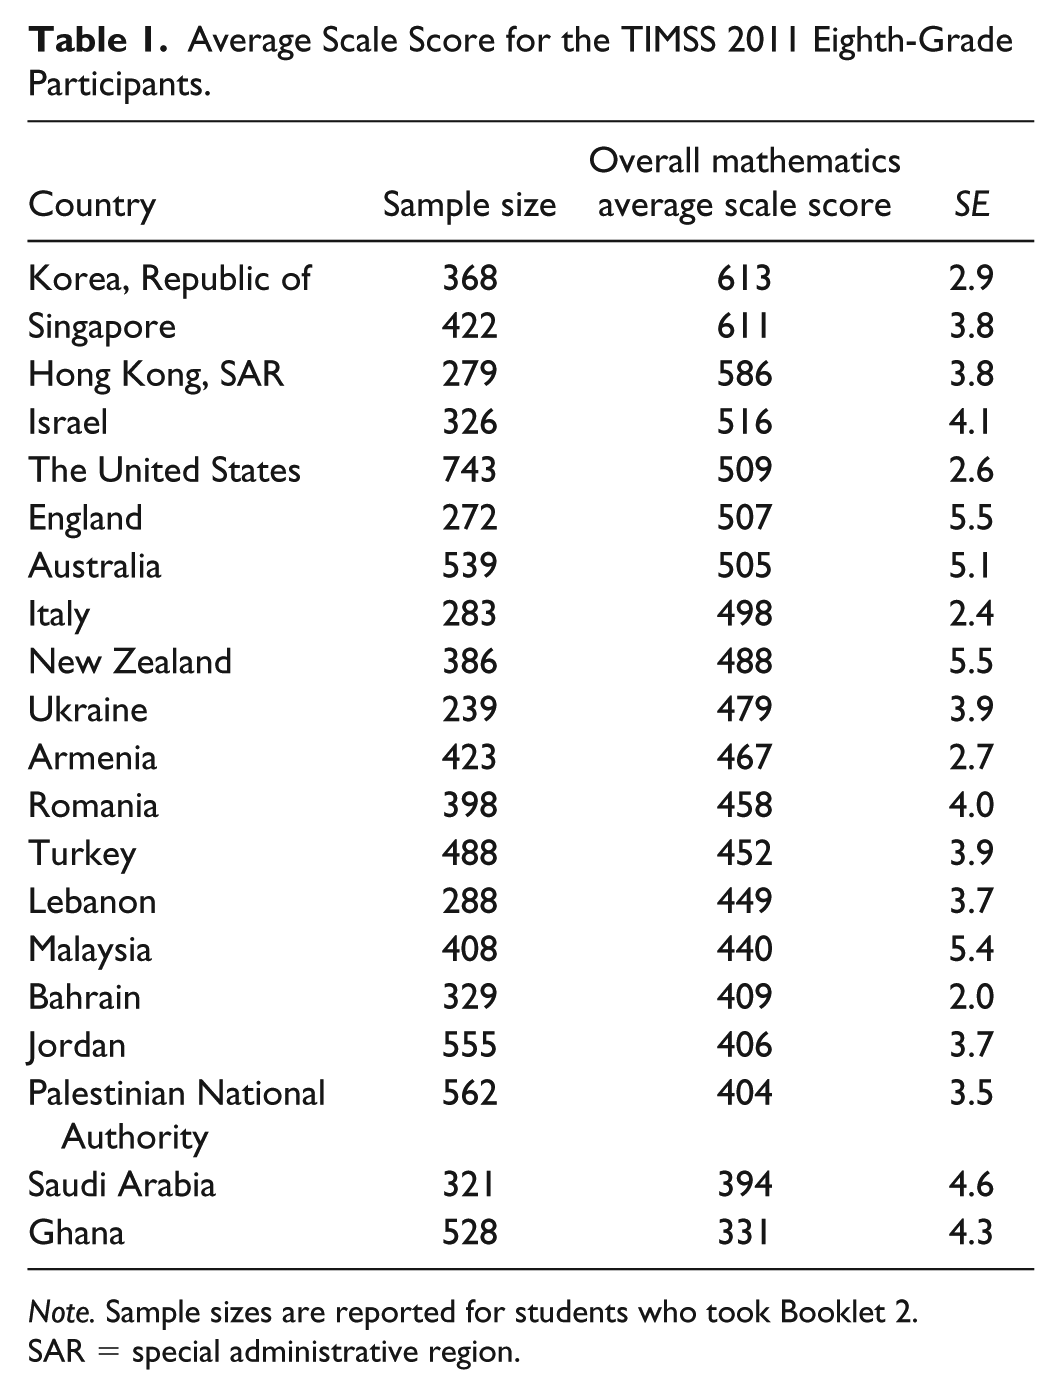
Note. Sample sizes are reported for students who took Booklet 2.
SAR = special administrative region.
In addition to test items, CDM analyses require constructing a Q-matrix that shows relationships between items and attributes, which are required to correctly answer the items. The attributes of Q-matrix in this study were adapted from the Common Core State Standards for Mathematics (Common Core State Standards Initiative, 2010). Table 2 presents attribute description for each content domain reported by TIMSS researchers (Mullis et al., 2012), and subattributes were determined by four experts in mathematics education (Şen & Arıcan, 2015). Note that as Items M052503A and M052503B were the same in the original 32-item list, one of them (Item M052503A) was dropped from the Q-matrix (Sen & Arıcan, 2015), thus, a total of 31 items was used in this study.
Attributes Adopted From the Common Core State Standards Initiative (2010).

Similar to Hou’s (2013) study, because sample sizes of the randomly selected countries were limited for the G-DINA model estimation, Q-matrix validation and model-data fit evaluation were separately carried out at the attribute level and content domain level. For example, the Q-matrix for each content domain displayed in Table 3 was used in this study. That is, items in each content domain were defined if there is need for a particular attribute to answer the item correctly in the corresponding content domain. At the content domain level shown in Table 4, each domain was specified as an attribute if a particular domain is required to answer the item correctly. That is, four content domains were adapted as the attributes without disaggregating them into the 13 finer-grained attributes. The analyses were implemented in the Ox language (Doornik, 2009).
Q-Matrix for Each Content Domain.
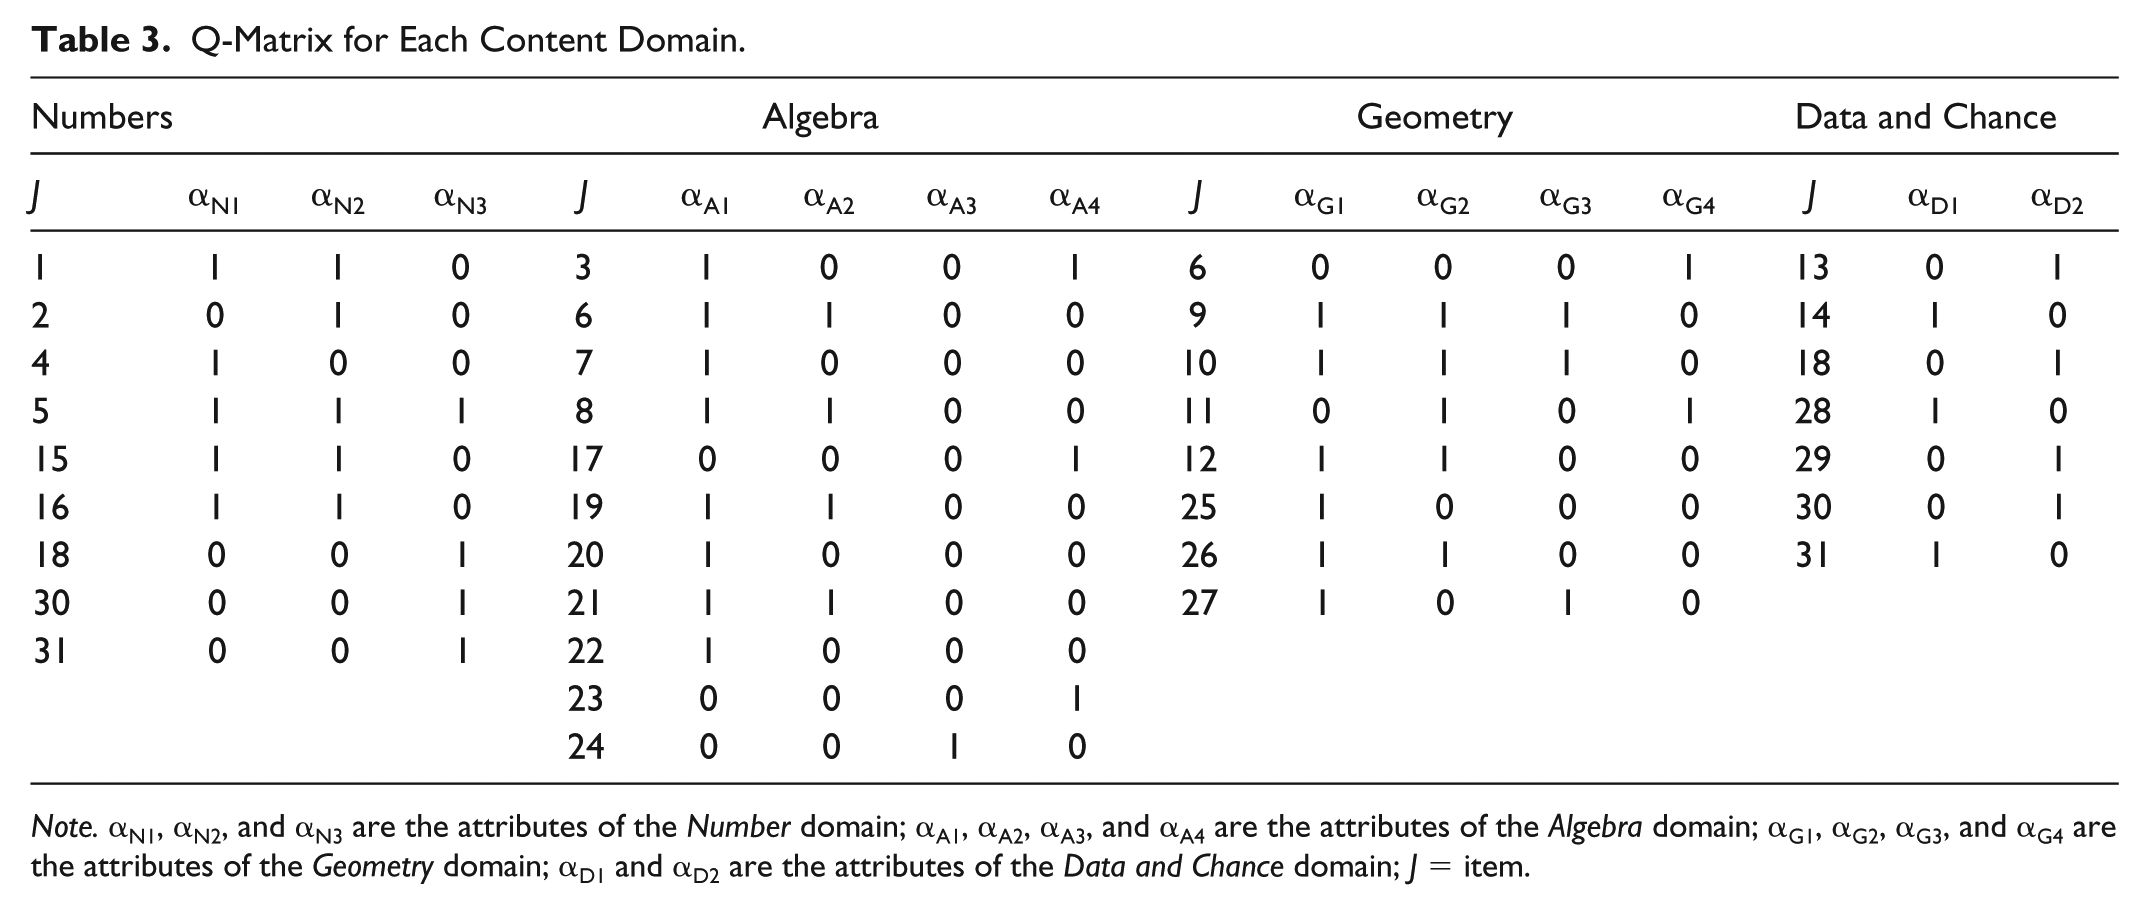
Note. αN1, αN2, and αN3 are the attributes of the Number domain; αA1, αA2, αA3, and αA4 are the attributes of the Algebra domain; αG1, αG2, αG3, and αG4 are the attributes of the Geometry domain; αD1 and αD2 are the attributes of the Data and Chance domain; J = item.
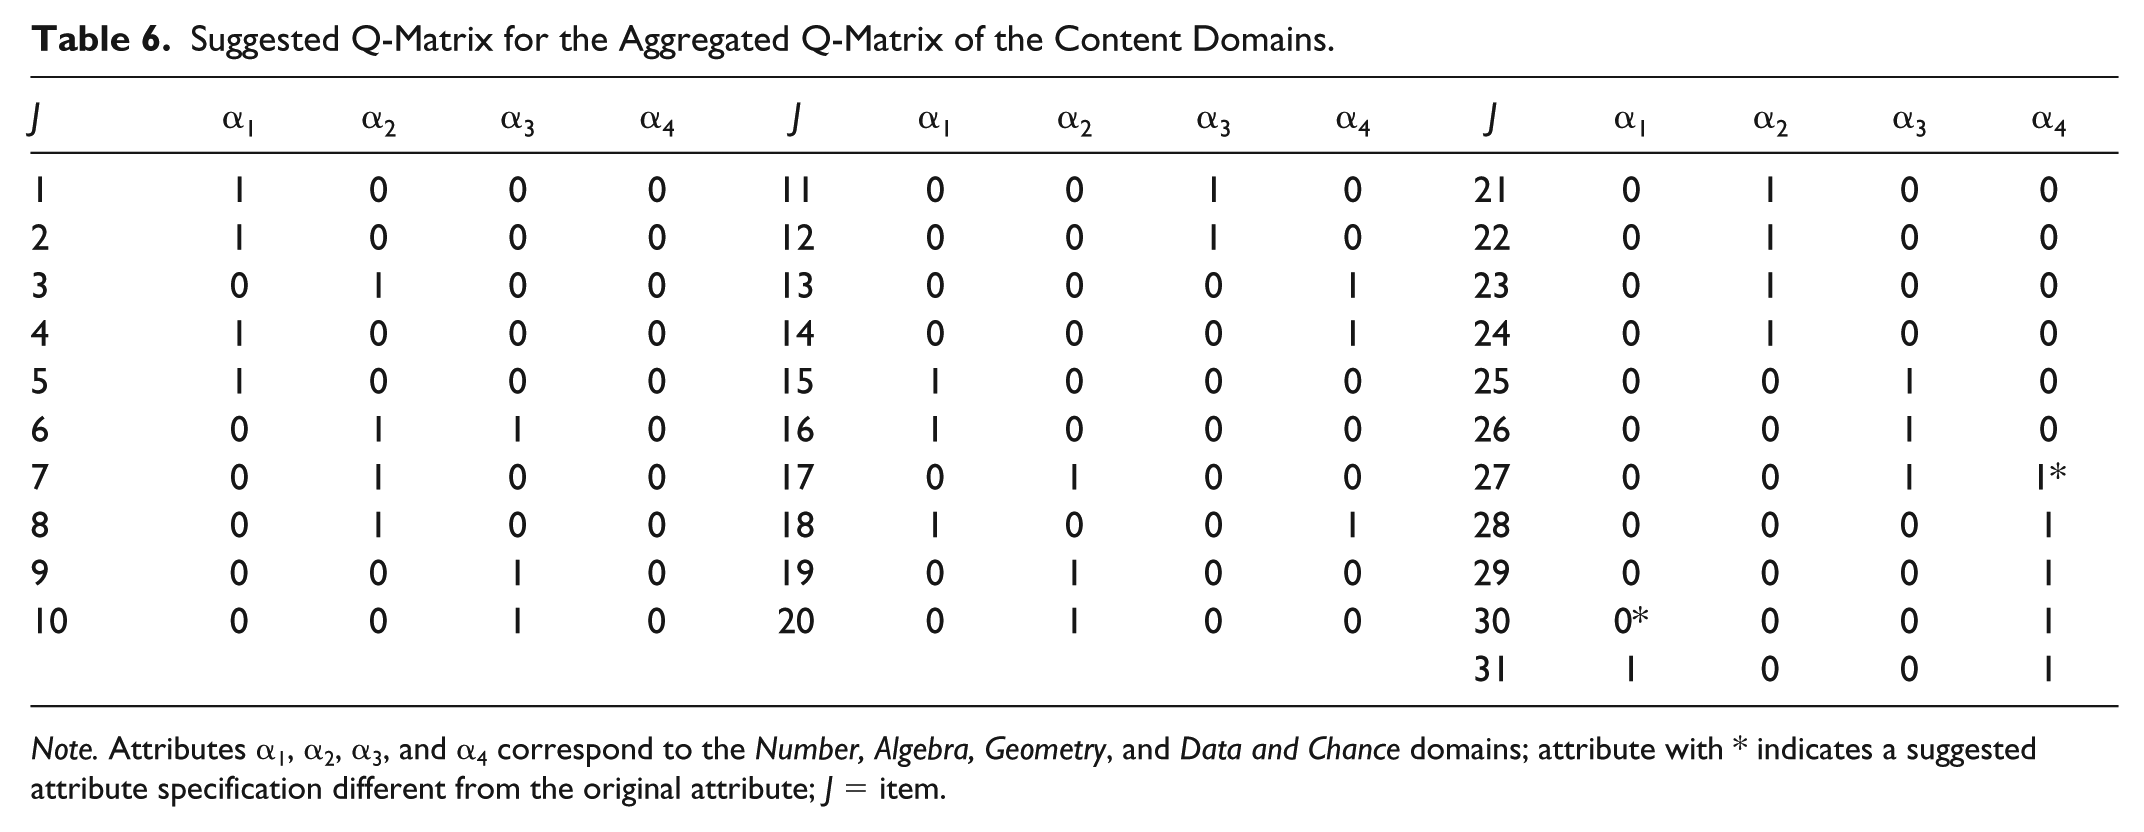
Aggregated Q-Matrix of the Content Domains.

Note. Attributes α1, α2, α3, and α4 correspond to the Number, Algebra, Geometry, and Data and Chance domains, respectively; J = item.
Statistical Procedures
Q-Matrix validation
This study applied the GDI (de la Torre & Chiu, 2016), denoted by
Given an attribute distribution, the

where
Model fit evaluation
The Wald test was first introduced by de la Torre (2011) to examine whether the G-DINA model can be replaced by one of the reduced models. The Wald test was further applied by de la Torre and Lee (2013) where the most appropriate CDM at the item level was investigated, which was applied in this study using the TIMSS 2011 large-scale data set. As stated earlier, each reduced CDM can be obtained from the saturated model using different restriction matrices based on the model specifications. Note that items requiring multiple attributes were analyzed because there is no need to distinguish between the reduced and saturated CDMs for one-attribute items (de la Torre & Lee, 2013).
Given


for the DINA model, the DINO model, and the A-CDM, respectively (de la Torre & Lee, 2013). The explanations on how these three reduced models were obtained according to these restriction matrices were mentioned in the “Saturated and Reduced CDMs” section. Thus, the Wald statistic can be computed as follows:

where
Results
First study was carried out for the Q-matrix validation under the G-DINA model. After validating the current attribute specifications given in the Q-matrix, the second study evaluated model-data fit at the item level. Results were further reported separately based on each content domain and aggregated content domains. The important contribution of this study is to propose two steps of model-data fit evaluation for each content domain and aggregated content domains. The reason for following such sequence is to implement model-data fit evaluation based on statistically validated attribute specifications. Therefore, unintended consequences of any misspecified attribute specification, if available, can be eliminated for the model-data fit evaluation. Moreover, results for both purposes were validated across the 20 countries.
Q-Matrix Validation
The validation of attribute specifications is displayed in Tables 5 and 6 for the attributes at the attribute level and content domain level, respectively. Those results were obtained using the GDI based on the G-DINA model. According to the validation of results across the 20 countries that were randomly selected, each attribute was specified as 1 if attribute specification was suggested by more than 50% of the countries on average; otherwise, it was specified as 0.
Suggested Q-Matrix for Each Content Domain.

Note. αN1, αN2, and αN3 are the attributes of the Number domain; αA1, αA2, αA3, and αA4 are the attributes of the Algebra domain; αG1, αG2, αG3, and αG4 are the attributes of the Geometry domain; αD1 and αD2 are the attributes of the Data and Chance domain; attribute with * indicates a suggested attribute specification different from the original attribute; J = item.
Suggested Q-Matrix for the Aggregated Q-Matrix of the Content Domains.
Note. Attributes α1, α2, α3, and α4 correspond to the Number, Algebra, Geometry, and Data and Chance domains; attribute with * indicates a suggested attribute specification different from the original attribute; J = item.
Given separate results for each content domain, all attribute specifications were deemed correct. There was only one exception where one attribute specification (αA2) for Item 19 in Algebra domain was suggested to be 0. (Item 19 asks which of the four options is equal to
For the content domains, as the attributes were investigated for the Q-matrix validation as shown in Table 6, two attribute specifications were changed. In Item 27 (i.e., which of the options show the result of a half-turn clockwise around point 0?), α4 was changed to 1, meaning that examinees also have to master the Data and Chance domain (α4) to answer the item correctly. In this item, a new shape formed by a geometric rotation was asked. The domain expert suggests that, this question is still relevant to a prediction about an outcome; however, this geometry-related question cannot be solved with the knowledge of Data and Chance domain (α4). Another suggestion was in Item 30, which asks “Over recent weeks, a shop’s average sales of bottles of soda have been 50% in the regular size, 40% in the small size, and 10% in the large size. Next week, the shopkeeper will order 1,200 bottles of soda. How many of these bottles should he order in the regular size?” In mastering the Number domain (i.e., α1), answering the item correctly is not compulsory. Therefore, the attribute specification of α1 in Item 30 was changed to 0. Item 30 only requires Data and Chance domain (α4). According to the domain experts, it was considered important to know the ratios of the bottles so that the attributes in Numbers domain were retrieved. However, without having to set the odds for 50% in the question, it was easy to find the half of 1,200 bottles, (i.e., 600). Students can generally deal with half of something such as twofold without relating to the proportion. If a different rate had been asked, for example, 40% would have to be written as 40/100. This type of 50% chance questions using Data and Chance domain (α4) is sufficient to correctly answer the item.
Model Fit Evaluation
The Wald test, W, is assumed to be asymptotically
Given the suggested attribute specifications, the next focus was on the model-data fit evaluation. The Wald test was applied at item level where any reduced model fits the data if the null hypothesis is retained. Tables 7 and 8 show model-data fit evaluation for each content domain. If the averaged proportions of the retained fitting models are more than 50% for the 20 countries, a reduced model was selected; otherwise, the G-DINA model was selected. As observed, items requiring multiple attributes were analyzed using model-data fit evaluation.
Suggested Models for Each Content Domain.

Note. αN1, αN2, and αN3 are the attributes of the Number domain; αA1, αA2, αA3, and αA4 are the attributes of the Algebra domain; αG1, αG2, αG3, and αG4 are the attributes of the Geometry domain; αD1 and αD2 are the attributes of the Data and Chance domain; J = item; DINA = deterministic inputs, noisy “and” gate; DINO = deterministic input, noisy “or” gate; A-CDM = additive-cognitive diagnosis model.
Suggested Models for the Aggregated Content Domains.

Note. J = item; DINA = deterministic inputs, noisy “and” gate; DINO = deterministic input, noisy “or” gate; A-CDM = additive-cognitive diagnosis model.
For the content domain of Numbers, among the 20 countries, more than 10 countries (i.e., at least 50%) showed that the underlying model for Items 1, 5, and 16 is the DINA model. The interpretation of Items 1 and 16 is that examinees can give a correct answer if they have mastered αN1 and αN2. Similarly, the interpretation for Item 5 is that examinees can give a correct answer if they have mastered all the three attributes (i.e., αN1, αN2, and αN3). Nonmastery of either one or more of these required attributes ends up with failure of correctly answering the item. Another implication of fitting the DINA model is that these attributes are also independent of each other, meaning that they have no interaction. Moreover, the A-CDM fits into Item 15. The interpretation is that the probability of correctly answering the item increases with the mastery of each αN1 and αN2. That is, mastery of any of these required attributes is additive without any interaction effects, meaning that mastery of a required attribute on top of the other increases the chance of answering the item correctly.
For the content domain of Algebra, the DINO model fits to Items 6 and 8. The interpretation of Items 6 and 8 is that examinees can give a correct answer if they have mastered either one of αA1 and αA2. However, it is interesting to know that the DINA and DINO models fit into Item 3. It is difficult to interpret this item. Nonetheless, if we set the cut-off at 85% of the 20 countries, then the underlying model becomes the DINA model. Furthermore, as none of the reduced models fit into Item 21, the G-DINA model was selected. The implication of fitting the G-DINA model is that αA1 and αA2 are dependent on each other, meaning that the probability of correctly answering the item increases with the mastery of each attribute with the interaction effect of αA1 and αA2.
When the content domain of Geometry was investigated, none of the reduced models fits into Items 9, 10, 11, 12, and 26. The implication of fitting the G-DINA model is that the probability of correctly answering the Items 9 and 10 increases with the mastery of each αG1, αG2, and αG3 in addition to the interaction effects of αG1 and αG2, αG1 and αG3, αG2 and αG3, and αG1, αG2, and αG3. Given the interpretations for Items 9 and 10, similar inferences of fitting the G-DINA model to Items 11, 12, and 26 can be made. For Item 27, the DINA model is retained as the underlying model, meaning that examinees can give a correct answer if they have mastered αG1 and αG3. In other words, nonmastery of either one or two of these required attributes leads to failure of correctly answering the item.
For the content domains, as the attributes were investigated for the model-data fit evaluation as shown in Table 8, the A-CDM fits to Items 18 and 31. That is, mastery of any of the required attributes (α1 and α4) is additive without any interaction effects, meaning that mastery of a required attribute on top of the other increases the chance of answering the item correctly. For Items 6 and 27, it is difficult to make such interpretation because the three reduced models fit into these items. In contrast, as discussed when each content domain was analyzed separately for the model-data fit evaluation, the DINO and DINA models fit to Items 6 for Algebra and 27 for Geometry, respectively. Hence, these models should be interpreted with caution for Items 6 and 27.
Summary and Discussion
One aspect for the evidence of validity is that an assessment tool should be useful (Kane, 2013). However, the utility of some applications, such as the model-data fit evaluation or retrofitting, can be improved given the assumption that reliable and accurate results are obtained (Liu et al., 2018). Even though model-data fit and retrofitting are not the ultimate solution, CDMs can still be applied to large-scale assessments in conjunction with an appropriate Q-matrix to obtain diagnostic information (Chen & de la Torre, 2014). Nonetheless, it is worthwhile using these assessments to draw finer-grained inferences about the mastery and nonmastery of specific attributes at the country levels because of the large amount of investments involved in developing the assessments (Chen & de la Torre, 2014). Moreover, attribute specifications in the Q-matrix constructed by domain experts are usually considered subjective in nature, which can lead to misclassification of examinees as a result of inaccurate parameter estimates (de la Torre & Chiu, 2016). Thus, employing such large-scale assessments require additional precaution.
This study used the eighth-grade mathematics section of the TIMSS 2011 assessment to analyze nondiagnostic assessments for diagnostic purposes. Two separate analyses were carried out at the attribute level and content domain level. After this separation and due to a large number of attributes that could cause problems for G-DINA model parameter estimates (Hou, 2013), first, attribute specifications in the Q-matrix were validated under the G-DINA model using the GDI index, in that any reduced model is not assumed. After verifying the correctness of attribute specifications for both cases, the model-data fit evaluation of the data was implemented. The Wald test used to evaluate the fit of a saturated CDM in contrast to the three reduced models (DINA, DINO, and A-CDM) was carried out at the item level (de la Torre & Lee, 2013). Comparing the fit of these distinct models is necessary because each item requires different underlying latent process. Furthermore, results from these two analyses were further validated across the 20 countries that were selected randomly.
Findings in this study suggest that, each item should be analyzed separately in terms of Q-matrix validation and model-data fit evaluation purposes based on validating results across countries. Instead of assuming the correctness of attribute specifications in the Q-matrix as well as having a single model for all the test items, researchers should start off the analyses with a notion that the correctness of attribute specifications should be verified, while the underlying latent process is unknown. After carrying out the Q-matrix validation, fitting models for each item should be identified. Otherwise, as the results show, assuming a single model for all items without validating the attribute specifications in the Q-matrix can cause serious validation problems as a result of inaccurate parameter estimates and attribute classifications. In general, according to results, some attribute specifications were changed and some items showed different reduced and general models. Due to the interactions among the attributes explained by the G-DINA model for specific items, caution should be taken while interpreting the items. Finally, for those items, which suggested multiple fitting models, it would be safer to follow the interpretation of a more general model—G-DINA.
This study has some limitations. First, the TIMSS 2011 mathematics questions were not designed for diagnostic purposes. However, because of the large amount of investments in such a large data set, this article was intended to obtain diagnostic information from this nondiagnostic assessment. Moreover, due to the fixed sample sizes, test lengths, and the number of attributes for the TIMSS 2011 data, we were unable to investigate the results under various conditions, in particular, for the G-DINA model parameter estimates. Therefore, inferences should be made carefully when retrofitting CDMs to responses from large-scale assessments is considered.
Footnotes
Declaration of Conflicting Interests
The author(s) declared no potential conflicts of interest with respect to the research, authorship, and/or publication of this article.
Funding
The author(s) received no financial support for the research, authorship, and/or publication of this article.