
Abstract
This study integrates the Technology Acceptance Model and Innovation Resistance Theory to deeply explore the key factors influencing college students’ intention to use mobile health applications. A random sample of 879 college students participated in a questionnaire survey, collecting self-reports on eight constructs: perceived value barriers, perceived complexity, perceived risk, resistance, perceived usefulness, perceived ease of use, attitude, and usage intention. This research used a hybrid method of Structural Equation Modeling-Artificial Neural Network to reveal complex and non-linear relationships between the predictors and usage intention. Results indicate that attitude is the strongest predictor of usage intention, followed by resistance. Perceived value barriers, perceived risk, and perceived complexity have no significant direct effect on attitude but have a significant positive impact on resistance. Perceived ease of use does not significantly influence resistance. Resistance serves as a complementary partial mediator in the impact of perceived usefulness on attitude and fully mediates the effect of perceived value barriers, perceived risk, and perceived complexity on attitude. Furthermore, through multilayer perceptron analysis, attitude is identified as the most crucial predictor (normalized importance 100%), followed by perceived usefulness (52.0%), resistance (28.2%), perceived ease of use (18.8%), perceived risk (14.0%), perceived complexity (9.4%), and perceived value barriers (9.1%). Finally, this study presents theoretical and practical implications for investigating the factors influencing college students’ intention to use mobile health applications.
Plain Language Summary
This study examines what influences college students' willingness to use mobile health apps by combining two theories: the Technology Acceptance Model and Innovation Resistance Theory. We surveyed 879 college students, asking them about their views on several topics, including their perceptions of the app's usefulness, ease of use, risks, complexity, and potential barriers. Our findings show that a student's attitude toward mobile health apps is the most significant factor in whether they intend to use them. Another important factor is their resistance to adopting new technology, which can lessen their positive attitude towards these apps. Interestingly, factors like perceived risks and complexity do not directly change students' attitudes, but they do increase their resistance to using the apps. We used advanced statistical methods to analyze the data, confirming that students' attitudes are key to understanding their willingness to use health apps. This study not only helps in understanding how college students accept new technology but also offers guidance on how developers and educators might encourage their use.
Keywords
Introduction
In modern medical technology, mobile health applications (m-Health Apps) delivered through smart devices such as smartphones and tablets have become an indispensable part of medical and public health services. Especially during the COVID-19 pandemic, these applications not only supported individual health management activities but also became crucial tools for interaction between patients and doctors by promoting remote medical services, significantly enhancing user health (Alam et al., 2023; Ali et al., 2022; Jin et al., 2023). Particularly among college students, these applications have demonstrated high acceptance and continuous usage habits in monitoring activities such as exercise, sleep, and diet (Binyamin & Zafar, 2021; Dangaiso et al., 2024). However, studies show that college students’ usage intention (UI), that is, their willingness to start and continue using these applications, is influenced by multiple factors. Understanding these factors is crucial for promoting health applications and enhancing public health levels. This study aims to explore the key factors affecting college students’ UI of m-Health APPs, particularly given the insufficient understanding of the interactions among these factors in the existing literature.
Existing research demonstrates that theoretical models such as the technology acceptance model (TAM) and innovation resistance theory (IRT) are widely applied to explain users’ acceptance of new technologies. The TAM emphasizes how perceived usefulness (PU) and perceived ease of use (PEOU) impact users’ attitudes (ATT) and satisfaction, thereby predicting UI (Alsyouf et al., 2023; Tian & Wu, 2022). For instance, Alsyouf et al. (2023) investigated the UI of a m-health recording system among 389 users, finding that the model explained 54.8% of the variance in UI. On the other hand, IRT highlights the impact of functional and psychological barriers on users’ resistance (RE), affecting their UI (Prakash & Das, 2022). For example, using IRT and distrust theory, Prakash and Das (2022) explored the factors affecting users’ UI of digital tracking applications, accounting for 67.6% of the variance in UI. Moreover, researchers have employed interviews (Chang et al., 2024; J. Y. Lee et al., 2020), structural equation modeling (SEM) (Lu et al., 2023; Nie et al., 2023), meta-analyses (Binyamin & Zafar, 2021; T. Wang, Wang, et al., 2022), and artificial neural networks (ANN; Yuduang et al., 2022) to further explore users’ UI of m-Health Apps.
Although the TAM and its extensions have been widely applied in the mobile health context, especially in exploring factors such as PU, PEOU, and behavioral intention (BI), most studies still primarily focus on the functionality and effectiveness of the technology itself, with less attention given to its impact on students’ intrinsic psychological factors. Therefore, this study aims to fill this research gap, particularly focusing on how the IRT affects students’ m-Health Apps UI. This study integrates TAM with IRT, mainly considering that the process of user acceptance of technology is influenced by both positive and negative factors. TAM provides the positive motivational mechanisms for users to accept new technologies, while IRT complements the potential barriers that users may encounter during the acceptance process. The combination of both can more comprehensively and deeply explain users’ adoption or RE behavior toward m-Health Apps. Through theoretical integration, a comprehensive research framework is proposed that considers both positive and negative factors, to more fully reveal university students’ m-Health Apps UI and its influencing factors.
In summary, the main objectives of this study are as follows: (1) Explore the application of IRT in m-Health Apps, particularly how perceived value barriers (PVB), perceived risks (PR), and perceived complexity (PC) affect university students’ UI; (2) Analyze how positive factors and negative factors interact and jointly influence UI; (3) Adopt an innovative two-stage approach, combining SEM and ANN, to improve the accuracy of predicting university students’ m-Health Apps UI. Based on this, the study poses the following research questions:
How do PU and PEOU affect UI?
How do positive and negative factors interact and jointly influence UI?
Does ATT mediate the relationship between RE and UI?
Does RE mediate the relationship between negative factors and attitude?
Compared with existing studies, this research makes the following contributions: First, it integrates the IRT and TAM to study their application in the mobile health domain. Second, it explores the potential interactive relationship between positive and negative factors. Finally, by combining SEM and ANN two-stage methods, it accurately simulates and predicts university students’ m-Health Apps UI and effectively captures the complex non-linear relationships between factors. This study further clarifies the mediating role of resistance in the m-Health Apps UI, enriching the specific context and mechanism of the integration of TAM and IRT.
The remainder of this paper is organized as follows: The next section is the literature review; Third section presents the research hypotheses; Fourth section details the research methods; Fifth section discusses the results; Sixth section includes discussions on research findings, theoretical implications, practical implications, research limitations, and future research directions; The final section concludes the study.
Literature Review
M-Health Apps
m-Health Apps, which utilize mobile internet technology to provide health improvement, healthcare, and other management services (Iyengar, 2020), have become a focal point in current medical research due to their operability, flexibility, and interactivity in the healthcare sector (Iskandarsyah et al., 2022). This has driven increased attention toward their development, design, and evaluation (Li, 2020; Lu et al., 2023; Nie et al., 2023; Tian & Wu, 2022).
Recent studies have employed various theoretical frameworks such as the Expectation Confirmation Theory (Nie et al., 2023), Information System Success Model (Tian & Wu, 2022), TAM, IRT (Mensah, 2022), and Unified Theory of Acceptance and Use of Technology (Xu et al., 2022) to explore the UI of m-Health Apps. For example, Xu et al. (2022), utilizing the TAM and the Unified Theory of Acceptance and Use of Technology, investigated medical students’ UI toward m-Health Apps, finding significant impacts of PU and ATT on UI. Research methods include both qualitative, such as interviews and focus groups (Chang et al., 2024; J. Y. Lee et al., 2020), and quantitative approaches, including linear regression (Klaver et al., 2021), multivariate logistic regression (Jin et al., 2023), meta-analysis (Binyamin & Zafar, 2021), SEM (Lu et al., 2023; Nie et al., 2023), and ANN (Yuduang et al., 2022). Moreover, factors influencing the UI of m-Health Apps can be categorized into personal, technological, and quality factors. Personal factors include ATT, RE, and PR (Binyamin & Zafar, 2021; Liu et al., 2022; Palos-Sanchez et al., 2021; Xu et al., 2022; Yuduang et al., 2022). For instance, Liu et al. (2022) investigated the direct and indirect impacts of mobile healthcare users’ self-efficacy and privacy concerns on their UI of mobile healthcare services, finding that self-efficacy significantly positively influences their UI. Technological factors identified as significant enhancers include PU, PEOU, personalized services, and convenience (Binyamin & Zafar, 2021; Jin et al., 2023; Tian & Wu, 2022). For instance, Jin et al. (2023) examined the factors influencing users’ UI of mHealth Apps, discovering that PEOU and PU significantly positively affect their UI. Finally, quality factors include information quality, system quality, and service quality (Nie et al., 2023). For instance, Nie et al. (2023) utilized the ECM-ISC model to investigate the determinants of UI for mobile healthcare services, finding that both information quality and service quality significantly positively influence users’ UI.
Technology Acceptance Model
The TAM, proposed by Davis (1989) based on the Theory of Reasoned Action, aims to analyze and predict user acceptance of information technology. The model comprises five key constructs: PU, PEOU, ATT, behavioral intention, and actual usage (Alsyouf et al., 2023). PU is the degree to which an individual believes that using a particular system would enhance their job performance, while PEOU refers to the extent to which a person believes that using a specific system would be free from effort (Davis, 1989; H. L. Wang, Zhang, et al., 2022). ATT reflects an individual’s positive or negative feelings about using the system. Behavioral intention is the psychological tendency to perform a particular behavior, which is a prerequisite for actual usage (Abbasi et al., 2011; Davis, 1989). The model suggests that PU and ease of use directly influence ATT, promoting UI (Yuduang et al., 2022). Over time, the TAM has gained widespread recognition and empirical support in the m-health sector (Yuduang et al., 2022; Zhang et al., 2023).
The TAM has been successfully applied in various health technology contexts, covering m-Health Apps (Nezamdoust et al., 2022), m-health services (Mensah, 2022), and mobile medical services (Li, 2020). These studies demonstrate the model’s strong predictive and explanatory power regarding users’ acceptance and UI. For instance, Khan et al. (2019) found significant positive effects of PU and PEOU on the UI of African expatriates in China regarding electronic medical services. Furthermore, the motivations for accepting and using health technology extend beyond TAM constructs to include factors like relative advantages (Nezamdoust et al., 2022), privacy concerns (Khan et al., 2019), trust (Li, 2020), and technology anxiety(Gaber & Hassan, 2022). These studies highlight the critical role of individual ATT, security, privacy protection, and ease of use as decision variables. For example, H. L. Wang, Zhang, et al. (2022) utilized the TAM and Theory of Planned Behavior to investigate how perceived privacy risks, perceived convenience, and perceived credibility affect the UI of m-health platforms, underscoring that PU, ATT, perceived privacy risks, and perceived convenience are key factors. Additionally, integrating the TAM with other theories, such as PR Theory (Sinha et al., 2021), Expectation Confirmation Theory (Gaber & Hassan, 2022), Unified Theory of Acceptance and Use of Technology (Xu et al., 2022), and Theory of Planned Behavior (H. L. Wang, Zhang, et al., 2022) provides a more comprehensive explanation of the factors influencing the UI for health technologies. This theoretical integration helps uncover the multidimensional factors influencing UI, such as how privacy and ease of use interact to impact user intentions in the personal health record systems studied by Alsyouf et al. (2023) . Similarly, Li (2020) examined how ATT, technology anxiety, and trust jointly determine UI for mobile medical services, demonstrating the importance of adopting the TAM for predicting and explaining student UI toward m-Health Apps.
Innovation Resistance Theory
IRT, proposed by Ram (1987), delves into users’ RE behaviors during adopting new technologies. This theory encompasses barriers such as value barriers, risk barriers, usage barriers, tradition barriers, image barriers, complexity, and RE (Prakash & Das, 2022). Specifically, value, risk, and usage barriers refer to the functional impediments to technology adoption (Kumar et al., 2023). Complexity describes the intricacy of the innovation’s features (Kaur et al., 2020). Moreover, RE refers to opposition to innovations that challenge the status quo and the consumer belief system (Kumari et al., 2024). Such RE may evolve from initial adoption delays to outright rejection of products or services (Musyaffi et al., 2022; Ram & Sheth, 1989). As the originators of IRT, Ram and Sheth (1989) emphasized that resistance stems not only from practical concerns but also from disruptions to users’ psychological and social equilibrium. They classified resistance into functional and psychological barriers, shifting focus from acceptance drivers to avoidance mechanisms. Therefore, IRT considers all aspects that influence users’ reluctance to adopt new technologies, which is crucial for identifying the reasons behind personal rejection of new technologies. This study builds on IRT by introducing RE as a mediating mechanism that links perceived barriers to user attitudes in the context of m-Health Apps, and extends the theory by applying it to a digital health environment with a focus on young users’ psychological adaptation under data-driven conditions.
Recent studies have applied IRT across various fields. For example, Kautish et al. (2023) investigated the UI of remote medical applications using IRT. They identified usage barriers, value barriers, risk barriers, tradition barriers, and image barriers as significant factors affecting UI. Similarly, Klaver et al. (2021) noted that legal, performance, and privacy risks are substantial obstacles for the elderly in adopting digital health technologies. Additionally, studies have integrated IRT with theories such as Self-Determination Theory (Chung & Liang, 2020), Stimulus-Organism-Response-Consequence framework (Chakraborty et al., 2022), and Distrust Theory (Prakash & Das, 2022) to deeply analyze various factors leading to user RE to new technologies. For instance, Chakraborty et al. (2022), using the IRT and the Stimulus-Organism-Response-Consequence framework, examined the impact of functional barriers in mobile fitness applications on UI, finding that these barriers did not hinder usage. In these studies, factors influencing users’ RE to new technologies can be categorized into technological, personal, and environmental factors. Technological barriers such as usage, value, risk, tradition, and image barriers significantly influence RE (Chakraborty et al., 2022; Kautish et al., 2023). On a personal level, factors such as technological anxiety, mobile self-efficacy, and word-of-mouth play key roles in resisting new technologies (Chen et al., 2022; Kumar et al., 2023; Mensah, 2022). On the environmental level, legal concerns pose major challenges for users in adopting new technologies (Klaver et al., 2021; Kumari et al., 2024).
Hypotheses
PU, PEOU, and ATT
The TAM has been widely used to investigate the factors affecting users’ UI of m-Health Apps. Previous research has demonstrated that PU and PEOU are key factors in encouraging people to adopt these technologies (Alsyouf et al., 2023; Jin et al., 2023; Xu et al., 2022). For instance, Jin et al. (2023) investigated the UI of 402 mobile medical users in China, finding that PU and PEOU positively impacted their UI. The more users perceive m-Health Apps as beneficial for maintaining health and easy to use, the stronger their intention to use them. Xu et al. (2022), integrating the TAM with the Unified Theory of Acceptance and Use, surveyed 450 medical students and found that ATT significantly positively influenced UI toward m-Health Apps. Similarly, Li (2020) confirmed that PEOU and PU significantly influenced consumers’ ATT toward mobile medical services. Based on this research, we hypothesize that the higher the PU and PEOU of m-Health Apps among college students, the more positive their ATT will be. Therefore, we propose the following hypotheses:
PVB, PR, PC, and RE
IRT is widely regarded as an effective predictor of users’ acceptance or resistance to new technologies. In information technology, RE encountered while using new technologies significantly negatively predicts UI (Prakash & Das, 2022). This RE reflects unfavorable evaluations of using new technologies (Chakraborty et al., 2022). Studies have shown that core elements of IRT, such as PVB, PR, and PC, directly impact users’ UI (Kautish et al., 2023). For example, based on IRT, Ju and Lee (2021) explored the factors influencing users’ intentions to use smart clothing, emphasizing that PR significantly increases users’ RE. Based on IRT, Prakash and Das (2022) explored the factors influencing users’ intentions to use smart clothing, emphasizing that PR significantly increases users’ RE. Bian et al. (2023) also confirmed that PVB and PC significantly increased the RE of Chinese healthcare workers using Internet medical technologies. Based on this research, we hypothesize that PVB, PR, and PC will significantly increase RE among college students using m-Health Apps. Therefore, we propose the following hypotheses:
RE, ATT, and UI
The TAM has been extensively used to explore people’s UI for new technologies. In this model, ATT significantly positively influences UI. For instance, Tsai et al. (2020) analyzed elderly people’s UI for wearable medical technologies using the TAM, finding that ATT significantly positively impacted their UI. Similarly, H. L. Wang, Zhang, et al. (2022) also confirmed that users’ ATT significantly positively influenced their UI for mobile medical platforms. Additionally, the negative impact of RE on ATT has been empirically supported. Studies show that RE encountered during use negatively affects users’ ATT, increasing negative and pessimistic emotions (Jan et al., 2023; Ma & Lee, 2017; Yoo, 2021). For example, Ma and Lee (2017) used IRT to investigate the potential barriers faced by university students in developing countries using MOOCs, finding that usage barriers increased RE and significantly reduced students’ positive ATT. Moreover, RE encountered while using new technologies is a key factor affecting UI. For example, H.-K. Lee (2022) found that RE to autonomous driving technology among drivers in Seoul significantly reduced their UI. Yuduang et al. (2022) investigated the factors influencing Philippine users’ UI for mobile m-health Apps, discovering that RE to the m-health Apps significantly reduced their UI. Based on this research, we hypothesize that the more RE college students encounter while using m-Health Apps, the more negative their ATT and the lower their UI will be. Therefore, we propose the following hypotheses:
PU, PEOU, RE, and ATT
In studies of UI for information technology, PU and PEOU have been confirmed as key factors influencing users’ UI and can significantly reduce RE to new technologies. For example, Yoo (2021) explored the factors influencing users’ UI for unmanned order payment services in Seoul, finding that PU and ease of use could significantly reduce innovation RE, while PR would increase RE, thereby affecting users’ ATT. On the other hand, Cho et al. (2021) revealed that PU could positively reduce nurses’ RE to using electronic medical record systems and ease of use. This indicates that enhancing the system’s usefulness and ease of use can promote users’ acceptance of new technologies. Based on this research, we hypothesize that if college students perceive m-Health Apps as useful and easy to use, it will reduce their RE to using the app and promote positive ATT. Therefore, we propose the following hypotheses:
PVB, PR, PC, RE, and ATT
Studies have found that users typically encounter three main barriers when adopting new technology products: PR, PC, and PVB (Prakash & Das, 2022). In the decision-making process, users tend to avoid risks (Blanke & McGrady, 2016), and users with negative ATT usually have lower acceptance levels for new technologies (Palos-Sanchez et al., 2021). For example, Polisetty et al. (2023), based on the TAM and IRT, analyzed the factors influencing Indian users’ UI for Over-the-top services, finding that PVB, technological vulnerability barriers, personal barriers, and RE significantly increased users’ negative ATT. Kwangsawad and Jattamart (2022), combining the TAM and Innovation Resistance Model, analyzed customers’ UI for chatbot services, revealing that customers’ time risk and privacy risk barriers significantly impacted their ATT and continued UI. Arora et al. (2023) found that complexity significantly increased users’ negative ATT in exploring consumers’ purchase intentions for electric vehicles. Therefore, we propose the following hypotheses:
Figure 1 is the research model.

Research model.
Methods
Sample and Data Collection
This study was approved by the Ethics Committee of a university in China and conducted in accordance with the 1964 Helsinki Declaration and its later amendments (Approval No.: HUEL-2023-03-11). All participants were informed of the research aims, the voluntary nature of their participation, and their right to withdraw at any time without any consequences. Informed consent was obtained in written form prior to data collection. The study was designed to minimize any potential harm to participants. Questions were non-invasive and pertained only to their perceptions and attitudes. Data collection was anonymous, and no personal identifiers were stored or used in any analyses. The potential benefits of this research—for both academic understanding and the development of educational or policy interventions—were deemed to outweigh any minimal risks associated with participation. This study collected data through the online questionnaire platform Questionnaire Star (www.Sojump.com) and tested the proposed hypothesis model from January to April 2024. To ensure sample representativeness, students were randomly selected from several institutions in a region of China. A total of 955 questionnaires were collected. After excluding 76 invalid responses, 879 valid questionnaires remained. The demographic details of the participants are presented in Table 1. The participants consisted of 426 males (48.46%) and 453 females (51.54%), with the majority aged between 18 and 20 years (84.41%), including 376 freshmen (42.78%) and 491 sophomores (55.86%). Participants using m-health Apps for over a year numbered 626 (71.22%).
Demographic Characteristics of the Sample.

Measurement Tools
The questionnaire is divided into two parts: the first part collects participants’ demographic information, and the second part gathers self-reported data on various constructs. The measurement tool for this study was selected and adapted based on established scales in the existing literature. The construct selection was based on the core variables included in TAM and IRT, while also referencing commonly used measurement dimensions in current m-Health Apps research. The items were appropriately adjusted to align with the specific context of m-Health Apps to ensure content validity and contextual applicability. After the preliminary formation of the scale, it was evaluated by experts and pre-tested to further refine and optimize the wording, clarity, and applicability of the content. Additionally, the reliability and validity of the scale were assessed by calculating the Cronbach’s alpha coefficient, composite reliability (CR), and average variance extracted (AVE) for each construct, ensuring the scientific rigor and accuracy of the measurement tool. Besides basic demographic information, the questionnaire includes key constructs such as PVB, PC, PR, RE, ATT, PU, PEOU, and UI. Each construct used a 5-point Likert scale, ranging from (1) strongly disagree to (5) strongly agree. The PR scale was developed by Chakraborty et al. (2022). It included four items (e.g., “I am concerned about the confidentiality of my personal health information in m-health Apps.”), with a Cronbach’s alpha of .914, indicating good reliability. The scales for PVB and PC were developed by Prakash and Das (2022), with the former containing two items (e.g., “Using m-health Apps results in some time or financial loss to me.”) and the latter three items (e.g., “It is difficult for me to learn how to use m-health Apps.”), with Cronbach’s alphas of .727 and .877 respectively, showing high reliability. The RE scale was developed by Chouk and Mani (2019) and included three items (e.g., “I have a negative opinion about m-health Apps.”) with a Cronbach’s alpha of .871. The scales for PEOU, PU, ATT, and UI were adapted based on the study by Ren and Zhou (2023). In this study, Cronbach’s alphas for PEOU, PU, ATT, and UI were .848, .921, .894, and .897, respectively, demonstrating good reliability. Detailed scale items are available in Appendix A.
Data Analysis
A two-stage approach was used to validate hypotheses and establish a predictive model. SEM is a theory-driven approach that detects linear relationships between exogenous and endogenous variables through a compensatory model, where the decrease of one variable is compensated by the increase of others (Leong et al., 2018). However, the relationships among PVB, PR, PC, RE, ATT, PU, PEOU, and UI are not merely linear or compensatory. Compared to SEM, ANN can capture both linear and non-linear relationships using a non-compensatory model (Sharma et al., 2019), leading to higher prediction accuracy. Furthermore, due to its “black box” nature, ANN is more suitable for prediction than hypothesis testing. Lastly, ANN analysis can further validate the results obtained from SEM. Thus, this study integrates a mixed method of hypothesis validation and prediction, combining the strengths of both approaches.
Specifically, in the first stage, the SEM in SmartPLS 4 revealed the impacts of PVB, PR, PC, RE, ATT, PU, and PEOU on college students’ UI and identified significant predictors (Chin, 1998). In the second stage, significant predictors were used as input neurons for ANN to predict UI, ultimately obtaining prediction accuracy and ranking key variables.
Results
Measurement Model
The evaluation of the measurement model involved testing the reliability and validity of the questionnaire and data. Reliability was assessed by the outer loadings of each item. According to Byrne (2013), an outer loading score above .70 indicates high reliability. Table 2 shows that the outer loading for each item exceeded .70, demonstrating high reliability.
Reliability and Validity of the Model.

Internal consistency was evaluated using CR and Cronbach’s alpha. In this study, Cronbach’s alpha ranged from .753 to .951, meeting the acceptable standard (.7 is considered an acceptable threshold). Furthermore, according to Hair et al. (2021), a CR value between .60 and .70 is considered acceptable, and .70 to .90 is generally considered satisfactory. In this study, all items’ composite reliability values ranged from .727 to .921, meeting the standards above.
Convergent validity was assessed through AVE. In this study, AVE values ranged from 0.707 to 0.904, exceeding the threshold of 0.5 (Fornell & Larcker, 1981). According to Henseler et al. (2015), this range is acceptable, indicating that the results passed the test for convergent validity.
Discriminant validity refers to the extent to which constructs are distinct from other constructs (Zaiţ & Bertea, 2011). The Fornell-Larcker criterion is a method for testing discriminant validity (Fornell & Larcker, 1981). According to this criterion, discriminant validity is achieved if the square root of the AVE for each construct is greater than its highest correlation with any other construct (Henseler et al., 2015). Table 3 shows that the square root of the AVE for each construct was greater than its highest correlation with any other construct, thus meeting the requirements for discriminant validity.
Fornell-Larcker Criterion.

Note. Data on the diagonal in bold represents the square root of AVE.
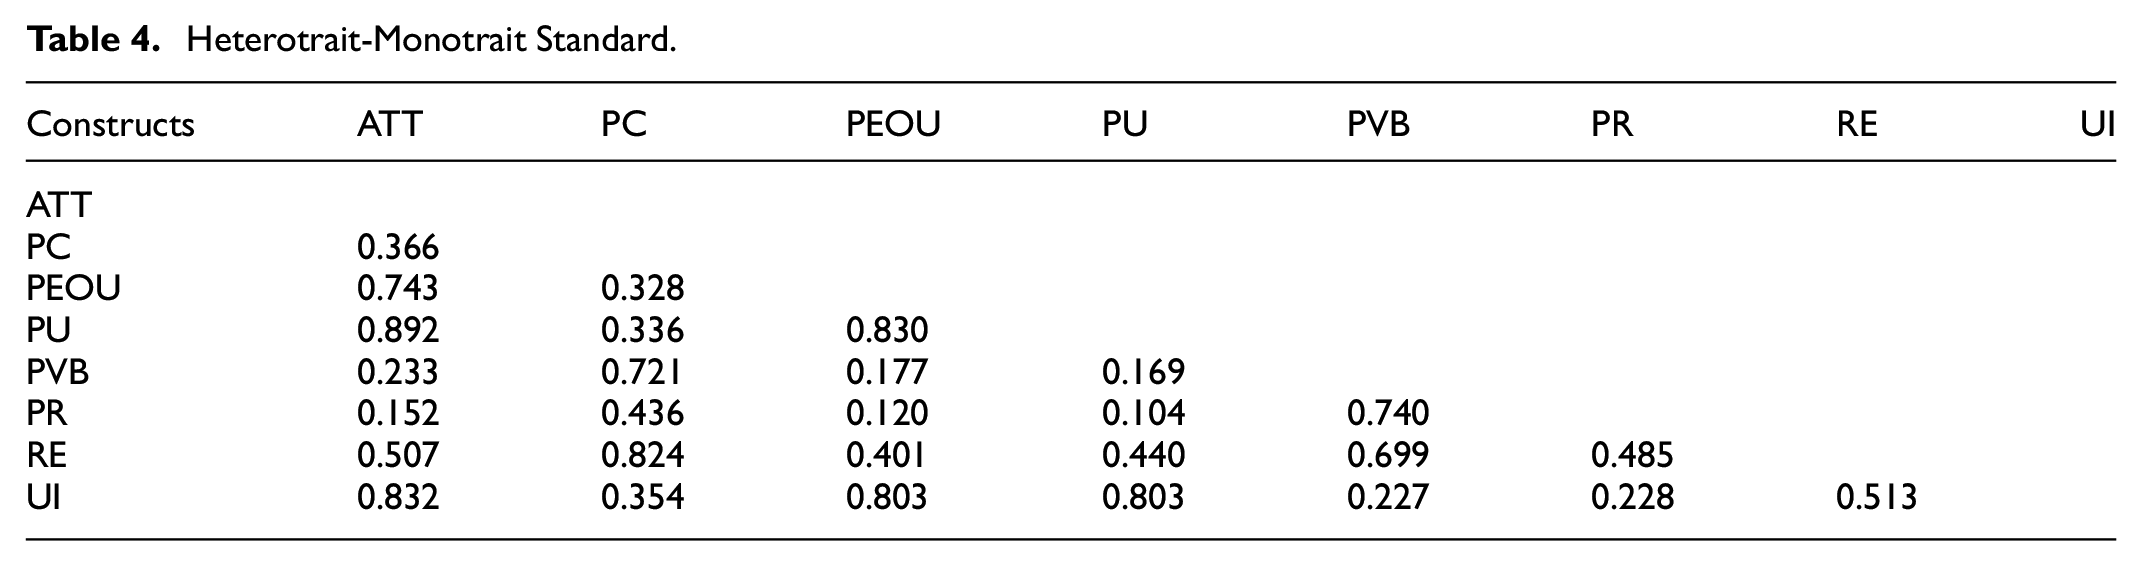
The Heterotrait-Monotrait Ratio (HTMT) is a second criterion for assessing discriminant validity, proposed by Henseler et al. (2015). Following their recommendation, an HTMT value between two constructs should not exceed 0.85 for conceptually distinct constructs, and 0.90 can be considered acceptable for conceptually similar constructs. As shown in Table 4, all HTMT values were below the critical threshold of 0.90, indicating that the measurement model satisfies the requirements for discriminant validity.
Heterotrait-Monotrait Standard.
Structural Model
The evaluation of the structural model can use several indicators, including tests for multicollinearity, the significance of path coefficient estimates, and the coefficient of determination (R2). These indicators help assess the model’s reliability and explanatory power (Gefen et al., 2011).
Multicollinearity Test
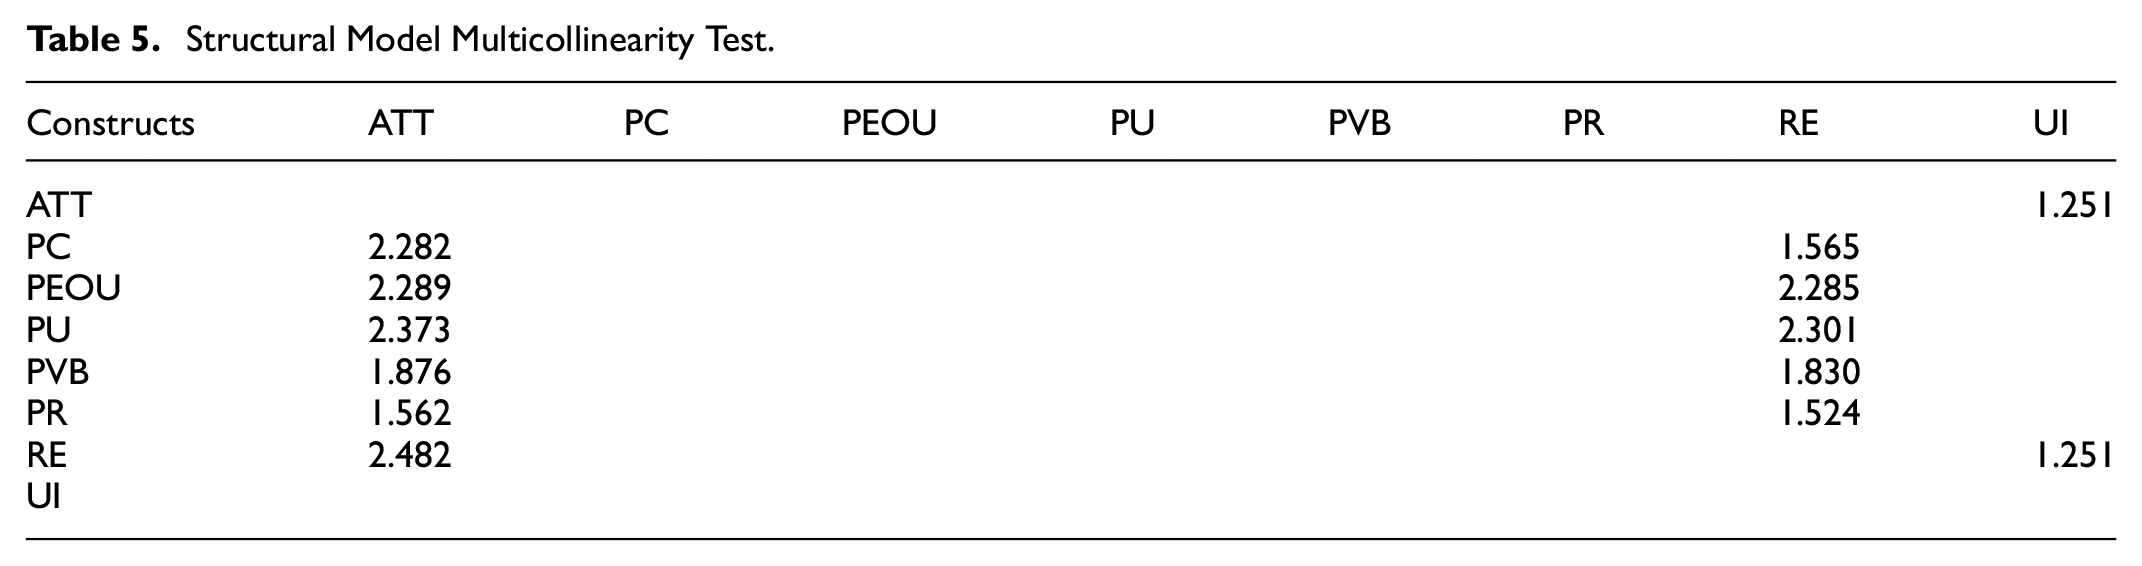
According to Hair et al. (2021), multicollinearity in the model can be examined through the variance inflation factor (VIF). Empirically, all variable VIF values should be below 3.3 (Hair et al., 2021). Table 5 shows that VIF values for all variables ranged from 1.251 to 2.482, indicating no multicollinearity issues.
Structural Model Multicollinearity Test.
Path Hypothesis
In the structural model, the main purpose of significance testing is to explore whether the impact of exogenous constructs on endogenous constructs is significant. Table 6 presents the results divided into three main aspects based on UI, RE, and ATT. Specifically, among the direct significant predictors of UI, ATT (β = .681; t = 15.050; p = .000) was the strongest determinant, followed by RE (β = −.149; t = 3.378; p = .001). Similarly, among the direct significant predictors of RE, PC (β = .538; t = 14.537; p = .000) was the strongest determinant, followed by PU (β = −.170; t = 3.932; p = .000), PVB (β = 0.137; t = 4.025; p = .000), and PR (β = .124; t = 3.938; p = .000), while PEOU (β = −.040; t = 0.910; p = .363) had no significant impact on RE. In the direct significant predictors of ATT, PU (β = .680; t = 13.686; p = .000) was the strongest determinant, followed by RE (β = −.159; t = 3.814; p = .000) and PEOU (β = .106; t = 2.097; p = .036), while PVB (β = .016; t = 0.498; p = .619), PR (β = .002; t = 0.062; p = .951), and PC (β = .035; t = 0.990; p = .322) had no direct significant impact on ATT. The path relationships between the variables affecting college students’ m-Health Apps UI are shown in Figure 2.
Path Hypothesis Test Results.
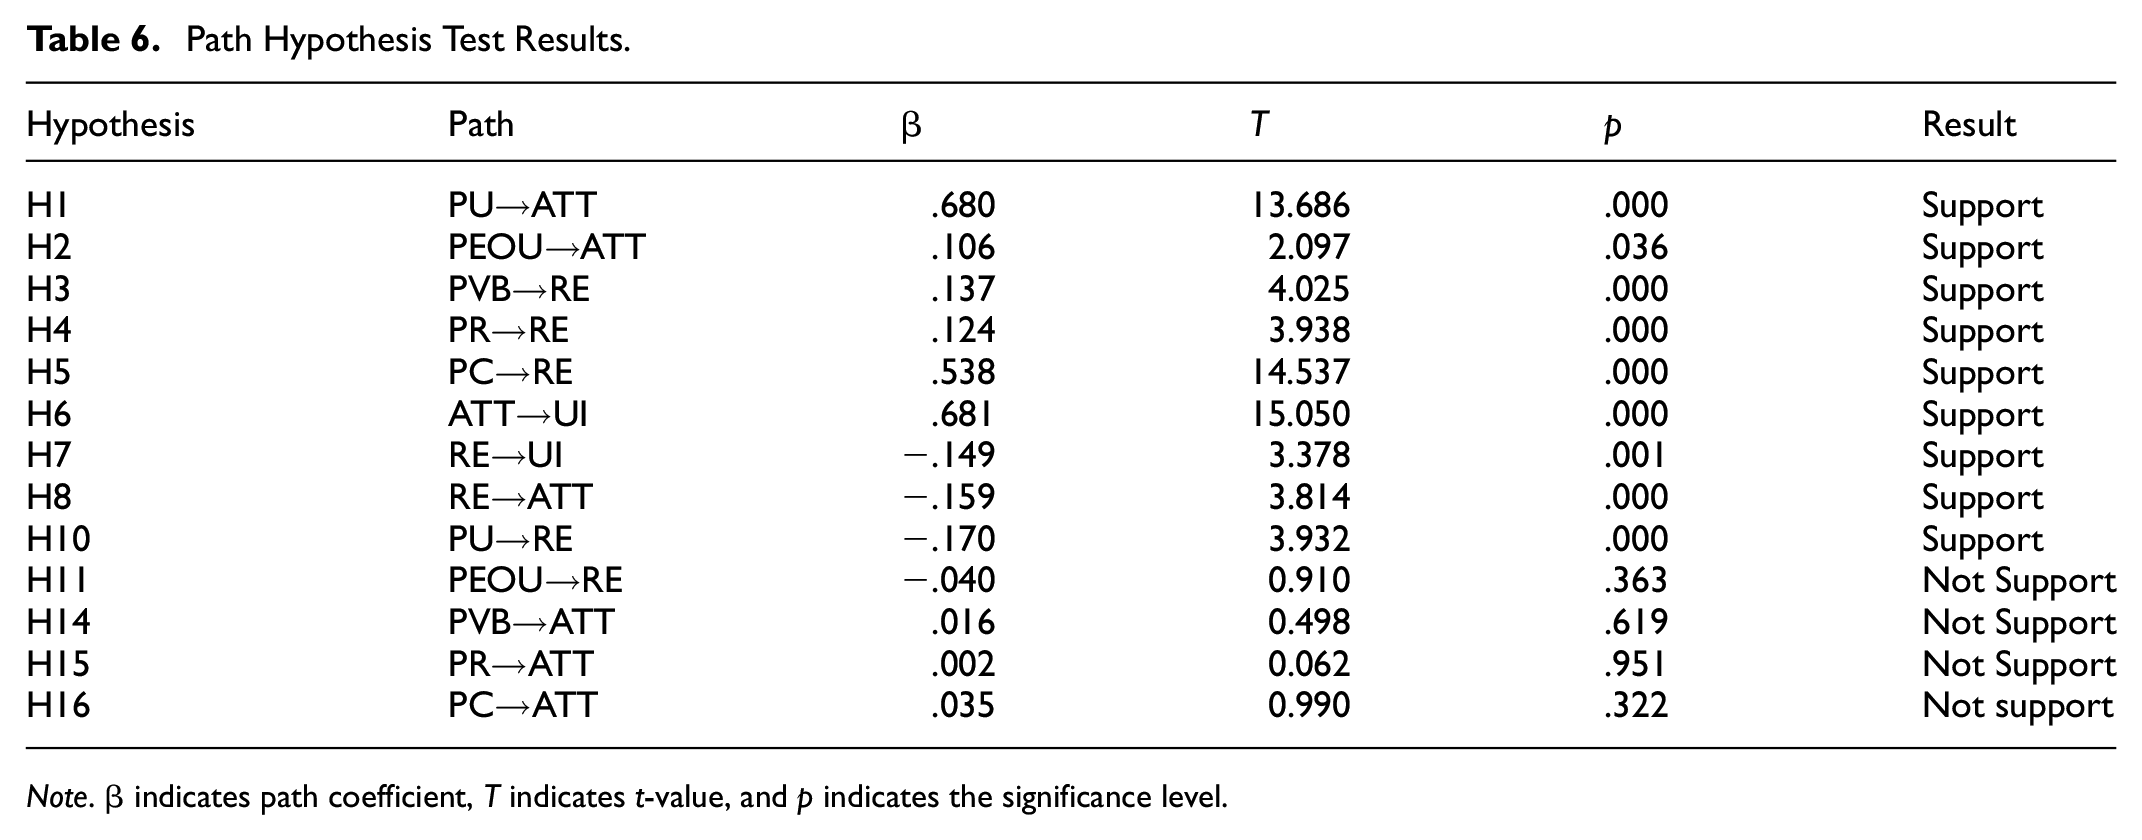
Note. β indicates path coefficient, T indicates t-value, and p indicates the significance level.

Path relationship diagram.
Coefficient of Determination (R2)
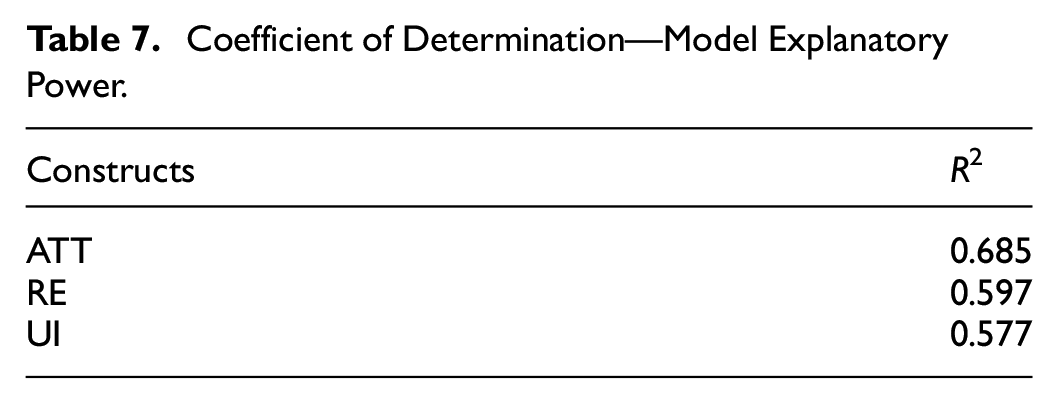
The R2 measures the extent to which the independent constructs explain the variance in the dependent constructs. According to recent studies, R2 values can be interpreted as indicating the strength of the model’s explanatory power. Ozili (2023) suggests that R2 values between 0.10 and 0.50 are considered acceptable in social science research. Table 7 shows the model’s explanatory power for each construct, with R2 values of 0.685 for ATT, .597 for RE, and 0.577 for UI, indicating moderate to strong explanatory power.
Coefficient of Determination—Model Explanatory Power.
Mediating Effects
This study conducted mediation analysis based on the PLS-SEM bootstrapping method (Nitzl et al., 2016) to explore whether ATT mediates the effect of RE on UI, as well as whether RE mediates the impact of PVB, PR, PC, PU, and PEOU on ATT. The analysis assessed the significance of direct and indirect effects and their product signs, aiming to deeply understand the types and extents of mediation effects.
Table 8 indicates RE’s significant direct and indirect effects on UI, with the product sign “positive” suggesting that ATT acts as a complementary partial mediator between RE and UI. Furthermore, RE exhibits significant indirect effects—without direct effects—on the impact of PVB, PR, and PC on ATT, thus fully mediating between these factors and ATT. In the relationship between PU and ATT, both direct and indirect effects of RE are significant, with the product sign “positive” indicating a complementary partial mediation. However, regarding the impact of PEOU on ATT, the indirect effect of RE is not significant, indicating that there is no mediation role of RE between PEOU and ATT.
Mediation Analysis.

Note. CPM = complementary partial mediation; FM = full mediation; NM = no mediation..
ANN Analysis
In the subsequent phase, similar to the study by Liébana-Cabanillas et al. (2017), we utilized significant factors from the SEM-PLS analysis as input neurons for the ANN model. The application of ANN was due to non-normal data distributions, non-linear relationships between exogenous and endogenous variables, and ANN’s robustness against noise, outliers, and small sample sizes. This method also adapts to non-compensatory models, where decreases in one factor do not require compensations by increases in another. The ANN analysis was conducted using IBM SPSS Neural Network module. This algorithm captures linear and non-linear relationships and operates independently of normal distribution assumptions (Teo et al., 2015). The training process used the feedforward-backpropagation (FFBP) algorithm to predict outcomes (Taneja & Arora, 2019). The input and hidden layers utilized multilayer perceptrons and sigmoid activation functions (Sharma et al., 2019). Through multiple learning cycles, the process minimizes errors, thereby enhancing prediction accuracy (El Idrissi et al., 2019). Like Leong et al. (2018), 80% of the samples were used for training, with the remainder for testing. A ten-fold cross-validation procedure was employed to prevent overfitting, and root mean square errors (RMSE) were obtained (Ooi & Tan, 2016). As shown in Table 9, the average RMSE values for the training and testing processes were 0.0838 and 0.0902, respectively, confirming an excellent fit of the model.
Root Mean Square of Error Values.

Note. N = number of samples; RMSE = root mean square of error; SSE = sum square of error.
To assess the predictive strength of each input neuron, a sensitivity analysis was conducted (Table 10), calculating their normalized importance relative to the highest importance and presenting these in percentages (Karaca et al., 2019). Results indicated that ATT was the most crucial predictor, with a normalized importance of 100%. Following were PU at 52.0%, RE at 28.2%, PEOU at 18.8%, PR at 14.0%, PC at 9.4%, and PVB at 9.1%.
Sensitivity Analysis.

Discussion
This study explored college students’ m-Health Apps UI and integrated TAM and IRT, with a focus on analyzing the mediating roles of RE and ATT. In addition, the study employed the ANN method to further examine the significance of various influencing factors. The results indicated that PU and PEOU positively influenced ATT and UI, with PU having a particularly significant impact. Meanwhile, PVB, PR, and PC indirectly influenced ATT through RE, with RE having a significant negative impact on UI. Notably, RE fully mediated the relationship between PVB, PR, and PC and ATT, partially mediated the effect of PU on ATT, but did not mediate the effect of PEOU on ATT. Analysis of the normalized importance of different influencing factors using the ANN method showed that ATT was the most important predictor (100%), followed by PU (52.0%) and RE (28.2%). These results further confirmed the research hypotheses and highlighted the interaction between positive and negative factors in the adoption process of m-Health Apps. Therefore, this study revealed how PU and PEOU influence UI, clarified the interaction mechanism between positive and negative factors, and verified the partial mediating role of ATT between RE and UI, as well as the full mediating role of RE between PVB, PR, PC, and ATT. This finding provides theoretical support for promoting the adoption of m-Health Apps among college students and offers valuable insights for future research and practical applications.
PU, PEOU, and ATT
PU of m-Health Apps among college students significantly positively influences ATT, indicating that enhancing the PU of the application can effectively strengthen college students’ positive ATT toward m-Health Apps, thus validating H1. This is consistent with the findings of Xu et al. (2022), who studied the factors influencing the m-Health Apps UI among 450 medical students. The results showed that PU and PEOU were significant predictors of attitude among medical students. In this study, on the one hand, the efficiency of m-Health Apps in providing timely and comprehensive health information significantly enhanced their PU (Min et al., 2019), thereby improving students’ positive ATT. On the other hand, college students find m-Health Apps very useful in managing health, monitoring conditions, and reminding them to maintain healthy habits, which allows them to more conveniently maintain their health in daily life, thereby significantly enhancing their positive ATT (Chakraborty et al., 2022). Therefore, developers should focus on improving the PU of the application by providing more accurate, comprehensive, and personalized health information and services to further enhance college students’ positive ATT and m-Health Apps UI.
PEOU of m-Health Apps significantly positively influences ATT, indicating that optimizing the PEOU of the application can effectively enhance college students' positive ATT toward m-Health Apps, thus validating H2. This is consistent with the findings of Li (2020), who, in exploring the factors influencing the mobile healthcare services UI among 303 users, found that PEOU significantly positively influenced users’ positive ATT toward the service. This study further revealed that university students rated the intuitive interface, ease of understanding, and simplicity of operation of m-Health Apps (Alsyouf et al., 2023), enhancing their positive ATT toward these applications. Additionally, the convenience of m-Health Apps in accessing health information and services significantly reduced the time and effort required by students, further enhancing their PEOU. Thus, high PEOU improved user experience and effectively increased students’ positive ATT toward using m-Health Apps (Elsafty et al., 2020). Therefore, developers should focus on optimizing the application’s interface design and operational processes, providing a more intuitive, user-friendly, and convenient m-Health Apps to further enhance college students’ positive ATT and UI.
PVB, PR, PC, and RE
PVB of m-Health Apps among college students significantly positively influence RE, indicating that PVB increase RE to m-Health Apps, thus validating H3. This is consistent with the findings of Prakash and Das (2022), who, in studying RE to the use of digital tracking programs, found that users' PVB were a key factor influencing RE. This study further shows that college students’ concerns about potential financial burdens, such as subscription fees or related costs, significantly increased their RE to these applications (Kumari et al., 2024). Additionally, when college students have PVB, they may develop skepticism and distrust toward m-Health Apps, thereby increasing RE (Kim & Park, 2023). Therefore, developers and policymakers should focus on users’ value perceptions by offering free basic features, reasonable pricing strategies, and transparent charging models to reduce users’ economic concerns, while ensuring that the application’s features are highly aligned with user needs to reduce PVB and lower RE to use.
PR of m-Health Apps among college students significantly positively influences RE, indicating that PR is an important factor in increasing RE to the use of m-Health Apps, thus validating H4. This is consistent with the findings of Ju and Lee (2021), who, based on IRT, explored the RE to the adoption of smart clothing among 320 adults, and their results highlighted the significant impact of PR on user RE. In this study, students’ concerns about potential breaches of personal privacy or misuse of health information raised PR, increasing their RE to using m-Health Apps (Bian et al., 2023). Additionally, students’ skepticism about the reliability and professionalism of the information sources provided by m-Health Apps, fearing receipt of misleading or inaccurate health information (Nie et al., 2023; Tian & Wu, 2022), also increased their PR and thereby their RE (Nie et al., 2023). Therefore, developers should strengthen data security protection, improve the accuracy and reliability of information, and reduce PR by providing transparency in information sources and enhancing user education to decrease RE to use.
PC of m-Health Apps among college students significantly positively influences RE, indicating that PC is an important factor affecting RE to the use of m-Health Apps, thus validating H5. This is consistent with the findings of Prakash and Das (2022), who, in studying Indian users’ digital tracking programs UI, found that PC significantly positively influenced RE. In this study, when students encountered difficulties accessing information or faced many operational steps and complex interface designs in mobile applications, their RE significantly increased (Cao et al., 2020). PC can cause anxiety and frustration among college students. When faced with complicated operations, they may worry about not using the application correctly, fearing errors or the leakage of personal information (Chouk & Mani, 2022). Therefore, developers should focus on simplifying the application’s operational processes, optimizing the interface design to make it more intuitive and user-friendly, and providing detailed and easy-to-understand user guides and tutorials to reduce college students’ PC and decrease RE to use.
RE, ATT, and UI
ATT toward m-Health Apps among college students significantly positively influences their UI, indicating that a positive ATT is an important driving force for college students’ use of m-Health Apps, thus validating H6. This is consistent with the findings of H. L. Wang, Zhang, et al. (2022), who, in studying patients’ mobile healthcare platforms UI, emphasized the significant positive impact of ATT on UI. In this study, university students showed high recognition and positive evaluation of m-Health Apps. This positive ATT enhanced their acceptance and expectations of the applications and significantly strengthened their UI (Arkorful et al., 2022; Dangaiso et al., 2024). Further, when students held positive views of m-Health Apps, this ATT, by stimulating positive emotional and cognitive evaluations, effectively facilitated the transition from ATT to behavioral intention, thereby significantly increasing their UI (Siripipatthanakul et al., 2023). Therefore, developers should focus on improving user experience by offering high-quality services and personalized features to enhance users’ positive ATT toward the application, thereby increasing their UI.
The resistance to m-Health Apps among college students significantly negatively influences their UI, indicating that RE is an important factor in inhibiting college students’ use of m-Health Apps, thus validating H7. This is consistent with the findings of Yuduang et al. (2022), who explored the factors influencing the m-Health Apps UI among 251 Filipino users and found that the perceived RE of users had a significant negative impact on their UI. This study further reveals that the greater the RE perceived by students, requiring more time and effort, the more it directly suppressed their UI (Kumari et al., 2024); secondly, when students perceived that the RE exceeded the value they expected from the application, their UI significantly decreased (Sohn & Kwon, 2020). Therefore, developers should focus on the RE users may encounter during use by optimizing application design, reducing usage costs, and enhancing the practicality and convenience of the application to reduce RE, thereby increasing college students’ UI.
RE to m-Health Apps among college students significantly negatively influences their ATT, thus validating H8. This is consistent with the findings of Jan et al. (2023), who explored the factors influencing the use and RE behavior of chatbots among 233 users and found that RE encountered by users significantly reduced their ATT toward use. In this study, students’ perceptions that the costs (whether financial or time investments) of using the application exceeded the value obtained from the application directly strengthened their RE (T. Wang, Wang, et al., 2022). Secondly, frequent updates to m-Health Apps caused inconvenience and dissatisfaction among students, further strengthening their RE (Nezamdoust et al., 2022). These aspects of RE negatively affected their ATT toward the applications. Therefore, developers should optimize the cost structure, provide cost-effective services, reduce the disruption caused by frequent updates, and enhance the user experience and ATT.
ATT toward m-Health Apps among college students plays a complementary partial mediating role between RE and UI, which is consistent with the findings of Ma and Lee (2017) and H. L. Wang, Zhang, et al. (2022), thus validating H9. In this study, when students encountered similar RE while using m-Health Apps, such as complex and difficult-to-use applications, inaccurate information, or privacy concerns, these factors directly led to negative user experiences, such as frustration and disappointment, thereby negatively affecting their ATT and reducing their UI (Li, 2020; Palos-Sanchez et al., 2021). Therefore, m-Health Apps RE leads college students to develop a negative ATT, which in turn reduces their UI.
PU, PEOU, RE, and ATT
The PU of m-Health Apps among college students significantly negatively affects RE, aligning with the findings of Cho et al. (2021), thus validating H10. Cho et al. (2021) investigated the factors influencing nurses’ RE to electronic medical record systems, finding that nurses’ PU and ease of use significantly reduced their RE. In this study, when college students recognize the value of m-health Apps in improving health management, providing medical information, or facilitating health behavior changes, their PU significantly increases, and their RE correspondingly decreases (Li, 2020). Additionally, the efficiency of m-health Apps improves college students’ PU, thereby alleviating RE caused by the inconvenience or difficulty of using the apps (Lu et al., 2023).
RE in m-health Apps among college students plays a complementary partial mediating role between PU and ATT, which corresponds with Yoo (2021) findings regarding Korean consumers’ UI toward unmanned order payment services, thus validating H12. That study confirmed that PU indirectly promotes a positive ATT among consumers by reducing RE. In this study, higher PU among college students significantly reduces their RE and increases their positive ATT toward using the app (Hikmah et al., 2023). Furthermore, the PU of these apps increases students’ trust in them, allowing for more confident use, reducing RE, and significantly enhancing their positive ATT (Li, 2020).
The PEOU of m-health Apps among college students does not have a significant negative relationship with RE, which is inconsistent with the findings of Yoo (2021). Yoo (2021) emphasized that when understanding consumers’ acceptance of new technologies, their PEOU significantly negatively impacts their RE. In this study, college students tend to focus on the functional diversity and practical effects of m-health Apps, valuing the apps’ practicality. They believe that the actual value and benefits of the apps outweigh the convenience and ease of use (Palos-Sanchez et al., 2021); hence, PEOU does not become a barrier for them. Moreover, due to college students’ generally high technological familiarity and adaptability, they can quickly adjust to technological challenges, so PEOU does not significantly negatively impact RE (Palos-Sanchez et al., 2021).
RE does not mediate between PEOU and ATT toward m-health Apps among college students, which is inconsistent with the studies by Cho et al. (2021) and Ma and Lee (2017). An analysis of the inconsistency may be that although there are minor issues regarding the PEOU of m-health Apps, these do not sufficiently affect college students’ overall experience to form enough RE to impact their ATT (Palos-Sanchez et al., 2021).
PVB, PR, PC, RE, and ATT
The PVB in college students’ mHealth Apps do not exhibit a significant negative relationship with ATT, which is inconsistent with the findings of Polisetty et al. (2023). Utilizing IRT and TAM, Polisetty et al. (2023) analyzed the determinants of users’ UI for over-the-top services, finding that PVB significantly negatively influenced their ATT. In contrast, this study focuses on the specific group of college students, who typically possess higher health consciousness and digital literacy. Thus, they are more capable of effectively recognizing and utilizing health resources, and the impacts of PVB, such as cost-effectiveness, accessibility issues, and the practicality of information, are relatively limited (Almasri, 2022). Furthermore, the timely feedback and interactive features of mHealth Apps not only enhance the engagement of college students but also strengthen the practical value of the apps, thereby further weakening the impact of these PVB on their ATT.
The PR associated with mobile health apps do not exhibit a significant negative relationship with ATT among college students, which is inconsistent with the findings of Kwangsawad and Jattamart (2022). Kwangsawad and Jattamart (2022) analyzed consumers’ UI for chatbot services and found that PR significantly negatively affected their ATT. In this study, college students generally view mHealth Apps as highly transparent and credible, perceiving the associated risks as low and manageable (Khan et al., 2019), hence these risks do not significantly impact their ATT. Moreover, since these apps typically provide stringent privacy protections and data security measures, and clearly inform users of potential risks (Klaver et al., 2021), students consider these risks acceptable, reducing the impact of PR on their ATT.
The PC of mHealth Apps does not exhibit a significant negative relationship with ATT among college students, which is inconsistent with the findings of Arora et al. (2023). Arora et al. (2023) analyzed the factors influencing Indian consumers’ purchase intentions for electric vehicles, finding that PC had a significant negative impact on consumers’ ATT. In this study, the diverse functionalities of mHealth Apps provide users with more options. College students can adjust the settings and features of mHealth Apps according to their needs, effectively reducing operational complexity (Mensah, 2022). This, to some extent, mitigates the potential negative impact of PC on ATT (von Kalckreuth & Feufel, 2023). Additionally, college students typically have a high level of technical proficiency and a rapid learning adaptability, enabling them to easily master the various functions of mHealth Apps (Li, 2020). These skills boost their confidence when facing initial operational difficulties, thereby weakening the impact of PC on their ATT.
The resistance in mHealth Apps among college students plays a complete mediating role between PVB, PR, PC, and ATT, consistent with the findings of Polisetty et al. (2023), thus validating H17, 18, and 19. Polisetty et al. (2023), using IRT and TAM to explore consumers’ UI for over-the-top services, found that consumers’ PVB, PR, and PC significantly increased RE and exacerbated negative ATT toward the service. In this study, the initial PVB (such as the cost-benefit ratio of the apps and the applicability of data), PR (such as data privacy and security concerns), and operational complexity experienced by college students in using mHealth Apps did not directly lead to negative ATT (Prakash & Das, 2022). Instead, these perceived barriers were first transformed into specific usage RE, such as ongoing inconvenience and unmet expectations, which gradually evolved into negative evaluations of the apps, ultimately forming negative ATT (Prakash & Das, 2022). Therefore, it is only when these perceived barriers transform into actual usage obstacles and RE that they truly affect their ATT. In summary, PVB, PR, and PC all contribute to increased RE to m-Health Apps among college students, which in turn affects their ATT.
Moreover, different types of m-Health Apps may face varying RE and promoting factors. For example, fitness tracking applications typically need to reduce interface complexity and optimize the user experience to lessen RE among college students; mental health support applications should particularly focus on privacy protection and data security to reduce PR; while telemedicine applications must place greater emphasis on service quality and perceived value. Therefore, in the future design and promotion of m-Health Apps, differentiated strategies should be developed based on the specific category and purpose of the application. This approach will help effectively reduce RE to use among college students and enhance their actual UI.
Implications
This study integrates the TAM with the IRT to explore the impact of PVB, PR, PC, PU, PEOU, RE, and ATT on the UI of m-Health Apps among college students. The model accounts for 57.7% of the total variance in students’ UI. Moreover, based on the normalized importance derived from the multilayer perceptron, the most critical predictive factor identified in this research is ATT (100%), followed by PU (52.0%). These findings emphasize the central role of ATT in the formation process of UI and confirm the significance of PU in enhancing UI. Thus, this study provides a more accurate method for predicting UI and offers valuable theoretical and practical insights for understanding and promoting the acceptance and use of m-Health Apps.
Theoretical Implications
First, this study integrates the TAM and IRT to explore both the positive and negative factors influencing college students’ use of m-Health Apps. Although similar barrier factors have been addressed in earlier studies, the uniqueness of this study lies in its incorporation of specific data from the college student group, clarifying how these factors impact their UI. By analyzing behaviors specific to the college student population, this research further investigates the mechanisms through which these factors operate in the actual usage process, filling the gap in the existing literature regarding the factors influencing college students’ use of m-Health Apps. In doing so, this study not only deepens the application of TAM and IRT theories but also provides a fresh theoretical perspective on how improving college students’ ATT can reduce barrier factors (RE) and enhance their UI.
Second, this study contributes to the exploration of the interaction mechanisms between RE, ATT, and UI, which has been understudied in previous research. It finds that ATT mediates the impact of RE on UI. Specifically, RE influences users' ATT, which in turn affects their application UI. Additionally, this study further discovers that RE fully mediates the relationship between PVB, PR, PC, and ATT. In other words, these barriers only influence ATT when they are transformed into specific usage RE by college students. This mediating effect not only enriches the application of IRT and TAM, but also provides new theoretical support on how improving user ATT can reduce RE and enhance UI.
Finally, unlike existing linear model studies, this research employs a two-stage SEM-PLS-ANN method, combining both linear and nonlinear analyses. Through this innovative approach, this study successfully addresses the limitations of traditional linear models, particularly in capturing the nonlinear relationship between RE and ATT within the college student group. The use of the ANN method further confirms the high predictive accuracy of the data and highlights the most influential independent variables on UI, offering new theoretical contributions to the existing literature.
Practical Implications
For college students, this study highlights the importance of fostering a positive ATT and reducing RE to enhance m-Health Apps UI. First, since PU has a significant direct impact on ATT, college students should fully recognize the specific benefits of m-Health Apps in health management, such as health data tracking and the creation of diet and exercise plans, which can help foster a positive ATT. Second, since PC is a major factor influencing RE, students should choose applications with simple interfaces and easy operations, while also focusing on the privacy protection measures of the applications, which will help reduce RE and increase UI.
For application developers, this study emphasizes the significant impact of user ATT and RE on UI. Developers should design differentiated development and promotion strategies for different types of m-Health Apps: fitness tracking applications should focus on simple and intuitive interface and functionality to reduce users’ perception of complexity; mental health support applications should strengthen privacy protection and data security to alleviate users’ privacy concerns; telemedicine applications should highlight the reliability and professionalism of their services, clearly demonstrating their value advantages to reduce users’ PVB. Additionally, this study found that RE fully mediates the relationship between PVB, PC, and PR with ATT. Developers should reduce these barriers by strengthening data protection, providing educational materials for users, and implementing reasonable pricing strategies. Finally, considering that user ATT has a significant positive impact on UI, developers should actively promote the actual benefits of the application through social media and success stories to improve user satisfaction and continued UI.
Limitations and Future Research
By integrating the TAM with IRT, this study has constructed a comprehensive model exploring college students’ UI for m-health Apps. Nevertheless, the study’s limitations also provide new directions for future exploration. Firstly, this research focused on the impact of barrier factors on RE, ATT, and UI and specifically examined the mediating role of ATT between RE and UI, as well as the mediating role of RE between PVB, PR, PC, and ATT, but did not involve potential mediating variables such as satisfaction and word of mouth. Therefore, subsequent studies have the opportunity to enrich the current theoretical model by incorporating these variables. Additionally, data collection in this study primarily relied on a questionnaire survey, with participants mostly consisting of undergraduate students aged 18 to 20 from a region in China. This age group is generally familiar with technology, and Chinese users may be more inclined toward collectivist values, sensitivity to privacy protection, and a cautious attitude toward new technologies. These cultural factors may have a potential reinforcing effect on variables such as PR, PC, and PVB identified in this study, which could limit the generalizability of the findings. Future research should expand the sample scope to include individuals from different regions, cultures, and age groups to enhance the broad applicability and depth of the research findings. Furthermore, the conclusions of this study are primarily drawn for the specific field of m-Health Apps, and the influencing factors and mechanisms revealed may not be directly applicable to other types of mobile device technologies or application scenarios. Future studies could further explore the applicability of these factors in other mobile technology fields to validate the generalizability and boundary conditions of the conclusions of this research. Finally, the study did not specifically differentiate the types of RE (such as active or passive RE) and their specific impact on UI. Future research can explore the specific roles of different types of RE to more effectively guide the promotional strategies for m-Health Apps.
Conclusion
This study aimed to explore the factors influencing college students’ UI for mobile health applications and delved into how resistance mediates the impact of perceived value barriers, perceived risk, perceived complexity, perceived usefulness, and perceived ease of use on UI and the mediating role of attitudes in the impact of resistance on UI. Most hypotheses were validated by collecting self-reported data from 879 college students using the Questionnaire Star and empirically testing 19 hypotheses. Attitudes was the most significant predictor of the factors influencing UI, followed by resistance. Among the factors influencing attitudes, perceived usefulness, and perceived ease of use significantly affected attitudes, while resistance significantly negatively affected attitudes, but perceived value barriers, perceived risk, and perceived complexity had no significant impact on attitudes. Among the factors influencing resistance, perceived value barriers, perceived risk, perceived complexity, and perceived usefulness significantly affected resistance, while perceived ease of use had no significant impact on resistance. The mediating effect analysis showed that attitudes play a complementary partial mediating role between resistance and UI. Additionally, resistance fully mediated the relationship between perceived value barriers, perceived risk, perceived complexity, and attitudes and partially mediated the relationship between perceived usefulness and attitudes. However, resistance did not play any mediating role in the impact of perceived ease of use on attitudes. Finally, the artificial neural networks method analysis showed that attitudes is the most critical predictive factor, with a normalized importance of 100%, followed by perceived usefulness (52.0%) and resistance (28.2%). This study not only deepened the understanding of the resistance mechanisms in college students’ use of mobile health applications but also provided practical guidance for the promotion and application development of health apps.
Footnotes
Appendix A
Scales of all constructs.

| References | Constructs | Item |
|---|---|---|
| Chakraborty et al. (2022) | PR1 | I am concerned that m-health Apps may not maintain the confidentiality of users’ personal health information. |
| PR2 | I am worried that my personal privacy might be disclosed or misused without my knowledge while using m-health Apps. | |
| PR3 | I am concerned that sensitive personal information may be accessed, misused, or disseminated by unauthorized individuals during the use of m-health Apps. | |
| PR4 | Due to security concerns, I am worried about the disclosure of personal information when consulting doctors online about sensitive health issues. | |
| Prakash and Das (2022) | PVB1 | Using m-health Apps may result in some time or financial losses for me. |
| PVB2 | I am aware of better, alternative m-health Apps available. | |
| Prakash and Das (2022) | PC1 | It is difficult for me to learn how to use m-health Apps. |
| PC2 | I think m-health Apps are hard to use. | |
| PC3 | I am worried that m-health Apps are cumbersome, and I am not confident about learning to use them. | |
| Chouk and Mani (2019) | RE1 | I have a negative opinion about m-health Apps. |
| RE2 | I disapprove of m-health Apps. | |
| RE3 | I don’t like using m-health Apps. | |
| Ren and Zhou (2023) | PEOU1 | The use of m-health Apps is simple and convenient. |
| PEOU2 | The user interface of m-health Apps is clear and easy to understand, which does not hinder my usage. | |
| PEOU3 | Overall, m-health Apps are easy to use. | |
| Ren and Zhou (2023) | PU1 | Using m-health Apps helps me collect, manage, and view personal health-related information. |
| PU2 | Using m-health Apps allows me to better manage my own health. | |
| PU3 | Using m-health Apps enables me to quickly and conveniently understand my health data. | |
| Ren and Zhou (2023) | ATT1 | I think using m-health Apps is valuable. |
| ATT2 | My evaluation of m-health Apps is positive and proactive. | |
| Ren and Zhou (2023) | UI1 | I think using m-health Apps is a good idea. |
| UI2 | I feel that it is very likely that I will use m-health Apps. | |
| UI3 | I am willing to use m-health Apps in the future. |
Ethical Considerations
This study was conducted in accordance with the ethical standards of the Ethics Committee of Henan University of Economics and Law and the 1964 Helsinki Declaration and its later amendments. The research protocol was reviewed and approved by the aforementioned board (Approval Number: HUEL-2023-03-11).
Consent to Participate
All participants voluntarily participated in the study after providing written informed consent. Participants were informed about the purpose of the research, their right to withdraw at any time, and the confidentiality of their responses. No identifying information was collected. The potential risks were minimal and did not exceed those encountered in daily life.
Author Contributions
Conceptualization: Yuchen Yang; Methodology: Yuchen Yang; Formal analysis and investigation: Shanshan Xu; Writing—original draft preparation: Yuchen Yang; Writing—review and editing: Shanshan Xu; Supervision: Yuchen Yang. All the authors have read and agreed to the published version of the manuscript.
Funding
The authors received no financial support for the research, authorship, and/or publication of this article.
Declaration of Conflicting Interests
The authors declared no potential conflicts of interest with respect to the research, authorship, and/or publication of this article.
Data Availability Statement
The data that support the findings of this study are available on request from the corresponding author.