
Abstract
The aim of this article is to investigate the influence relationships between factors of an extended model of TAM (Technology Acceptance Model) and the behavioral intention of professors for the acceptance and use of information and communications technology (ICT) in work environment. The model used in this research includes, besides the original TAM variables, another five external variables. Twelve research hypotheses regarding the relationship between TAM factors and the intention and acceptance of ICT in the work environment were elaborated. Data collection was done through a questionnaire available on the Google doc platform to the teachers of the educational institution. The sample is formed by 147 teachers from several courses of one institution in the State of Paraná, Brazil. Initially, the demographic profile data were treated using descriptive statistics, confirmatory factorial analysis, and structural equations, which were the techniques used to test the research hypothesis. All research hypotheses based on the original TAM model were corroborated. Regarding the extended model, one of the external variables was not valid and was excluded from the proposed relations by two hypotheses referring to this construct. The results of the multigroup analysis—which includes the variables demographic, gender, age, schooling, and working time in the institution—showed the significant moderating effect of relationship only for the educational variable.
Introduction
In business organizations, information and communications technology (ICT) stands out when it is designed as a strategy to improve operations and provide information, resulting in a competitive advantage over competitors (Mitić et al., 2017). In this context, for Holland and Light (1999), if ICT is well structured, it can support the business vision and strategies of the company.
ICT is configured in all hardware, and its devices and peripherals, and software and its resources (networks, databases, sets of systems, processes, applications, technological and computational resources, telecommunications, automation, multimedia resources, telecommunications, and management systems of data) which are destined to generation and use of information operationalized in different ways and are used in the production of goods and services, with the purpose to lead the company to reach its organizational objectives (Buabeng-Andoh, 2018; Laudon & Laudon, 2011; Laurindo et al., 2001; O’Brien, 2004; Rezende & Abreu, 2013; Salehan et al., 2018; Shaikh & Karjaluoto, 2015; Turban et al., 2007; Vieira & de Faria Brezolin, 2013).
J. E. L. Gonçalves (1994), reflecting on a broad concept of new technologies and technological innovations, argues that these resources produce wide effects in the accomplishment of work in the most varied points of view, including the psychological one. For Bueno and Salmeron (2008), organizational changes in the implementation of new ICT tools can generate feelings of demotivation and detachment in final users. The adoption of an innovation, for Perez et al. (2012), is a process in which individuals and groups decide their use as the best available course of action; however, it may occur as its rejection, characterizing the decision by nonadoption.
The Technology Acceptance Model (TAM) proposed by F. D. Davis (1989) has been highlighting and gaining ground in research. Venkatesh and Davis (2000) note that much of the significant progress made in recent decades to explain and predict user acceptance of information technology in the workplace has substantial support in the TAM model (Al-Emran et al., 2018; Scherer et al., 2019).
Sánchez-Prieto et al. (2016) proposed a model based on TAM including five variables, with the preceding two directly linked to the behavioral intention, making it possible to identify with more precision the influencing factors in the acceptance of ICT resources by users. For Bueno and Salmeron (2008), rejection of innovations is a normal occurrence. Lucas and Henry (2006), about rejection of innovations, argue that the change resulting from implementation of ICT bothers people satisfied with the status quo, inducing them to adhere to rejection and contributing to the failure of the strategy adopted by the organization. For Bueno and Salmeron (2008), the success or failure of ICT implementation is defined by the intention of the final users to use these tools. Along these lines, Arnold et al. (2015) argue that the use of ICT in the organizational context can be restricted if people are not able to operate them, resulting in the lack of operational structure of these systems in leveraging the strategies of the company.
This research was developed in a private higher education institution in the city of Curitiba, Paraná, where its modernization process of academic management is available to professors in ICT resources for daily administrative and classroom activities. In a context of the importance of ICT to leverage business success and the risk of failure due to rejection of its users, the objective of the research is to investigate the influence relationships between the factors of an extended model of the TAM (F. D. Davis, 1989) and the intention behavior of professors from a private higher education institution for the acceptance and use of ICT in the work environment.
This article makes important contributions to the study of the influence relationships between the factors of an extended model of the TAM (F. D. Davis, 1989) and the behavioral intention of professors for the acceptance and use of ICT in the workplace. The first contribution of this work is about a base composition of empirical studies related to the subject and that is still lacking discussions and empirical investigations on the factors that influence the use and the intention of the use of technological resources by professors. The second contribution is related to the influence of the factors Perceived Usefulness (PU) and Perceived Ease of Use (PEU) on behavioral intention (BI), corroborating again with the results of the original TAM model proposed by F. D. Davis (1989). Finally, the third contribution is to expand the research of Sánchez-Prieto et al. (2016) with the inclusion of the multigroup analysis, as the original work does not suggest dividing the sample into groups to verify the mediating effects of sociodemographic variables. In this context, the results of the multigroup analysis for gender, age, and educational level can be extended to the social context, as these data do not have a direct link with Higher Education Institutions (HEIs).
Although there are many research works about the TAM in the context of information technology, it is difficult to find studies that work with the TAM model from a multigroup analysis approach. This analysis also allows for a contribution with the work of Sánchez-Prieto et al. (2016), as the original study does not suggest dividing the sample into groups to assess the mediating effects of sociodemographic variables. This study also provides a more in-depth look into the development of research hypotheses, which, in the original study, was carried out in a more summarized manner, thus contributing to the understanding of relations between variables, especially the latent ones, which were inserted into the model after several studies were consulted.
For this purpose, this article is divided into five sections. The next section will present the theoretical-empirical framework and the research hypotheses. Section “Method” describes the methodology, and section “Results and Discussion” presents the discussion of the results. The work is completed by a conclusion and suggestions for future research.
Theoretical-Empirical Framework and Research Hypotheses
Private HEI (the Organization) and Context
The organizations seek to differentiate themselves from the competition and, with this positioning, to gain a competitive advantage. ICT can be integrated as a key element in the development of competitive strategies (Baydas & Goktas, 2016; Ferraro, 2018; Mitić et al., 2017; Stolaki & Economides, 2018). A private HEI in the city of Curitiba, Parana, Brazil, aligned with this thought, made the decision to adopt and implement technology, which was made available to professors for use in the classroom in the activities resulting from the teaching exercise, understood as administrative and support to classes. The purpose of HEI management is to have more control, efficiency, cost reduction, standardization of user activities, and greater quality and agility in the services provided.
The administrative activities comprise the attendance control, registration of student evaluation grades, content in class diaries, and other activities of professors’ responsibility in addition to the classroom. The technologies available to professors are interconnected with the internal software of the HEI so that all the records made by professors are stored on servers, allowing access to users (administrative employees) and all the information necessary for the progress of routine activities. Teaching activities are those that involve classroom teacher routines, such as conducting research for lesson preparation, providing material to students via network, accessing basic application packages such as spreadsheets for calculations, text editors, and slide presenters.
Relationship Between PU and BI
One of the fundamental determinants for the user to accept new technologies is PU, which preconize that the application will be used by an individual as far as they think it will help them to do their job better (F. D. Davis, 1989). In the same way, H. W. Kim et al. (2009) define the PU as the perception of the user regarding the increase in performance in carrying out their activities provided by the use of a specific technology. That said, Saccol (2009) affirms that a technology is perceived as useful when there is a positive relationship between its use and performance at work, which can be exemplified by the elements of effectiveness, time savings, greater control, productivity, and quality.
In this way, the expectations of users about the benefits of such technological resources in the organizational context make the behavioral intention more accentuated as far as such expectations of benefits are more positive. The more the user believes that ICT will facilitate their work and increase their performance in relation to it, the greater the behavioral intention to use them.
Considering that, the hypothesis proposed for this variable is presented as described below:
Relationship Between PEU, BI, and PU
PU, another factor considered by F. D. Davis (1989) as fundamental in the influence of decisions to use ICT, is the perception of users regarding the ease of use of ICT, presented here by the construct PEU. In this way, PEU is defined as the degree at which the individual believes that the use of technological resources will be effortless (Bischof-Dos-Santos et al., 2017; Venkatesh et al., 2011). Saccol (2009) points out the sense of effort, considering that it can be understood at both the physical and mental level, also considering that there is no difficulty in learning how to use the tool to become skilled at using it.
Considering the above, the perception of the individuals about the effort to be released may have an impact on the behavioral intention, which may influence the actual behavior. In this way, individuals tend to have a more positive behavioral intention in relation to the use of ICT as they perceive that they are not difficult to use. In this context, the second and third hypotheses to be tested can be described as follows:
Relationship Between Subjective Norms (SN), PU, and BI
Among external influences that may impact behavioral intention, there is SN, which is related to what other people think about the behavior of the individual.
In this way, SN talk about the social influences that refer to the perception of the individual regarding the opinion of the people who are important to him or her about whether or not to adopt behavior (F. D. Davis et al., 1989; Flanders et al., 1975; Rise et al., 2010; Santos et al., 2011).
Given the context of SN, it is understood that the intention of the individual in performing the behavior will be greater as he or she realizes the approval of the people who are important to him or her about the performance of that behavior (Ajzen & Fishbein, 1980; Flanders et al., 1975; Rise et al., 2010). Therefore, if the individual realizes that people who are important to him or her think that he or she should use technological resources, automatically their intention in performing such behavior will be greater.
On this subject, Venkatesh and Davis (2000) report that in the internalization (internal environment) SN has an indirect effect on behavioral intention, being intermediated by PU. According to the authors, in the context of internalization, if superiors or co-workers suggest that ICTs are useful, the individual can believe that they really are and, in this way, form the intention to use them.
Given the context, there are Research Hypotheses 4 and 5, respectively, for the construct SN, described as follows:
Relationship Between Self-Efficacy (SE), PEU, and Anxiety (ANX)
Among the factors that can influence the behavior of individuals in the face of technological innovations, the literature also points to SE, which is contemplated in social cognitive theory of Bandura (1978) and considers that human thought and action are products of interpellation among personal, behavioral, and environmental influences (Alvarenga & Azzi, 2010).
According to Bandura (1978), SE refers to beliefs of the individual about their value and potential, and this construct requires skills and willpower to perform specific actions. In addition, Zimmerman (2000) argues that SE has its focus measured on performance capacity and not on personal qualities such as physical or psychological characteristics.
Thus, SE can influence or be influenced by the environment in which the individual is inserted, once his perception about the ability to perform certain behavior can be a determining factor in the accomplishment of this fact. In the same way, there are factors that can motivate the individual in the accomplishment of such behavior, and in this way, Guerreiro Pedro (2011) postulates that the SE associates not only with the capacities that the individual possesses but also with what he or she believes to be able to do with the means that he or she has under a variety of circumstances, as well as its motivation to do it.
Considering the perception of the individual about the resources that can help him or her in the use of ICT and his or her feelings regarding the use of these tools, the hypotheses proposed to construct SE are presented:
Relationship Between Anxiety and PEU
Feelings related to alterations in the work environment generate expectations due to the ignorance of the implications of these changes in daily routine, which ends up shaking the behavior of the individual. Emotions caused by unknown contexts are conducive to formation of anxiety, which is conceptualized by Castillo et al. (2000) as vague and unpleasant feelings of fear and apprehension, which are generated due to the tension of danger anticipation or something unknown to the individual. Pitta (2011) complements that anxiety can be considered as a warning signal that leaves the individual attentive to threats coming from external reality, characterized by an unpleasant feeling of negative apprehension about the future. For Sánchez-Prieto et al. (2016), anxiety is defined as a degree of apprehension of an individual when he or she is faced with the possibility of using ICT resources.
Ponte (2000) affirms that although the implementation of ICT in the organizational context brings many benefits, it has to be alert to the undesirable problems that it can cause in human activity, once it has diverse effects that can create anxiety and adaptation problems. According to Tarafdar et al. (2007), ICT induces users to feel anxious and tensed, leading them to nervousness and apprehension in the interaction with technologies, which can lead to psychological effects such as insecurity and decreased confidence in their use. According to the author, individuals may feel bothered by feelings of helplessness, resulting in aversion and phobia about the use of technological resources.
Given the context about the ANX in the implementation of technological innovations in an organizational environment, the eighth research hypothesis is presented:
Relationship Between Facilitating Conditions (FC), PEU, and BI
FC are an integral part of control beliefs and refer to available resources to facilitate the achievement of behavior (Santos et al., 2011). Similarly, Sánchez-Prieto et al. (2016) state that this construct measures the perception of the individual about resources at his or her disposal to support his or her behavior.
In this way, the greater the perception of the individual about resources that will facilitate the use of ICT in the work environment, the greater his or her behavioral intention in using these tools. Any forms found by the organization to facilitate the interaction of the individual with ICT are considered as valid, such as training, availability of technicians or people qualified to teach the use, and manuals. On the contrary, once the individual perceives the existence of these facilitating factors of use, this fact may also influence in a positive way the PEU by the individual.
Based on the above, there are the following research hypotheses for the FC construct:
Relationship Between Resistance to Change (RC), PU, and BI
Jiang et al. (2000) affirm that RC by the users is considered as a key factor responsible for problems in the execution of innovations. Corroborating, Lapointe and Rivard (2007) point out RC as a critical point that often prevents the organization from receiving the benefits of implementing new projects. To J. M. Gonçalves and da Silva Gonçalves (2012), resistance plays a decisive role that emphasizes all aspects of change.
RC can be considered as one of the main problems in the implantation of ICT in the organizational context (Jiang et al., 2000), as what defines the acceptance or resistance in the use of new resources by its users is the evaluation made by the impact of changing these new features in their work environment (Joshi, 2005; Oreg, 2006). In the same sense, Y. J. Kim and Kankanhalli (2009) point to RC as the factor of greater weight in the occurrence of failure during the implantation of ICT.
The attitudes of ICT users toward to the changes imposed by them can be diverse and unpredictable, and the result usually is the resistance to their use. In this way, Keen (1981) argues that the change brought with the implantation of ICT threatens the interest of individuals invading their territory, limiting their autonomy and reducing their influence, which are reasons to resist their acceptance.
RC is a phenomenon that must be understood and administrated (Y. J. Kim & Kankanhalli, 2009), and managers should communicate and consult with their subordinates regularly giving them the opportunity to provide feedback on their perception of the use of ICTs (J. M. Gonçalves & da Silva Gonçalves, 2012). In this way, it is understood that the breakdown of resistance must be worked together with the implementation of ICT, and efforts must come from the management of both the entity and the individual, who must see not only the restrictions that resources impose on him or her but also all the benefits provided by them.
Based on what had been previously exposed, the research hypotheses can be described as follows:
This research adopts the theoretical model proposed by Sánchez-Prieto et al. (2016). The aim of the model is to explore and identify the determinants of the acceptance of mobile technologies by professors. The authors will develop it with the purpose of expanding the TAM model. The original TAM model proposed by F. D. Davis (1989), despite its theoretical solidity, is quite simple and presents some limitations. Therefore, the need to include new constructs for greater efficiency in behavioral predictions of individuals is evident.
Although the study was based on a preexisting model, proposed by Sánchez-Prieto et al. (2016), this research opted to redevelop the hypotheses that make up this model to give more clarity to the relation between variables. That was done because the focus of the original study was the presentation of the model, emphasizing the stages of its creation, meaning that the authors offered only a summarized context for the development of the hypotheses.
Figure 1 presents the model with the variables and hypotheses proposed by Sánchez-Prieto et al. (2016). Figure 1 details the variables: BI (dependent variable), PEU, and PU (independent variables). The model indicates the possible relationships between the independent variables and the dependent variable. On the contrary, it is observed that the external variables, which were added to be the extended part of the model, can observe the positive and negative relations of the dependent variables with themselves and also the variables of the TAM model. Finally, supported by Sánchez-Prieto et al. (2016), the questionnaire was prepared and made available to the HEI professors. The objective of the questionnaire was to collect data about the perception of professors regarding the acceptance and use of the technological resources to be adopted by the institution as new tools of support in the activities of the teachers.

Proposed theoretical model and research hypotheses.
In this study, as well as in the base study, the dependent variable is the BI of the respondents, as opposed to the original study by F. D. Davis (1989), in which the dependent variable is the actual use of technology. As explained by Sánchez-Prieto et al. (2016) in their investigation, the construct Actual Use (AU) was not maintained due to the heterogeneity of technological resources available in schools, as well as the dispersion of schools in the region in which the research was carried out, which could mean that, in some of these schools, technology would not be available, making it inadequate to carry out a study that evaluated the real use of these resources. Following the same line of reasoning, in this research, technological resources were still not fully available for respondents, but were being implemented in the institution. Therefore, it was also inadequate to use the AU construct as a dependent variable, and the model proposed by Sánchez-Prieto et al. (2016) was adopted.
Method
Population and Sample
The target population of the study is 450 professors from a private HEI, located in the city of Curitiba, Parana, who were invited to participate in the research via email. The questionnaire was made available to participants in the Google Docs platform. The data collection period was from November 4 to December 24, 2015, coinciding with the implementation of new technologies in the HEI. In all, 150 professors answered the questionnaire. Three questionnaires were excluded because they were incomplete. The final sample had 147 valid questionnaires and met the requirement of the minimum number of cases to use the structural equation modeling (SEM) in the data treatment. For Bido et al. (2009), the minimum number should vary between 5 and 10 cases per estimated parameter.
Instrument, Collection, and Data Treatment
To collect data, a questionnaire was adapted from the work of Sánchez-Prieto et al. (2016) and structured in two blocks: (a) the first compound of 26 assertions to capture the perceptions of the respondents regarding the model variables, and (b) the second block about the demographic characteristics of research participants. The authors proposed the extension of the TAM model, including the original five other variables which could have effects on the two directly related to the behavioral intention. The validation of the instrument was performed in three stages.
In the first, the instrument was made available to a group of experts to make an independent evaluation of each item, using pertinence, clarity, and relevance as criteria. In the second, the specialists were asked to evaluate the quality of the constructs, with the dimension validity, strengths and weaknesses of the dimension, and a section for observations and suggestions being used as criteria. In the last step, evaluators judged the ability of the instrument to evaluate the acceptance of technologies based on the following criteria: overall tool validity, suitability, and relevance of dimensions.
After the process, the evaluators provided opinion about the instrument and made observations with suggestions for adjustments. Most of the suggestions were related to an improvement in the clarity of the formulation and reduction in the number of items per construct to avoid redundancies. The items that compose the data collection instrument were measured by means of a Likert-type scale of seven points, varying from totally disagree to fully agree.
To identify problems in the instrument, pretest procedures were performed. At first, the face validity or apparent validity was made, which according to Urbina (2007) refers to the concepts used in the formulation of variables to verify whether the language is in agreement with what it is proposed to measure, that is, referring to the superficial appearance of what is being measured and should be understandable to a common examiner or to any person who is not familiar with the subject.
The theoretical model used shows a causal relation between dependent and independent variables, but it is necessary to estimate the levels in which they are related. Therefore, a choice was made to use SEM estimated using partial least squares (PLS) based on the variance as a technique for data treatment. This technique is recommended when the objective of the model is predicting, when there might be formative or reflexive indexes, and with regard to precision, as it is consistent according to the size of the sample (Zwicker et al., 2008). A multigroup analysis was also carried out to verify whether sociodemographic variables exert moderation effects on the relations between the variables of the model.
Results and Discussion
Descriptive Analysis of the Sample
Male respondents represent 51.02% (n = 75) of the sample and female respondents 48.98% (n = 72). The average age of the respondents is 45 years, given a minimum and maximum interval, respectively, of 27 and 65 years. The distance between the minimum and maximum ages is 38 years, showing distant extremes between them. The age that stands out the most or the mode evidenced by the analysis is 53 years, having been above the median, which is 44 years.
It was tried to evidence teachers’ education levels in terms of distribution of frequencies of the educational profile. The academic level that stands out most is the academic master degree (39%, n = 57), followed by 23% of professors who have a specialization or MBA (n = 34). As a result, professors with a doctorate degree totaled 27% of the sample with n = 39, another 16 who attended a professional master’s degree with a percentage of 11%, and only one with a postdoctoral degree.
Most of the professors of the HEI have stricto sensu postgraduation, once the numbers of respondents of academic masters, professional masters, doctorate, and postdoctorate have been summed up to a total of 113 teachers, representing 76.87% of the sample. On the contrary, teachers with specialization and MBA totaled 34.23% of the sample, which shows that increasingly both teachers have been seeking higher qualification in their training, as the HEIs have been demanding this improvement.
Regarding the working time of professors in the HEI, it is observed that the average years of work of the professors in the HEI is 8.82 years, and the minimum and maximum values are 1 and 33 years respectively, with a distance between them being 32 years. The number of years that has more respondents (mode) is 2 and the median is 7. Checking whether the average has a good representativeness of the data, the values of the variance and the standard deviation were observed, and they were left with scores of 46.653 and 6.83, respectively.
Evaluation of the Measurement Model
To evaluate the quality of a model, it is basically divided into two steps, the first being the measurement model and the second the structural model (Hair et al., 2009).
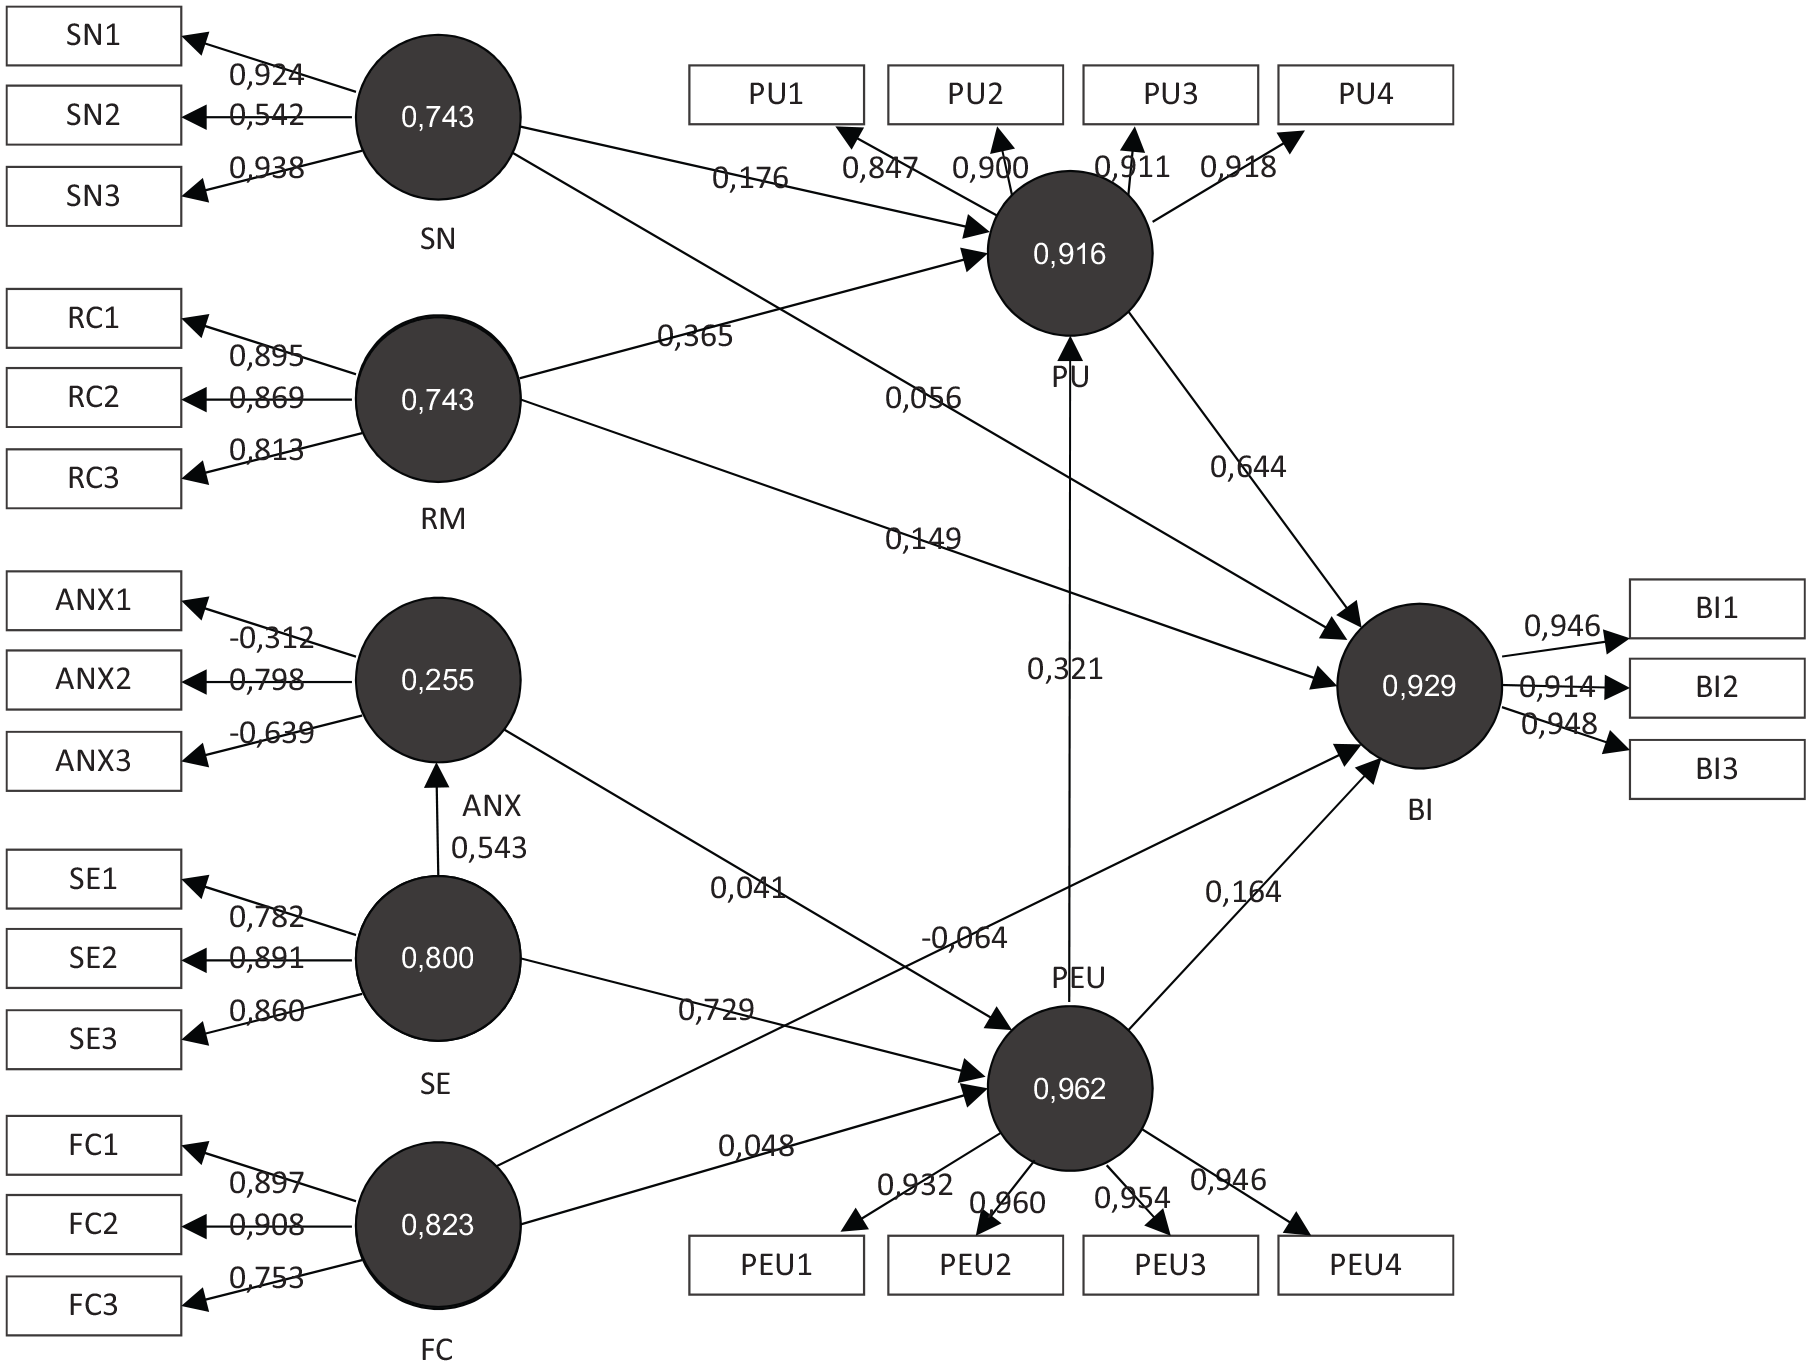
For the evaluation of the measurement model, the SEM technique is used through the software SmartPls v. 3.2.6. The SEM involves a combination of factorial analysis and multiple regression analysis, which enables the evaluation of both models. Figure 2 shows the estimation of the exploratory model visually.
Exploratory research model (first evaluation).
Evaluating the estimates presented in Figure 2 together with the results of the indicators in Table 1, the criteria of the confirmatory factor analysis are obtained, with the performance indices of the constructs analyzed for the convergent validity and internal consistency.
Estimation of Convergent Validity and Composite Reliability.
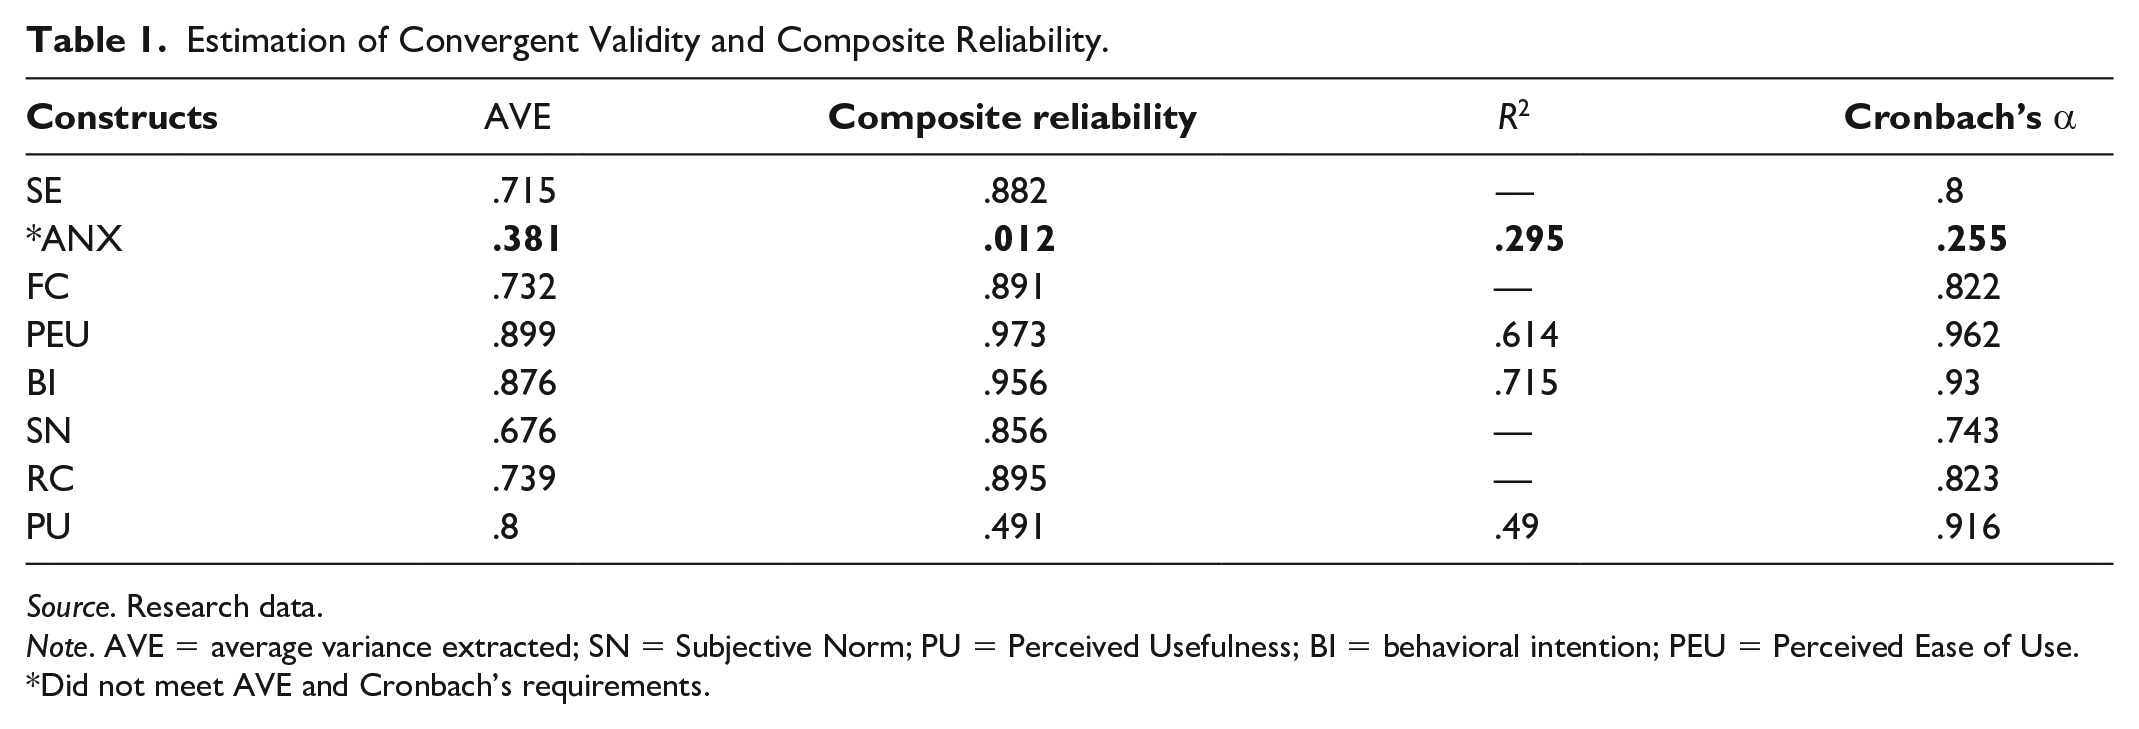
Source. Research data.
Note. AVE = average variance extracted; SN = Subjective Norm; PU = Perceived Usefulness; BI = behavioral intention; PEU = Perceived Ease of Use.
Did not meet AVE and Cronbach’s requirements.
According to Hair et al. (2009), the average variance extracted (AVE) value must be equal to or higher than .5 for the latent variables. The data presented in Table 1 show that the ANX construct is below the minimum value specified in the literature, with a value of .381, which shows that this factor has no convergent validity. The other constructs have AVE values higher than .5, indicating that they have the convergent validity.
For the composite reliability item, the constructs must have values equal to or greater than .7 to be valid (Hair et al., 2009). According to Table 1, the ANX construct presented a value far below the specified one, that is, .012. Thus, it does not present composite reliability. All other constructs present values higher than those indicated in the literature.
In the evaluation of internal consistency, the Cronbach’s alpha of the construct presents the reliability measure that varies from 0 to 1, and values of .60 to .70 are considered the lower limit of acceptability (Hair et al., 2009). In this item, again the ANX construct presented deficiency, being left with .255, evidencing the lack of reliability. The other constructs had acceptable values, above the limits indicated by the literature that have internal consistency.
According to the discriminant validity, it was noticed that the SN construct has an indicator with a lower value than the correlation with a latent variable; however, the difference is very small. All other indicators present higher loads, indicating the discriminant validity of the same. In addition, all the constructs have the square roots of the upper AVE in relation to the correlations with the other latent variables, indicating the existence of discriminant validity.
As the ANX construct presented problems in two indicators in all the other tests, it was chosen to remove it from the model, once the elimination of the two indicators would leave only one for the measurement of the construct, which would increase the value of the items that measure the internal consistency of the model. External loads should exceed .7, and items that are not highly correlated to the other indicators of a factor should be eliminated. Thus, the construct was excluded from the model, and H7 and H8 hypotheses, which deal with the proposed relationships of this factor, are also eliminated.
Therefore, the model was adjusted and tested in SmartPls 3.2.6 software again, and the ANX factor was excluded due to the problems with the two indicators. The new adjusted model presents seven factors, and the results of the validation analysis are presented in Table 2.
Convergent Validity and Composite Reliability of the Adjusted Model.

Source. Research data.
Note. AVE = average variance extracted; SN = Subjective Norm; PU = Perceived Usefulness; BI = behavioral intention; PEU = Perceived Ease of Use.
Based on Table 2, it is observed that all factors present validity in all items, as it presented the AVE lower than .5, which is the minimum value recommended in the literature. Calculated values for the composite reliability and Cronbach’s alpha were also above the established one, which confirms the reliability and the internal consistency of the factors.
In the case of discriminant validity of the factors, after the estimation of the adjusted model, the cross load of the indicators was compared with the latent variables of the other indicators. The existence of discriminant validity of the estimated model was observed once the correlations between the latent variables are smaller than the square root of the AVE.
Estimation of the Structural Model
As a next step in the procedures, the validation of the structural model was developed. In Figure 3, it is possible to observe the values of R2 evidenced for the variables PU, PEU, and BI.

Estimation of R2 coefficients of constructs.
As shown in Figure 3, it is observed that the PU variable is explained by three other variables, namely, PEU, SN, and RC. The R2 value evidenced for the PU variable is .490, demonstrating that the explanatory power of the PEU, SN, and RC variables on it is 49%. It can be said that the SN, the RC, and the PEU have 49% variability in the PU of the users regarding the use of ICT. Note that SN, RC, and PEU together do not explain 50% of the PU, indicating the existence of other latent variables that have a greater power of explanation on this factor.
The second variable to be correlated with the other two is PEU, with the variables SE and FC as predictors. The R2 value shown in Figure 3 for this variable was .606, demonstrating that the two predictor variables have more explanatory power over it (60.6%) than the three predictors of PU.
Finally, we have R2 obtained for BI, the independent variable that has as its role to evidence the intentions of attitudes of professors regarding ICT resources. BI correlated directly with the other five variables, namely, PU, PEU, SN, RC, and FC. The correlation coefficient of R2 evidenced by the analysis was .715, showing that BI has its variation explained in 71.50% by the predictor variables. Given that value, according to Rumsey and Spalart (2009) it can be affirmed that as values above .7 for R2 are considered high, the independent variables explain a lot of BI, allowing to infer that approximately 71.50% of the variability found in the behavioral intention of professors in relation to the acceptance and use of ICT is explained by the variables PU, PEU, SN, RC, and FC. Thus, the high value found for R2 points to a well-structured model (Rumsey & Spalart, 2009).
As shown in Figure 3, it is observed that the PU variable is explained by three other variables, namely, PEU, SN, and RC. The R2 value evidenced for the PU variable is .490, demonstrating that the explanatory power of the PEU, SN, and RC variables on it is 49%. It can be said that the SN, the RC, and the PEU have 49% variability in the PU of the users regarding the use of ICT. Note that SN, RC, and PEU together do not explain 50% of the PU, indicating the existence of other latent variables that have a greater power of explanation on this factor.
The second variable to be correlated with the other two is the PEU, with the variables SE and FC as predictors. The R2 value shown in Figure 3 for this variable was .606, demonstrating that the two predictor variables have more explanatory power over it (60.6%) than the three predictors of PU.
Finally, we have R2 obtained for BI, the independent variable that has as its role to evidence the intentions of attitudes of professors regarding ICT resources. BI correlated directly with the other five variables, namely, PU, PEU, SN, RC, and FC. The correlation coefficient of R2 evidenced by the analysis was .715, showing that the behavioral intention has its variation explained in 71.50% by the predictor variables. Given that value, according to Rumsey and Spalart (2009) it can be affirmed that as values above .7 for R2 are considered high, the independent variables explain a lot of BI, allowing to infer that approximately 71.50% of the variability found in the behavioral intention of professors in relation to the acceptance and use of ICT is explained by the variables PU, PEU, SN, RC, and FC. Thus, the high value found for R2 points to a well-structured model (Rumsey & Spalart, 2009).
The statistical significance of the relationships was evaluated by analyzing effect size, t-value, and p-value, based on the bootstrapping technique, generating n = 2,000 different subsamples, each one with n = 147 observations, as recommended by Hair et al. (2005).
According to the results of the evaluation of the measurement model, the ANX construct was excluded because it did not present the minimum scores for AVE, composite reliability, and Cronbach’s alpha, which would prejudice the reliability of the model if maintained (Hair et al., 2014). In view of this fact, it is emphasized that the proposed relationships for this factor were also eliminated, thus excluding H7 and H8. The relationship analysis is demonstrated in Table 3.
Hypothesis Test Results.

Source. Research data.
Note. SN = Subjective Norms; PU = Perceived Usefulness; BI = behavioral intention; PEU = Perceived Ease of Use.
Did not meet AVE and Cronbach’s requirement.
According to Table 3, three latent variables did not present significant student t-values above 1.96 for path coefficients, indicating the nonsignificance of the hypotheses, and the other variables presented significance.
Results of the Multigroup Analysis
The data previously analyzed are results of a global model, in which no criteria were used to distinguish them in adherence to some category, considering that the shared variance extends throughout the entire sample. Multigroup analysis is a technique that allows testing if there are statistically significant differences between different data groups for the same model (Hair et al., 2014).
The four variables that could be acting as moderators of the established relationships were pointed out, namely, gender (Gefen & Straub, 1997; Venkatesh & Morris, 2000), age (Agarwal & Prasad, 1999; Burton-Jones & Hubona, 2006; Czaja et al., 2006; Morris et al., 2005), schooling level (Agarwal & Prasad, 1999; Czaja et al., 2006; D. L. Davis & Davis, 1990), and years of work at HEI.
Each of the variables is divided into two groups for a better standardization of the samples. Table 4 shows the groups formed, the way they were divided, their respective samples, and the frequency of each of them in relation to the total sample.
Moderating Variables Considered.

Source. Search data.
Note. HEI = Higher Education Institution.
Based on Table 4, all groups meet the requirements for a satisfactory sample size, as all were left with more than 20 observations (Bido et al., 2009; Hair et al., 2014). Groups were created in SmartPls v. 3.2.6 software as described in the previous table, and the new models were tested to verify the existence of statistically significant differences between them, regarding their influence in relation to the behavioral intention in the acceptance and the use of technological resources.
In front of this aspect, once the validation of all the models for each group of each moderator variable has been verified, the results of the tests performed are presented below. It should be noted that H7 and H8 were removed from all the models because they belong to the anxiety construct, besides not meeting the requirements of the internal consistency, as the coefficients were below those recommended for validation.
Analysis of the moderator variable gender
The first variable to be tested in the multigroup analysis was the gender of the respondents, being divided into male and female groups. Gefen and Straub (1997) argue that gender must be included by researchers in models that aim at the diffusion of IT along with other factors that may have an effect on behavioral intention in relation to the use of these technologies. For the authors, diversity in the workplace needs to be defended, and there is a need for knowledge about the distinct ways men and women respond during a process of deploying new technologies, while for Venkatesh and Morris (2000), men and women process information using different socially constructed cognitive structures, which help to determine and direct the perception of the individual.
The techniques used in this analysis aim to evaluate the existence of a statistically significant effect of the moderator variable gender from different subsamples, through bootstrapping. Table 5 presents the results of the multigroup analysis for the moderator variable gender.
Multigroup Analysis of the Moderator Variable Gender.

Source. Research data.
Note. SN = Subjective Norms; PU = Perceived Usefulness; BI = behavioral intention; PEU = Perceived Ease of Use.
According to Hair et al. (2014), heterogeneity exists when the reporting groups present significant differences (p <.05) in their model relationships. As observed in Table 5, both groups have homogeneity in all structural relationships, once the table of the multigroup analysis does not present any statistically significant p-value at the <.05 level. Thus, it can be affirmed that the variable gender does not moderate the relationships between the factors in the model proposed for this study, indicating that men and women do not have differences regarding their behavioral intention for the use of ICT.
Analysis of the moderator variable age
Similar to gender, age is also one of the groups most likely to exert an influence on individual perceptions, making it important to study the role that it plays regarding the use of technologies in the workplace (Araujo et al., 2016; Morris et al., 2005). Burton-Jones and Hubona (2006) justify the relevance of this variable in behavioral studies, claiming that over time individuals’ habits tend to become stronger and it is difficult for them to change their routines, which they are already familiarized with, suggesting that age negatively affects the use of ICT.
In front of the previous reports, Table 6 shows the results of the multigroup analysis of the structural relations, aiming to know whether the results are statistically significant in the evaluation among the groups.
Multigroup Analysis of the Moderator Variable Age.

Source. Research data.
Note. SN = Subjective Norms; PU = Perceived Usefulness; BI = behavioral intention; PEU = Perceived Ease of Use.
The p-value results reported in Table 6 indicate that none of the relations has a statistically significant effect to conclude that there is heterogeneity in the subsample data of both groups (Hair et al., 2014). Therefore, it cannot be affirmed that the variable age has some moderating effect on the relations between the independent variables on the behavioral intention of the professors interviewed.
Analysis of the moderator variable schooling
The user education level was considered relevant to the successful implementation of information systems in the 1980s, and the more literate individuals had better performance in the use of these resources (D. L. Davis & Davis, 1990). In this way, Agarwal and Prasad (1999) point to the education level as indicative of a potential of the ability of users to learn, once the more sophisticated cognitive structures, that are supposed to have been acquired through higher education, lead to a greater capacity to learn from new situations.
In Czaja et al. (2006), education is pointed out, along with other factors, as an influencer of the intention of the use of ICT by individuals, as explained by Burton-Jones and Hubona (2006), due to the fact that a higher education level empowers the user, reducing the effect of other factors about its intention regarding the use of technological resources.
Table 7 presents the results of the multigroup analysis for the determined educational levels.
Multigroup Analysis of the Variable Moderator Schooling.

Source. Research data.
Note. SN = Subjective Norms; PU = Perceived Usefulness; BI = behavioral intention; PEU = Perceived Ease of Use.
According to the data presented in Table 7, it can be observed that the variable Schooling Level moderates the relationships established by three hypotheses, namely, H3, H9, and H10. In this way, it is understood that the moderating effect of this variable will change the relations between PEU and PU, FC and PEU, and PEU and BI as the education level of its users is lower or higher. The other relationships did not have statistically significant effect to affirm that there are differences between the groups (Hair et al., 2014).
Analysis of the moderator variable working time at HEI
The last variable proposed for the multigroup analysis is the experience of the professors within the HEI, that is, their working time in the institution under study. The aim of this analysis is to verify whether the working time at HEI influences the intention of the users in relation to the use of ICT.
Table 8 presents the results of the multigroup analysis to verify whether or not there are significant differences between the two groups proposed for the variable working time at HEI from 1 to 15 years and the second from 16 years or above.
Multigroup Analysis of the Moderator Variable Working Time.

Source. Research data.
Note. SN = Subjective Norms; PU = Perceived Usefulness; BI = behavioral intention; PEU = Perceived Ease of Use.
According to the data presented in Table 8, it is observed that no structural coefficient presented statistical significance to affirm that there are differences between the two groups proposed for this variable (Hair et al., 2014). Thus, it can be affirmed that the time at home of professors does not have a significant influence on the relationships proposed by the model.
Discussion
The results of this research show a positive influence of the PU by the professors on their behavioral intention to use ICT, increasing their interest in these resources. Thus, there are indications that professors are aware that implementing these innovations in their work environment tends to increase their productivity as well as providing subsidies to develop their activities with greater quality, efficiency, and effectiveness. Therefore, the first relationship of influence corroborated in our research is in line with the results of the study by Sánchez-Prieto et al. (2016).
The PEU is another factor considered determinant of the behavioral intention of the users regarding technologies. The results show that, for respondents, the ease of use of ICT is a decisive factor in the intention to use technological resources, as they understand it as easy to use. These results are in line with what was presented by F. D. Davis (1989), H. W. Kim et al. (2009), and Venkatesh et al. (2011) that individuals’ perception regarding the effort to be released can have an impact on the behavioral intention and can influence the actual behavior.
Also, the relationship between the PEU and the PU by ICT users—perceived as easy to use by respondents—is the expansion of professors’ horizons regarding the potential of a variety of ways of using in teaching activities. In the context of this research, the results suggest that professors believe that there will be no physical, mental, and learning difficulties. In this way, besides the acquired ability with the ICT, there is an increase in the perception regarding different means of its application in its daily routine. Finally, this set of events positively impacts its behavioral intention to use.
Considering these aspects, two influence relationships proposed for the construct PEU were corroborated and, therefore, are in line with the results of Sánchez-Prieto et al. (2016). The results concerning the two relations of the factor PEU suggest that there is a relationship with the current stage of standardization by technological industries of the operating systems used in the technologies. With the standardization of operating systems, a single unique experience facilitates the use of different instruments regardless of the software embedded in the applications used.
People around the user, especially co-workers, can help with the use of technology and discover new ways to explore these tools in daily activities. In an environment where superiors and/or co-workers suggest that ICTs are useful, the potential user is induced to believe that they are, and consequently increase the intention to use. The HEI managers should encourage a cooperative environment in which there is a mutual help, and in this way, all ICT users can optimize the potential of using the tools, besides improving their experiences. Given the above, the relationship between SN factor and PU was corroborated and is also in line with the results of Sánchez-Prieto et al. (2016) and Venkatesh and Davis (2000) on the internalization of this effect on behavioral intention when intermediated by PU.
The relationship between SN and BI did not present significant influence. Therefore, this study does not corroborate the relationship proposed by the extended model of Sánchez-Prieto et al. (2016) about the influence of the social or organizational pressure that is put on the individual to perform a specific behavior.
Two relationships of the extended model were eliminated because the anxiety factor was withdrawn from the model. The first one was the negative influence of the variable SE on anxiety, and the second was the negative influence of anxiety on PEU. Thus, these two relationships could not be tested.
Regarding the relations proposed to the FC factor, their influence on PEU and BI did not present statistical significance for this study. For both relationships, the results suggest that professors do not perceive the available resources to facilitate the use of technologies as determinants of the perception of ease and intention to use. The results did not adhere to the propositions of Sánchez-Prieto et al. (2016) for the construct FC, suggesting that professors do not perceive the resources at their disposal as facilitators of use of ICT and as determinants of their BI, not PEU.
RC characterizes the last two relationships proposed by the extended model used in the context of this study. For this factor, the results can be considered the most surprising of all, as instead of expected negative relationships, positive and significant relationships occurred. Therefore, the impacts resulting from the implementation of ICT did not result in negative effects on PU by users and on BI as expected.
These results, although contrary to expectations, are positive and increase behavioral intentions of users regarding ICT use. HEI managers should not worry about the risk of resistance of professors in the adoption and use of ICT resources. This reflection is supported by the results that this factor has no influence on users and aspects with the potential to negatively impact the context of these innovations and act in a contrary way, increasing the PU and BI to use ICT resources. These two relationships were not corroborated and, therefore, are not in line with the results of Sánchez-Prieto et al. (2016).
Based on the results found in the multigroup text analysis, it was found that few effects led a variable to have a significant influence over another, according to the relations established by the test model. Starting with the variable gender, the literature states that there are differences between men and women when it comes to the adoption of technological resources (Gefen & Straub, 1997; Venkatesh et al., 2000; Venkatesh & Morris, 2000), but this study found no such difference. According to the results shown, with a significance level of 5%, only H11 shows any difference in its results due to the gender of the groups. This difference, however, is very small, that is, nearly insignificant. According to this result, it can be said that, for men, RC does not have a significant influence over PU, whereas a difference was found for women. In the other associations, females presented higher scores than males. However, the difference was not statistically significant neither for the isolated groups nor for the multigroup analysis. In general, it can be inferred that, for this study, the variable gender does not moderate the relations between the factors in the model, indicating that men and women have no differences with respect to their behavioral intention in the use of ICTs.
The moderating effect of age over the intent to use ICTs, on the contrary, was a subject addressed by many authors (Agarwal & Prasad, 1999; Burton-Jones & Hubona, 2006; Czaja et al., 2006; Morris et al., 2005), which point out the differences provoked by the age of the individuals when it comes to the acceptance of ICTs. According to the results found, it was observed that, in this study, this effect was not found, as, at a significance level of 5%, by analyzing the groups separately, H1, H3, H6 and H11 were corroborated by both groups, whereas H4 was only corroborated by the group of people from 27 to 45 years of age and H10 only by the group from 46 to 65 years of age. However, the results of the multigroup analysis have made clear that none of these relations have a statistically significant effect, meaning it cannot be concluded that the data from the subsamples of the groups are heterogeneous. Therefore, the results of this research, for this group, are different than those found by earlier research works.
According to the literature on the acceptance of ICTs (Agarwal & Prasad, 1999; Burton-Jones & Hubona, 2006; Czaja et al., 2006; D. L. Davis & Davis, 1990), the educational level is another factor that can impact the behavior of an individual with regard to the acceptance of technological resources. The results of this research point out differences between the groups for the relations from H3, H9, and H10. These relations indicate that the educational level can mediate the acceptance of ICT by the users, as it is easier for professors with master’s degrees and PhDs to realize how easy it is to take advantage of these resources, not to mention their condition in life makes it easier to use the ICTs. For all other relations, the results were not significant, indicating that there were no differences between the groups.
The last group to be investigated was formed according to the time each professor had been working in the institution. Considering an isolated analysis between the groups, it can be found that H1, H3, H4 and H12 had statistical significance only for the group with the least time in the HEI, indicating that PU, PEU, SN, and RC may, in a way, influence the professors with regard to the ICTs. However, in the multigroup analysis, the structural coefficient did not have statistical significance, meaning it cannot be said that there are differences between the two groups involved in this variable and allowing to infer that the time professors have in the institution does not have a significant influence over the relations the model proposes.
Conclusion
This study investigated the factors that influenced the behavioral intention of professors in the acceptance and use of ICTs at work. The research is guided by the TAM (F. D. Davis, 1989) and the work of Sánchez-Prieto et al. (2016). In the context of this research, the effects of independent variables, especially BI, suggest actions of managers in the search for the correct use of ICT, to obtain the maximum benefit of their potential in creating value for the entity. Diagnosing intention of users to use technologies, the effects of some factors on others that tend to decrease behavioral intention can be minimized or even decimated, while the effects that tend to increase it may be reinforced, aiming at maximization.
The results are in line with the literature regarding the proposed relationships to the original TAM model variables on the positive and significant effects of PU and PEU on BI as well as the relationship of PEU about PU. It should be emphasized that in the original model, the attitude toward the use is a mediator of the relations between the PEU and PU variables with BI. Sánchez-Prieto et al. (2016) withdrew this variable because they felt that the effect of the two independent variables on the dependent variable could be direct, without suffering mediations. The results of our study corroborate this relationship.
Overall, the results suggest that professors are able to use technologies available to support their activities. The only negative relationships that could impact behavioral intention were the constructs anxiety (eliminated from the model) and RC—surprisingly presented positive results for relationships that were expected to be negative—which would decrease the behavioral intention of users.
From the social point of view, the results of the multigroup analysis for gender, age and educational level contribute to drawing a profile of the users regarding the intention to use ICT, as the data do not have a direct connection with the HEI. The results also provide an empirical basis that enables an early diagnosis to support corrective actions to increase behavioral intention in similar situations.
This study presents some limitations, the first of which is the use of the BI construct as a dependent variable. Although this construct presented high variance, it is important to highlight that the behavioral intention is not equivalent to the actual use of technology by the respondents. An indication of this is the study by Lemay et al. (2018), whose results showed that although the two variables were significantly related, the variance in actual use was too low, suggesting that, in certain situations, the behavioral intentions do not always lead to actual use. Another limitation of this study is that the size of the sample is too small for generalizations, meaning that the results found are only valid for this specific research. However, they can offer insights for future studies in behavioral intention while using ICTs.
Footnotes
Acknowledgements
We thank the Editor Dr. Omer Faruk Ursavas. We also thank the anonymous reviewers of SAGE Open for their significant contribution to the final version of this article.
Declaration of Conflicting Interests
The author(s) declared no potential conflicts of interest with respect to the research, authorship, and/or publication of this article.
Funding
The author(s) received no financial support for the research, authorship, and/or publication of this article.