
Abstract
This study explores the hypothesis that sentiment indicators can enhance the performance of algorithmic trading strategies. Specifically, we investigate the impact of incorporating investor sentiment metrics, such as the CNN Fear & Greed Index and cryptocurrency sentiment, on predictive accuracy and profitability. To test this hypothesis, two trading strategies are compared in the Nasdaq Mini futures market. The first strategy employs traditional technical indicators and machine learning models, whereas sentiment-based indicators are incorporated to the second one to enhance it. Backtests are conducted over the period from May 16, 2022 to December 20, 2024, to evaluate the effectiveness of sentiment signals. The results demonstrate that the sentiment-augmented strategy improves risk-adjusted returns, reduces volatility, and enhances profitability compared to the baseline model. This study provides evidence that sentiment indicators can be a valuable addition to algorithmic trading systems, offering a more stable and risk-managed approach, even though they may not always maximise net profit.
Plain Language Summary
This study looks at whether market sentiment can improve algorithmic trading strategies. Specifically, we examine how using investor sentiment indicators, like the CNN Fear & Greed Index and cryptocurrency sentiment, affects trading accuracy and profitability. To test this idea, we compare two trading strategies in the Nasdaq Mini futures market. One that relies only on technical indicators and machine learning models. Another that also includes sentiment indicators to refine decisions. We run historical tests (from May 16, 2022 to December 20, 2024) to see which strategy performs better. The results show that the sentiment-based strategy leads to better risk-adjusted returns, lower volatility and improved profitability compared to the standard model. While it may not always maximise profits, using sentiment indicators helps create a more stable and risk-managed trading approach, making it a valuable addition to algorithmic trading.
Keywords
Introduction
In recent years, the role of investor sentiment in financial markets has gained growing attention in both academic and professional contexts. Behavioural finance has demonstrated that emotional factors, such as fear, greed, and overconfidence, can lead to price distortions, deviations from fundamental value, and periods of excessive volatility (Forbes, 2009; Paule-Vianez et al., 2020). These psychological effects often manifest in collective investor behaviour and can be measured through sentiment indicators, such as social media activity, market surveys, or composite indices. However, while sentiment is known to influence market dynamics, its integration into algorithmic trading systems remains limited and underexplored in empirical research.
Traditionally, algorithmic trading models have relied on technical indicators and historical price patterns to generate buy and sell signals (Kissell, 2020; Nuti et al., 2011). These systems, often enhanced by machine learning algorithms, are designed to detect statistical regularities rather than behavioural patterns. As a result, they may underperform during regime changes or emotionally driven market conditions, where rational expectations break down and sentiment becomes a dominant force (Gómez-Martínez et al., 2019; Shanmuganathan, 2020). This limitation suggests a need to explore whether integrating sentiment data can improve the adaptability and risk management of algorithmic trading strategies.
Despite the theoretical appeal of sentiment analysis, few studies have tested its practical impact on predictive accuracy and profitability within algorithmic frameworks. Those that do often focus on individual sentiment sources or treat sentiment as an external explanatory variable, rather than a core component of the decision-making process. Moreover, there is limited evidence on how sentiment indicators perform under varying market conditions, and whether they can enhance strategies already based on advanced machine learning techniques.
This study aims to address these gaps by empirically testing whether the inclusion of investor sentiment indicators, specifically the CNN Fear & Greed Index and cryptocurrency sentiment, can improve the performance of algorithmic trading systems applied to the Nasdaq Mini futures market. We compare two strategies: a baseline model using only technical indicators and machine learning, and an enhanced model that incorporates sentiment signals as filters to refine trade decisions. Both models are evaluated through a rigorous backtesting process using professional-grade simulation tools.
Our contribution lies in demonstrating that sentiment-based filters can enhance risk-adjusted returns, reduce volatility, and improve capital efficiency, even in the context of complex machine learning models. By integrating behavioural finance insights with quantitative trading techniques, this paper proposes a hybrid approach that strengthens the robustness and realism of algorithmic systems. This work thus offers both theoretical and practical implications for researchers and practitioners interested in the evolving role of sentiment in algorithmic decision-making.
Theoretical Framework
Algorithmic Trading
The use of computer algorithms to automatically execute trading strategies in financial markets is referred to as algorithmic trading. Thus, the main objective of algorithmic trading is to generate profit by making trades based on pre-defined criteria without any need for human intervention (Nuti et al., 2011). These algorithms can process vast amounts of market data, identify trading opportunities, and execute orders much faster and more efficiently than a human trader could.
Generally, algorithmic trading analyses market data (such as price, volume, and other technical indicators) to make decisions. Algorithms can identify patterns or trends that may indicate an optimal time to buy or sell a security. Following these patterns, traders or developers write specific rules for the algorithm to follow. These rules are often based on technical indicators, statistical models (Kissell, 2020). Once the algorithm identifies a suitable opportunity according tothe predetermined rules, it automatically places buy or sell orders. This process eliminates the delay involved with manual trading and helps optimise timing and pricing (Gomber & Zimmermann, 2018).
Algorithmic trading allows for quick decision-making and order execution. Algorithms can process market data in milliseconds, enabling traders to capitalise on small price changes that would be missed by human traders (Chaboud et al., 2014). Many algorithmic trading strategies are designed to take advantage of high-frequency trading (HFT), where large volumes of trades are made in very short periods of time (Aldridge, 2013), which is especially common in markets such as equities or futures (Gregoriou, 2015).
Furthermore, by means of automating trades, algorithmic trading minimises the impact of human errors, reduces the need for manual intervention, and helps to lower transaction costs (such as broker fees, slippage, and market impact; Chaboud et al., 2014).
One of the key benefits of algorithmic trading is its ability to backtest strategies through the use of historical data (Mahdavi-Damghani & Roberts, 2023). This allows traders to see how their strategies would have performed in the past and optimise them before applying them in live markets. Strategies can be rigorously tested using historical data, allowing traders to optimise their models before deploying them in live markets.
There are different types of algorithmic trading strategies (Chan, 2013). Trend-following algorithms identify market trends (up or down) using indicators like moving averages, momentum, and trendlines. (Kissell, 2020). Mean-reversion strategies assume prices return to their historical average, involving buying undervalued or selling overvalued assets (Chakraborty & Kearns, 2011). Arbitrage strategies involve exploiting price discrepancies between different markets or assets (Gomber & Zimmermann, 2018). For example, an algorithm might identify differences in the price of a security across multiple exchanges and execute trades to make profit from these disparities.
Nevertheless, there are some challenges that algorithmic trading must face (Shen, 2021). High-frequency algorithms, if not properly managed, can cause significant market impact, leading to slippage and higher transaction costs. Overfitting occurs when a trading algorithm is overly tailored to historical data, leading to strong backtest performance but poor live market results.
The rapid growth of algorithmic trading has raised concerns about market manipulation, flash crashes, and other systemic risks (Arnoldi, 2016). As a result, regulatory authorities have implemented various rules and regulations to ensure the stability and fairness of markets (Lenglet, 2011). Algorithmic trading uses technology for fast, data-driven strategies, offering speed and accuracy but posing challenges like market impact, overfitting, and technical risks. As the field evolves, there is increasing interest in incorporating additional factors, such as sentiment analysis, to enhance the performance of algorithmic trading systems.
The main performance indicators for an algorithmic trading strategy are crucial metrics used to evaluate the effectiveness, profitability, and risk of the strategy. The key performance indicators (KPIs) commonly used (Cooper et al., 2015) are: Net Profit, Gross Profit, Profit Factor (gross profit to gross loss ratio), Sharpe Ratio, Return on Investment (ROI), Annualised ROI, Volatility, Exposure (sessions in market), Net Profit to maximum Drawdown ratio, and Mathematical expectation (average expected return per trade, taking into account the probability of winning and losing trades). These KPIs, when used together, provide a comprehensive picture of the trading strategy’s effectiveness and help traders and investors assess both the profitability and the risks associated with the strategy.
Artificial Intelligence
Artificial Intelligence (AI) refers to the simulation of human intelligence processes by machines, especially computer systems (Winston, 1984). These processes include learning, reasoning, problem-solving, perception, and language understanding. AI aims to create machines or systems that can perform tasks typically requiring human intelligence, such as recognising patterns, making decisions, or understanding natural language (Minh et al., 2022). AI refers to creating systems that can replicate human cognitive abilities, making them capable of performing tasks autonomously or with minimal human intervention.
Artificial intelligence is capturing public attention due to two spectacular applications: First, Natural Language Processing (NLP) focuses on enabling machines to understand, interpret, and generate human language, whether spoken or written (Gómez-Martínez et al., 2019). Second, Computer Vision allows machines to interpret and understand visual information from the world, such as identifying objects or recognising faces in images (Karn et al., 2024).
Machine Learning (ML) is a subset of AI where algorithms are used to identify patterns in data and improve their performance over time without being explicitly programmed (Spair, 2023). ML involves using data to train a model, which can then be used for predictions or classifications. A specialised area of machine learning using neural networks with many layers to process data is called “Deep learning,” which is particularly useful in complex tasks such as image recognition, natural language processing, and autonomous driving (Kissell, 2020).
The following machine learning algorithms are widely used in business strategies (Rane et al., 2024). First, Decision Tree, which is a supervised learning algorithm that splits the data into subsets based on the value of input features. It creates a tree-like structure where each internal node represents a feature, each branch represents a decision rule, and each leaf node represents a prediction outcome. The tree is built by recursively partitioning the data using the feature that provides the best split according to a specific criterion, like Gini impurity or information gain. Decision trees are easy to understand and interpret because the decision-making process is explicitly displayed as a series of binary decisions (Kissell, 2020). They can model non-linear relationships between the features and the target variable, and they do not require normalisation or standardisation of the input data. This algorithm is prone to overfitting, especially when the tree is very deep, and is very sensitive to small changes in data (high variance).
Second, Random Forest is an ensemble method that builds multiple decision trees (often hundreds or thousands) using bootstrapped samples of the data (Spair, 2023). Each tree is trained with a random subset of features, and the final prediction is made by aggregating the predictions from all individual trees (for regression tasks, it is the average; for classification, it is the majority vote). Random Forest generally produces highly accurate results. By averaging predictions from many trees, Random Forest reduces the risk of overfitting compared to individual decision trees. It provides insight into the importance of different features in making predictions. As drawbacks, it can be computationally expensive, in particular with large datasets and many trees, and is less interpretable than a single decision tree because of the complexity of the ensemble (Sahu et al., 2023).
Third, Naive Bayes is a probabilistic classifier based on Bayes’ Theorem, assuming that the features are conditionally independent given the class label. Despite this strong (and often unrealistic) assumption of independence, it works well in many practical situations, especially when the dataset has many features (Kissell, 2020). Naive Bayes is computationally efficient and works well with large datasets, and it is particularly effective for categorical features but can also be adapted for continuous data (Sahu et al., 2023). Nevertheless, the assumption of feature independence is often unrealistic, leading to suboptimal performance in some cases. Furthermore, it may perform poorly when features are highly correlated.
Fourth, Gradient Boosted Trees (GBT) is an ensemble technique where trees are built sequentially, with each new tree focussing on the errors made by the previous trees (Sahu et al., 2023). The model is “boosted” by adjusting the weights of the data points that were misclassified by previous trees. Gradient Boosted Trees include algorithms like XGBoost, LightGBM, and CatBoost, which have been optimised for speed and performance. Gradient Boosting often produces highly accurate models by iteratively improving on previous errors. It can deal with both categorical and numerical features (Acharya et al., 2021). Like Random Forest, GBT can provide insights into which features are most important. A potential drawback of GBT, despite its power, is the risk of overfitting, particularly when too many trees are added or the learning rate is too high. Training GBT models can be slow and resource-intensive, especially on large datasets.
Fifth, Logistic Regression is a statistical method used for binary classification tasks. It models the probability that a given input point belongs to a certain class using the logistic (sigmoid) function, which outputs values between 0 and 1. The model is trained by finding the best-fitting coefficients for the input features using techniques like gradient descent (Kissell, 2020). Logistic Regression is easy to implement and interpret, making it a popular baseline model for classification tasks. It works well for binary classification problems and is particularly effective when the relationship between the features and the target is linear. Logistic Regression is faster to train and requires less computational power compared to more complex models like Random Forest or Gradient Boosted Trees, but Logistic Regression assumes a linear relationship between the input features and the log-odds of the target, which may not hold for more complex data (Hua et al., 2007).
Artificial Intelligence (AI) in Algorithmic Trading
Artificial Intelligence (AI) plays a significant and growing role in algorithmic trading by enhancing the decision-making process and improving the performance of trading strategies (Cohen, 2022).
AI techniques, particularly machine learning (ML) and deep learning, are used to predict market trends and forecast asset prices. These predictions are based on historical market data, economic indicators, social sentiment, and other factors (Jansen, 2020). The algorithms are trained on large datasets to recognise patterns and relationships that might not be immediately visible to human traders. Therefore, AI replaces trading rules with patterns identified by machine learning algorithms (Gómez-Martínez et al., 2019). AI models can analyse historical price movements, trends, and other time-related factors to predict future market behaviour.
Machine learning models like Decision Trees or Random Forests are trained on historical data to make decisions about market trend, entry, exit, or risk management based on labelled data. On the other hand, clustering algorithms, such as k-means or hierarchical clustering, are used to detect market regimes or group similar assets for diversified portfolios or risk management purposes (Kissell, 2020).
AI improves predictive analytics by identifying relevant features that affect asset prices and market behaviour. For example, AI can integrate traditional technical analysis tools (like moving averages, RSI, MACD) with machine learning models to enhance predictive accuracy (Gómez-Martínez et al., 2022). Likewise, AI can process alternative data sources, such as satellite images, weather data, or social media sentiment, to predict market movements that might not be captured by traditional financial metrics (Spair, 2023).
Artificial Intelligence in algorithmic trading allows for more efficient, faster, and accurate trading decisions by automating complex processes, improving risk management, and analysing large datasets to predict market movements. By integrating machine learning models, sentiment analysis, and predictive analytics (Paule-Vianez et al., 2023), AI enhances the ability of algorithmic trading systems to adapt to dynamic market conditions and make real-time, data-driven decisions. As a result, AI has become an essential tool in modern finance, especially in high-frequency trading and quantitative analysis (Gómez-Martínez et al., 2019).
Behavioural Finance
Behavioural finance is a field of study that combines insights from psychology and economics to understand how individuals make financial decisions, and how these decisions often deviate from traditional economic theories, which assume rational decision-making (Forbes, 2009). In traditional finance, it is assumed that all market participants are rational, always making decisions that maximise their utility based on available information (Praharaj, 2022). However, behavioural finance recognises that, people often act irrationally due to cognitive biases, emotions, and social influences (Paule-Vianez et al., 2020).
Behavioural finance identifies various cognitive biases that influence financial decision-making (Mittal, 2022), such as overconfidence bias, when investors may overestimate their knowledge and ability to predict market outcomes (Forbes, 2009) or loss aversion, when people tend to fear losses more than they value equivalent gains, which can lead to suboptimal investment decisions (Mittal, 2022). Anchoring bias means that investors may rely too heavily on the initial piece of information they receive (the “anchor”) when making decisions, even if it is irrelevant (Paule-Vianez et al., 2020); and herd behaviour occurs when people often follow the crowd, making decisions based on someone else’s actions rather than on their own analysis or strategy (Forbes, 2009).
Traditional finance theory, particularly the Efficient Market Hypothesis (EMH), assumes that all available information is instantly reflected in asset prices (Fama, 1970). However, behavioural finance suggests that markets are often inefficient because investors do not always act rationally (Forbes, 2009). As a result, mispricing of assets and market anomalies can occur.
Behavioural finance emphasises the role of emotions in shaping financial decisions. For example, fear, greed, and panic can lead to irrational behaviours such as panic selling during market downturns or excessive risk-taking in bull markets (Gómez-Martínez et al., 2023). Investors might overreact to recent news or market movements, driving prices too high or too low in the short term, or underreact to long-term trends, leading to mispricing. Therefore, sentiment indicators could be a powerful tool to anticipate market trends (Paule-Vianez et al., 2020).
Behavioural finance challenges traditional economic models by highlighting the emotional and psychological factors that influence financial decision-making. Since it provides a more realistic view of human behaviour in financial markets, it helps to explain market anomalies, investor behaviour, and the inefficiencies in financial systems that arise from irrational decision-making. By understanding these concepts, investors, financial professionals, and policymakers can make better decisions and improve financial outcomes (Mittal, 2022).
The incorporation of insights from behavioural finance into algorithmic trading powered by AI can significantly enhance performance (Shanmuganathan, 2020). Whereas traditional algorithmic trading often relies on predefined rules and historical data, behavioural finance emphasises the psychological biases and emotional factors that affect market participants. By integrating sentiment analysis and market psychology, AI models can better anticipate market trends influenced by irrational behaviour, such as herd mentality or loss aversion. This allows for improved risk management, more accurate predictions, and the ability to adapt to market anomalies. Understanding behavioural patterns allows AI systems to make more informed, data-driven decisions, optimising trading strategies and maximising profitability in dynamic markets (Paule-Vianez et al., 2020).
Research Gap and Contribution
This study addresses a gap in the literature by combining sentiment analysis with machine learning-based algorithmic trading strategies. Unlike previous research that treats these approaches separately, we test whether sentiment indicators, such as the CNN Fear & Greed Index and cryptocurrency sentiment, can improve predictive accuracy and risk-adjusted returns. In doing so, we offer a novel contribution that bridges behavioural finance and artificial intelligence in trading system design.
This study contributes to the existing literature by empirically examining the role of investor sentiment indicators, specifically the CNN Fear & Greed Index and cryptocurrency sentiment, as filters in machine learning-based algorithmic trading strategies. While prior research has separately explored behavioural finance concepts or applied machine learning to technical indicators, few studies have systematically combined both approaches within a backtested trading framework. Our work addresses this gap by quantifying how sentiment signals influence predictive accuracy, risk-adjusted returns, and capital efficiency in algorithmic trading. By doing so, the study offers a novel perspective on how emotionally driven market behaviour can be integrated into systematic models, advancing the field towards more psychologically aware algorithmic systems.
Hypothesis and Methodology
This study is based on the hypothesis that sentiment indicators can improve the performance of an algorithmic trading strategy. Specifically, we propose that the incorporation of investor sentiment metrics, such as the CNN Fear & Greed Index (Gómez-Martínez et al., 2023) and cryptocurrency sentiment, as leading indicators (Gómez-Martínez et al., 2024) can improve the predictive accuracy and overall profitability of algorithmic trading systems. By leveraging these sentiment-based signals, we aim to demonstrate that trading strategies can better adapt to market conditions driven by investor emotions.
Therefore, the hypothesis could be stated as follows:
The study methodology involves comparing the performance of two backtests conducted on trading strategies applied to the Nasdaq Mini futures market. These backtests span a prospective period from May 16, 2022 to December 20, 2024.
The first strategy (Strategy 1) employs weekly long or short positions based on signals generated by five machine learning models: Decision Trees, Random Forest, Naive Bayes, Gradient Boosted Trees (GBT), and Logistic Regression. A position is only taken if at least four out of the five models provide signals in the same direction; otherwise, no position is opened. The training dataset starts in June 2015 and consists of weekly observations. The machine learning models use the following technical indicators: 50-, 20-, and 10-day moving averages, RSI, MACD, and Bollinger Bands. The target variable is a binary classification of the Nasdaq’s trend for the following week, indicating “up” or “down.”
The second strategy (Strategy 2) builds upon the baseline model, integrating two sentiment-based indicators to refine trading signals. The first one is CNN Fear & Greed Index. If the index indicates “Extreme Fear,” it generates a long signal. If it indicates “Extreme Greed,” it generates a short signal. In other cases, the signal is neutral. Additionally, Cryptocurrency is used as a Leading Indicator: If Bitcoin’s price increased by more than 5% during the previous week, it generates a bullish signal. If Bitcoin’s price decreased by more than 5%, it generates a bearish signal. Otherwise, the signal is neutral. A position is taken in the second strategy only when at least two of the sentiment-based indicators align in the same direction.
In Strategy 2, sentiment analysis was incorporated as a filtering mechanism layered on top of the technical signal generation process used in Strategy 1. After the five machine learning models produced their directional signals (long/short/neutral), the sentiment indicators were applied as a conditional filter: a trade was only executed if at least two sentiment indicators aligned in the same direction as the majority technical signal. The sentiment indicators used were (1) the CNN Fear & Greed Index, which generated a long signal under “Extreme Fear” and a short signal under “Extreme Greed,” and (2) cryptocurrency sentiment, inferred from Bitcoin’s price movement over the previous week. Both indicators were updated weekly and synchronised with the same timeframe as the market features to avoid forward-looking bias. This design ensures that sentiment data influences the decision-making process in a non-predictive, rule-based way, enhancing the selectivity of trades and aiming to filter out high-risk or sentiment-driven noise in the market.
Before training the models, several data preprocessing steps were applied to ensure data quality and model robustness. All financial indicators were calculated on a weekly basis and aligned to a consistent timestamp corresponding to the close of each trading week. There were not missing values because a weekly basis were used to remove the effect of market holydays, and sentiment indicators were synchronised with the same weekly intervals, ensuring that no forward-looking bias was introduced.
Concerning the backtesting framework, both strategies are tested under identical conditions to ensure comparability, using the same training and testing datasets, as well as consistent evaluation metrics. Performance metrics include predictive accuracy, risk-adjusted returns, and overall profitability. This design aims to isolate the added value of sentiment indicators in enhancing trading performance.
The hypothesis (H1) will be validated if the performance of the trading strategy improves when incorporating sentiment indicators as filters. The evaluation will be based on the following key metrics:
If the sentiment-augmented strategy outperforms the baseline strategy across these criteria, the hypothesis will be considered validated.
Results
Trading Motion is a company that specialises in automated trading systems and strategies. They offer a marketplace where traders can explore and acquire various trading algorithms designed for different financial instruments. Their platform provides access to a range of automated trading systems, including those for futures and forex markets. Additionally, Trading Motion collaborates with multiple brokers to facilitate the execution of these trading strategies.
Trading Motion SDK (Software Development Kit) is a development toolset offered by Trading Motion. The SDK provides developers with the necessary tools, libraries, and documentation to create, test, and implement algorithmic trading strategies within Trading Motion’s platform.
The Trading Motion SDK is typically designed to enable the integration of custom trading algorithms with the Trading Motion ecosystem. It allows users to write their own trading strategies and backtest them on historical data. The SDK facilitates the connection of custom algorithms to various brokers for live trading execution. In essence, the Trading Motion SDK provides the technical infrastructure necessary for developing and deploying algorithmic trading strategies on the Trading Motion platform.
The access to market data and all calculations regarding the performance of the backtests were performed using the Trading Motions SDK. Table 1 sums up the key performance indicators of the backtest for the two analysed strategies.
Trading Strategies Performance.

Source. Authors own research using Trading Motions SDK.
The results compare two trading strategies applied to E-mini Nasdaq using 30-min bars over the period from May 16, 2022 to December 20, 2024: one using only AI-based signals (Strategy 1) and the other incorporating sentiment indicators (Strategy 2). The comparison highlights key performance metrics, risk measures, and trading session outcomes.
• • • • •
• • •
• • •
•
•
Figures 1 and 2 show the profit and looses chart of each strategy.
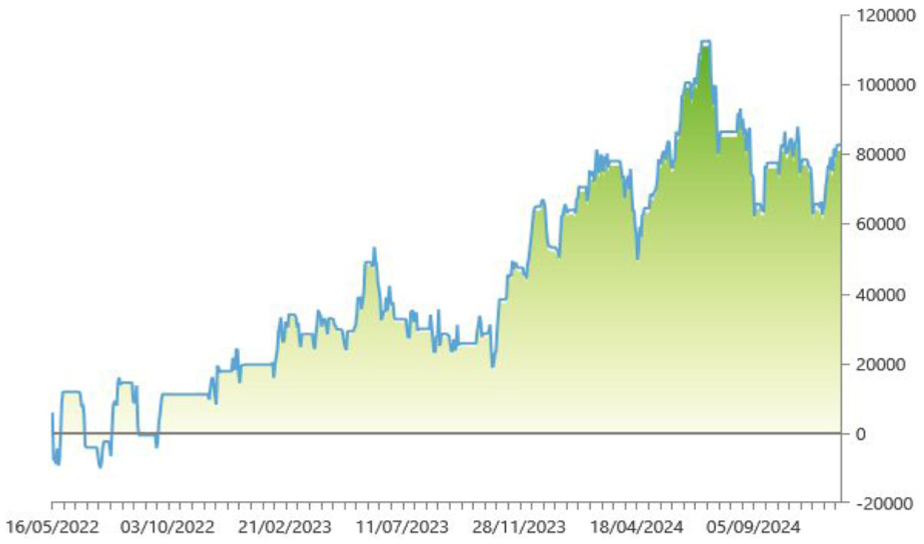
Strategy 1 P&L chart.
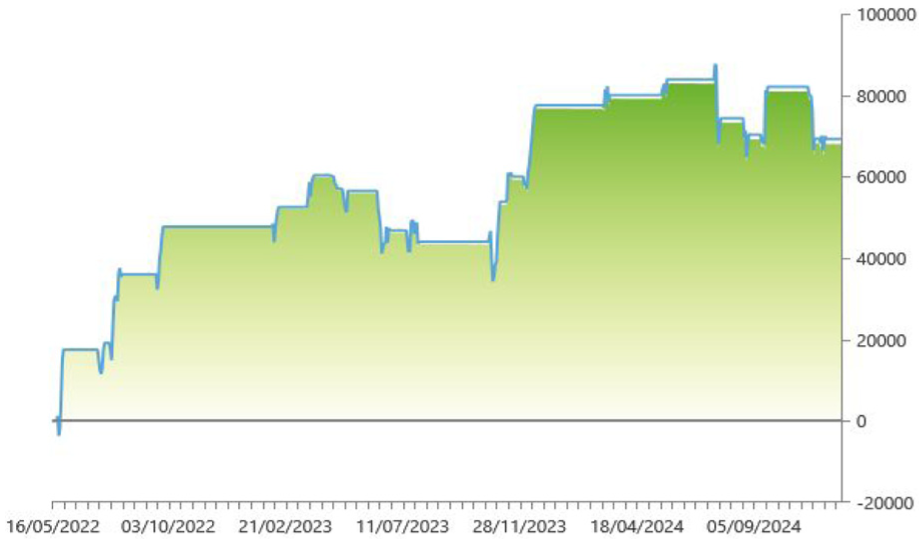
Strategy 2 P&L chart.
The sentiment-augmented strategy demonstrates superior risk-adjusted performance, stability, and capital efficiency compared to the AI-only approach. While its net profit is slightly lower, the reduction in volatility and drawdowns, along with improvements in metrics like the profit factor, Sharpe ratio, and annual ROI, suggest that incorporating sentiment indicators provides a more robust and sustainable trading framework.
These results support the study’s hypothesis (H1) that incorporating sentiment indicators improves the performance of algorithmic trading strategies, particularly in terms of risk-adjusted returns and overall efficiency. Strategy 2, which integrates the CNN Fear & Greed Index and cryptocurrency sentiment, achieved a Sharpe ratio of 1.13, a substantial improvement over the 0.79 recorded for the baseline model (Strategy 1). This represents a 43% increase in the Sharpe ratio, indicating significantly better compensation for risk. To put this into context, according to Morningstar, one of the top-performing alternative managed futures funds, AQR UCITS Funds—AQR Managed Futures UCITS Fund G USD, reported a 3-year Sharpe ratio of only 0.22. The result from Strategy 2 therefore exceeds the industry benchmark by a considerable margin, demonstrating that the inclusion of sentiment indicators not only improves the strategy’s robustness but also elevates its efficiency to a level comparable with or superior to leading institutional investment products.
Discussion
This study aimed to explore the hypothesis that sentiment indicators, such as the CNN Fear & Greed Index and cryptocurrency sentiment, can improve the performance of algorithmic trading strategies. The analysis of two trading strategies—one using machine learning models and the other augmented with sentiment indicators—reveals important insights into the impact of sentiment on algorithmic trading.
The results show that, while the strategy augmented with sentiment indicators (Strategy 2) resulted in a lower net profit compared to the baseline strategy (Strategy 1), it outperformed in several key performance metrics. These include the profit factor, Sharpe ratio, net P&L over drawdown, annual ROI, and volatility, all of which point to a more stable and risk-adjusted return profile for the sentiment-based approach. The sentiment-augmented model’s reduced volatility, smaller drawdowns, and superior net profit over drawdown ratio highlight its effectiveness in managing risk, suggesting that sentiment-based signals can improve the overall stability of trading strategies, even if they generate slightly lower gross profits.
Furthermore, the sentiment-based strategy, with fewer market sessions, indicates that less frequent but more selective trading can yield better outcomes in terms of risk-adjusted returns. The incorporation of the CNN Fear & Greed Index and cryptocurrency sentiment likely provided valuable opposite signals that helped the strategy avoid market extremes, which are often associated with higher risks and volatility.
Despite these promising results, Strategy 2 did not entirely outperform Strategy 1 in terms of net profit. This suggests that while sentiment indicators contribute to a more stable and profitable trading system, they do not necessarily enhance profits in every market condition. The application of sentiment analysis in trading should, therefore, be seen as a complementary tool to traditional technical analysis, rather than a standalone solution.
The findings suggest that incorporating sentiment indicators into algorithmic trading strategies can enhance risk-adjusted returns, stability, and capital efficiency, making them a valuable complement to technical and machine-learning-based approaches. Practitioners should consider integrating sentiment data to refine their strategies, particularly in volatile markets, while being mindful of the reduced net profit in some cases.
On the other hand, policymakers should be conscience about this paper’s implications. The study highlights the increasing role of sentiment data in trading, emphasising the need for regulations to ensure the transparency and reliability of sentiment indicators. Policymakers may also need to monitor the potential systemic risks arising from the widespread adoption of sentiment-driven trading strategies.
The results of this research open avenues for further exploration into the integration of sentiment analysis with algorithmic trading. Researchers could investigate the impact of different sentiment sources, refine models for various market conditions, and examine how combining sentiment indicators with other data types (e.g., macroeconomic factors) influences trading performance.
Conclusions
This study empirically tested whether incorporating investor sentiment indicators, specifically the CNN Fear & Greed Index and cryptocurrency sentiment, into algorithmic trading strategies can enhance performance in the E-mini Nasdaq futures market. By comparing two models, one based solely on technical indicators and machine learning (Strategy 1), and another that integrates sentiment filters (Strategy 2)—we found that the inclusion of sentiment significantly improved key performance metrics related to risk-adjusted returns, volatility reduction, and capital efficiency.
Although Strategy 2 did not surpass Strategy 1 in terms of absolute net profit, it delivered superior outcomes in terms of Sharpe ratio, profit factor, and net profit over drawdown, all of which are essential for sustainable and risk-conscious trading. The results suggest that sentiment filters act as effective moderators, helping to avoid emotionally driven trades and improve the quality of signal execution.
From a practical standpoint, this research provides valuable guidance for quantitative traders and portfolio managers seeking to enhance algorithmic systems through sentiment integration. The findings recommend incorporating investor sentiment as a complementary filter, rather than as a predictive core, within technical and machine learning-based strategies, especially in volatile or uncertain market environments.
The results also support the broader theoretical view that behavioural factors can be systematically harnessed to improve quantitative models. However, sentiment signals should be applied carefully, with proper alignment to trading horizons and without assuming causal relationships, as their effectiveness may vary across market regimes.
In sum, this study offers a practical contribution to the literature on algorithmic trading by showing that sentiment indicators can improve performance when integrated into data-driven decision systems. Future research should extend this approach by exploring real-time deployment, broader sentiment sources, and adaptive models that can dynamically adjust sentiment weightings under different market conditions.
Limitations and Research Agenda
Several limitations should be taken into account in the interpretation of this study’s results. First, the analysis was conducted on a specific market, the E-mini Nasdaq futures, using 30-min bars. The results may not generalise to other markets or timeframes. Different asset classes or trading intervals may present behaviours that affect the performance of sentiment-based strategies. Additionally, the sentiment indicators used in this study, the CNN Fear & Greed Index and cryptocurrency sentiment, are just two possible sources of sentiment data. There may be other sentiment metrics that could perform better or worse, depending on the market conditions.
On the other hand, while sentiment indicators have shown value in enhancing risk-adjusted returns, they also present notable limitations. Their predictive power can diminish in markets driven by macroeconomic shocks or central bank interventions, where sentiment plays a secondary role. Moreover, sentiment data may be lagging or overly reactive, leading to false signals during periods of market overreaction or structural change. For instance, extreme fear may persist after a correction has already bottomed out, causing sentiment-based systems to miss recovery phases. These factors suggest that sentiment indicators should be used as complementary tools, not standalone decision drivers.
Another limitation is the reliance on historical data for backtesting. While backtesting provides valuable insights, it cannot fully account for future market shifts, unforeseen events, or changes in investor behaviour that may affect sentiment. The strategy’s performance in live trading may vary due to factors like slippage, transaction costs, and market liquidity, which were not explicitly considered in the current study.
Finally, the study only explored the integration of sentiment indicators into a fixed set of machine learning models. Future research could explore how sentiment analysis interacts with different algorithmic models, including reinforcement learning, deep learning, or hybrid approaches.
Future research could extend this study in several directions:
In conclusion, this study paves the way for future research into the integration of sentiment indicators in algorithmic trading, providing a foundation for further exploration of how investor emotions can be leveraged to enhance trading strategies.
Footnotes
Ethical Considerations
This article does not contain any studies with human or animal participants.
Disclaimer
This paper utilised ChatGPT for wording tasks and brainstorming purposes. However, the authors have thoroughly reviewed, edited, and supervised all the text. The authors assume full responsibility for the content presented in this work.
Funding
The authors disclosed receipt of the following financial support for the research, authorship, and/or publication of this article: This work was supported by the Universidad Internacional de la Rioja under Grant [number PP-2023-10] and by its Call for Grants for Scientific Publication in Prestigious Editorial Media.
Declaration of Conflicting Interests
The authors declared no potential conflicts of interest with respect to the research, authorship, and/or publication of this article.
Data Availability Statement
Data sharing not applicable to this article as no datasets were generated or analysed during the current study.