
Abstract
One of the most important factors that helps to obtain solid estimates and reliable predictions of the climate change variables which are characterized by continuous and non-monotonic changes is the modeling of the variables efficiently. In addition, the process of modeling climate change depends entirely on the characteristics and features of its variables. This aim is proposed due to the clear deficiency in the availability of papers related to the characteristics and features of global climate change variables. In addition, the literature on this issue indicates that the majority of global climate change studies are concerned with modeling data in developed/developing countries on one hand, and on other hand they rarely address the properties of data on climate change variables. Therefore, our work is considered innovative because we will propose a framework for how we can develop comprehensive explanatory and confirmatory analysis for characteristics of global climate data. And we will address global data related to a developing country as an example to illustrate how to conduct a comprehensive and in-depth analysis that can be served as a global guide to this issue. Based on available data of humidity from six stations for the period from 1981 to 2022, the framework was implemented, and the measures, tests, and methods applied in this paper include several descriptive statistics, testing of hypotheses, and visualizations of the data using the Kernel Density Estimation Method. The findings were decisive, unexpected, and confirmed many indicators and assured that the characteristics of any global climate data should be studied in advance in order to get right data modeling.
Plain language summary
The problem of the chosen study in this paper is based on several reasons. One of these reasons is to fill the gap or the deficiency of the literature in the availability of papers related to the studying of the characteristics and features of the data of GCC variables. In addition, the phenomenon of climate change and its consequences is the most dangerous and greatest existential threat facing the planet. Specifically, the temperature, rainfall, humidity, … are the most important factors in climate change, which should be studied and forecasted in order to mitigate the expected risks. In addition, humidity is one of the variables which can affect climate change, and consequently the life on the planet as discussed in this paper.
Keywords
Introduction
The phenomenon of Climate Change (CC) in the world is prevalent in many countries and is rapidly worsening with enormous negative impacts. It occurred and then rapidly developed due to human activities that do not take into account the conditions of a healthy environment or the interests of communities. In addition, the effects of CC take many forms, and its overall and long-term impact may be catastrophic and threatening to the existence of life on planet Earth (Grobusch & Grobusch, 2022; Yang & Chen, 2023).
Thus, CC has become a global phenomenon, and it features in news bulletins. In addition, several international conferences are held for cooperation between countries and researchers in order to reduce its risks; research is carried out and published for studying its expansion, spread, risks, and as a means of predicting its capacity, and to ascertain what the factors are which effected it, and how its affects can be mitigated.
The importance of climate in the life of this planet is very significant. In addition, life depends entirely on it, and it is impossible to imagine life on the planet without a natural climate. As it is known that one of the worst results of CC is global warming, and global warming results from the emission of various gases from factories, and the combustion of fuel, and because of wars and the gases that are harmful to life as a result of the explosions of various weapons, which leads to other consequences which result in irregular climatic conditions (Grobusch & Grobusch, 2022; Yang & Chen, 2023).
It is well-known that countries have made constructive efforts in collecting historical climate data and in providing it to institutions and researchers through establishing specialized centers which process and study this information in order to for it to be accessible to various other researchers for studying and forecasting. Indeed, the historical climate record data is also very important, and based on an understanding of climate fluctuations, an understanding of harmful climate phenomena that occurred in the past, and for anticipating future extreme climate phenomena, all of which makes it possible for any country to adopt the necessary policies that reduce the probable damage and allow society to adapt to CC (Murphy et al., 2017; Noone et al., 2021; Thorne et al., 2018; Wilby, 2016).
The effects of Global Climate Change (GCC) or GW can be extended to many countries and can affect every facet of life. In addition, because it is a global phenomenon, all countries of the world and their researchers are required to cooperate for the purpose of mitigating/controlling it or reducing its harmful effects. In order to mitigate the problems caused by GCC/GW, the data of different variables of GCC/GW should be accurately collected in every country, and it should be available for all researchers of the world (Murphy et al., 2017; Noone et al., 2022; Thorne et al., 2018; Wilby, 2016).
In addition, the collected data mainly included the countries’ data on temperature, pressure, and rainfall. However, the data of these variables together represent an incomplete diagnosis of the climate system for any country and do not adequately serve the purpose of these centers. However, the availability of relative and absolute humidity data with other climate data is an important and indispensable measure for climate studies and forecasts (Willett, 2007). Atmospheric humidity is a term used to describe the amount of water vapor in the atmosphere (Willett, et al., 2014, p. 1983).
The interpretations of climate systems in the world show that it is a strong mechanism that affects humidity in the climate system, and the above mechanism has an effect on humidity in the climate system, which is explained as follows: “any increases in surface water vapour (absolute humidity) will lead to greater warming aloft due to latent heating effects upon condensation. Furthermore, any changes in surface absolute humidity have implications for upper-tropospheric water vapour content, where it plays a significant role in the global radiation budget as a greenhouse gas” (Soden et al., 2005; Willett, 2007).
Regarding the role of the effect of humidity in the atmosphere, several authors conclude that “the water vapour plays a key role in determining the dynamical and radiative properties of the climate system” (Allen & Ingram, 2002; Trenberth, 2011; Willett, 2007). In addition, it has an impact on a number of meteorological processes, including cloud formation, precipitation, and temperature control (Palerme et al., 2017). It is crucial to analyze the levels of humidity within a country’s borders. Humidity is of great importance in the agricultural sector (Siloko et al., 2021). Humidity affects crop growth, plant diseases, and soil moisture levels (Chowdhury et al., 2021). Farmers rely on humidity data to optimize irrigation and determine ideal planting times and to control disease etc. (Chai et al., 2019).
Humidity is considered as a significant contributor to weather patterns and for developing defective scenarios for extreme weather phenomena, such as hurricanes, thunderstorms, and fog. It has significant influence on environmental systems (Dorward et al., 2020). In addition, the geographical distribution of species and the habitats of plants and animals are both impacted by humidity in ecological systems (Ghanem, 2020).
Furthermore, humidity also has important implications for the studies of the effects of CC such as human heat stress and its relationship to humidity. In addition, an essential part of meteorology and environmental studies is humidity analysis, which looks at the quantity of moisture in the atmosphere. It may be mentioned that humidity, often known as the amount of water vapor in the air, has a significant role in the climate, weather, and other natural phenomena. Changes in humidity can have an impact on a region’s climate, precipitation patterns, and drought conditions (Grobusch & Grobusch, 2022; Noone et al., 2021; Souch & Grimmond, 2004; Thorne et al., 2018; Willett, 2007; Yang & Chen, 2023).
It was also noted that there is great potential and benefit in collecting data on possible CC variables, such as supplementing climate forecasts with historical data of humidity and temperature with data from epidemiological records in any country for the purpose of obtaining accurate forecasts of the of future CC and its potential effects on the environment and humans, and the possibility of providing accurate health warnings regarding various diseases related to human health, and so the adequacy of available hospitals to deal with the consequences of Climate Change (ibid).
It may be necessary to mention that humidity has a significant impact on public health. In addition, it is well-known that human comfort and health are impacted by humidity levels (Goldie et al., 2015) – low humidity can cause respiratory issues, while high humidity can make one uncomfortable and make heat-related illnesses worse. In order to ensure wellbeing, building designs and public health activities are supported by a humidity analysis (Tzuc et al., 2021). Also, the effectiveness of heating, ventilation, and air conditioning systems is greatly influenced by humidity (Sung et al., 2022); for energy savings and indoor air quality, proper humidity control is crucial. Humidity is highly related to the weather and climate of a country (Siloko et al., 2021).
Precise humidity management is necessary and benefits many industrial activities (Jakovljević & Lisjak 2019), including manufacturing and pharmaceuticals. In many sectors, accurate humidity analysis assures product quality and process effectiveness. Material preservation, including food products, historical documents, and works of art are impacted by humidity. Controlling humidity levels is essential for avoiding deterioration and damage (Jakovljević & Lisjak 2019).
In addition, the humidity analysis in energy production is essential for maximizing the efficiency of power plants and renewable energy sources. The effectiveness of hydropower facilities – wind turbines and solar power systems, are affected by humidity (Castañeda-Miranda and Castaño-Meneses, 2020). Also, building design and construction must take into account humidity levels (Tzuc et al., 2021).
Regarding analyzing data of humidity: it is well-known that it is essential for every sector including agriculture; specifically crop infections can be brought on by high humidity levels, whereas crop stress can be brought on by low humidity levels. Thus, humidity information is valuable and is used by farmers to plan irrigation systems and protect their crops. In addition, humidity analysis is closely related to urban planning (Macassa et al. 2022); humidity levels must be taken into account in building designs to protect structural integrity and guarantee occupant comfort. Engineers and architects can learn about moisture control strategies via humidity analysis (Farzampour, 2017).
The importance of humidity mentioned in the above paragraphs unfortunately clashes with a reality that it is not commensurate with its high level of importance; internationally speaking it does not get enough attention, so we note that “to date, efforts to collate records of surface water vapour to form climate records have been limited to small regions, considered only by land observations, or have made no attempt to ensure station homogeneity” (Noone et al., 2021; Willett, 2007; Willett et al., 2014). In addition, the awareness and special interest in the importance of and the impact of humidity studies on CC and their expectations in developing countries may be completely different from what exists in developed countries. It is non-existent in the majority of developing countries, and Oman may not be much different in this regard.
It is clear from what was stated above that there are great efforts being made in collecting data on climate variables, but this process is supposed to be followed by great efforts in studying the features and properties of the data and in examining its properties and the basic conditions for modeling it according to its characteristics and features by using any a suitable existing model, but the literature indicates a clear deficiency in this aspect (Al-Hemyari & Al-Abasi, 2023, 2025; Ofori, et al., 2023; Kiss et al., 2022; Hoekstra, et al., 2012; Van Der Valk et al., 2007).
In addition, “little information tends to be reported on whether the data satisfy the assumptions underlying the statistical techniques used” and “it was found that the assumptions of the techniques were rarely checked” (Hoekstra et al., 2012, p. 1). Unfortunately, as the consequences of this action, no one has addressed the results of forecasting by such models or what the level of model testing and fitting is. In fact, the above step seems to be a forgotten step in the work of data modeling. In addition, “it has been suggested that the assumptions of statistical techniques are often not checked” (Patino & Ferreira, 2018, p. 1) and several reasons were given.
One possible explanation for this problem may be that some researchers may not know relatively when and how to verify the assumptions and properties of data under study, or they may not appreciate the consequences of neglecting those assumptions and properties. Moreover, the violations of not verifying the assumptions and properties of data definitively will negatively affect all the results of modeling any data, and their efficiency and goodness of fit. In addition, the global scientific community and research reviewers of various reputed journals overlook this matter, even the most prestigious journals tolerate this fundamental and important lack of knowledge (Al-Hemyari & Al-Abasi, 2023, 2025; Hoekstra et al., 2012; Horel & Giesecke, 2020; Hu & Plonsky, 2021; Patino & Ferreira, 2018; Patriota, 2017; Shatz, 2024; Yang & Huck, 2010).
This paper contains eight sections. Section “The Needs of the Research and its Objectives” explains the needs of the research and its objectives. The literature is discussed in Section “Review of Literature.” In Section “Steps and Processes” the processes and procedures are given. The explanatory and confirmatory methods and the results based on explanatory and confirmatory methods are demonstrated in Sections “Explanatory and Confirmatory Methods” and “Results” are likewise therein mentioned. The conclusions, recommendations, limitations, and future directions are described in Section “Conclusions, Recommendations, Limitations, and Future Directions.”
The Needs of the Research and Its Objectives
The need for this research comes from several real national and international reasons. The first reason is the international direction of CC, which is based on the fact that the availability of humidity data with other climate data, that is, data on temperature, pressure, and rainfall is an important and indispensable measure for climate studies and forecasts because of the existence of the strong mechanistic effects of humidity in the climate system. Secondly, due to the importance of humidity studies in life and because of the urgency of these studies, precise humidity management, including data analysis, is necessary and benefits the planet, human health, agriculture, and many other industrial activities, such as manufacturing and medicine.
Thirdly, it is due to the global and national need to collect humidity data in all countries of the world, including developing countries, to mitigate the risk factors of the phenomenon of humidity. Fourthly, it is due to the limited number of studies in CC and particularly the humidity studies in Oman, and to very limited comprehensive studies on CC in Oman; this research was planned in order to bridge the gap of the limited research in climate studies in Oman.
Fifthly, we will study, analyze, and test the data mathematically and statistically and try to develop significant indicators for it to arrive at its true properties and specifications, propose a possible probability distribution function that fits the reality of the data, that is, one of the justifications of this paper is to fill the gap of the literature on how to verify the assumptions and properties of the data GCC/GW. The literature of this topic shows that most of the studies on modeling the data of GCC/GW are not verifying the assumptions and properties of the data under study. In addition, the risks resulting from the above reason are great and may lead to not achieving the goal of the data modeling in obtaining accurate results; and it may contradict the reality and fail to serve the study aims as the literature indicates a clear deficiency in this aspect (Al-Hemyari & Al-Abasi, 2023, 2025; Hoekstra, et al., 2012; Kiss et al., 2022; Ofori, et al., 2023; Van Der Valk, et al., 2007).
The aim of this paper is sevenfold [to]:
(a) review the problem of GCC through the humidity factor;
(b) discuss the importance of humidity in climate systems;
(c) collect a comprehensive data of the humidity of Oman;
(d) discuss the problem of not verifying the characteristics and assumptions of data on GCC; and discussing the effect of the violations of those characteristic and assumptions;
(e) develop comprehensive explanatory and confirmatory analysis for studying the characteristics and assumptions of GCC variables;
(f) consider the data of humidity of Oman as an example, and apply several explanatory analyses to the data; and
(g) explain and interpret the results of explanatory analyses of the data in (d) above and explore some concluding remarks, limitations of the problem and future direction, and to explain and interpret the results of developing the framework.
Review of Literature
The volume of scientific research in GCC in general and especially in humidity studies is very broad and goes in several directions. In addition, it is really difficult to review all the papers of humidity studies and their directions and become familiar with all aspects of the subject.
In addition, the volume of the research in GCC in general and especially in humidity may be classified into the many directions it has taken. Some of these are expressed in natural, physical, or chemical models; the Convection-Permitting Climate Models (CPCMs), the responsibility of humans in CC variables; developing new techniques of data collecting of CC based on sensors; and mathematical and statistical techniques. In addition, the volume of the research that applied statistical methods was extensive. Therefore, in this paper, some of the available research will be reviewed, especially those important topics that are related to the objectives of this paper.
A considerable number of papers have studied CC in general or the humidity factor specifically based on its natural, physical, or chemical properties and attributes – some of which are: Wang et al. (2023), Forster et al. (2023), Flammini et al. (2023). In addition, the well-known simulations technique and some statistical measures are also used in models called “(Convection-permitting Climate Models, CPCMs)” for the purpose of providing advice on expected changes in climate variables such as humidity, on a spatial and temporal level (Lenderink et al., 2024; Prein et al., 2015; Savić et al., 2023). It may be mentioned that “the Convection-permitting Climate Models (CPCMs) are becoming increasingly used in CC studies” (Lenderink et al., 2024, p. 1).
When we were searching for research sources, it was noted that there was a large number of good research papers related to the fact that humans are the decisive factor in CC; some common activities are burning fossil fuels and cutting down forests, gases emanating from factories, wars and the explosions and their gaseous offshoots, and others that have an increasing impact on CC and the rise of the Earth’s temperature. We quote a few authors who have looked into this aspect of CC: Yin et al. (2023), Sreenivas (2022); Yi et al. (2022); Evseeva et al. (2021), Cianconi et al. (2020), and Lynas et al. (2021).
Some other papers deal with developing new data sets. Examples are (Penna et al., 2023) who, in their study of the Adriatic Sea, described “the sensor data collection, storage, and quality assurance and control procedures applied to the depth (pressure) and temperature profiles dataset collected by means of AdriFOOS in the period 2012–2020.” Noone et al., proposed a technique for Copernicus Climate Data Store (CCDS) in order to “present details of land and marine data holdings inventoried, highlighting priority needs in terms of periods, regions and essential climate variables.”Cao et al. (2021) developed a new data set for “Sea Surface Temperature” based on different censors. It may be mentioned here that the above three topics are not related to our current research problem.
Al-Marhoobi and Pepelyshev (2023) studied the trends of the “annual oscillations” and “daily periodicities monotonic” temperature and humidity of Oman for the period from 2009 to 2018 using “Time Series Analysis” (TSA) and “Singular Spectrum Analysis (SSA).”
Al-Ajmi et al. (2022) collected the data of the summer months (May, June, July, August, and September) of Muscat-the Capital of Oman for the period 2002 to 2028 about the “daily weather temperature” and the “relative humidity” and analyzed this data using several descriptive statistical measures in order to study the effect of the heat and humidity on construction. Yu et al. (2023) investigated the characteristics of the relative humidity vertical distribution prior to precipitation using microwave radiometer data across Southeast China.
Zhang et al. (2022) studied the “daily maximum and minimum near-surface air temperature” and modeled the “near-surface air temperature” using the SVCM-SP algorithm to estimate the parameters. In addition, the data covered the period 2003 to 2020. Smith et al. (2022) studied the “wind-bias-adjusted precipitation data set from the Environment and CC Canada automated from 2001 to 2019” using the simulation program “Solid Precipitation Intercomparison Experiment” (SPICE).
Serman et al. (2022), studied the problem of “quantifying the relationship between humidity and influenza incidence at the state-level in the United States; the study was performed using regression analysis” (p. 1). Mohammed et al. (2022) analyzed the changes in observed rainfall and minimum and maximum temperature extremes in the “Upper Blue Nile Basin (UBNB)” of Ethiopia for the 1980 to 2019 period using some statistical measures. Hassan and Hashim (2020) generated and studied the data of the maximum temperature of south of Iraq from 2020 to 2099 using the techniques of “GCM models, HadCM3, and CanESM2,” and developed the common statistical analysis and modeling of the data by “Statistical Downscaling Model (SDSM).”
In addition, “185 papers published between 2014 and August 2020 on CC are reviewed” by Fathi et al. (2022). Kuzubasoglu (2022) reviewed several papers on “humidity sensors.” In a Flat Plate Multi-Layer Desiccant Cooling System, Sharma and Kaushal (2021) performed an Analysis of Moist Air’s Relative Humidity and Temperature Using Experimental and Statistical Data.
Macpherson et al. (2020) looked at gas-solid interfaces with impulsive flashover characteristics and variable relative humidity using Weibull statistical analysis. In Abuja, Nigeria, Segun et al. (2020) statistically modeled the influence of weather conditions on the occurrence of malaria. The analysis shows that relative humidity is rising at several stations.
Al-Hemyari and Al-Abasi (2023, 2025) collected the data of daily maximum and minimum temperatures from three cities/stations – North, Middle, and South of Iraq for the period of 1980 to 2019 and 1970 to 2019 respectively. In addition, statistical analysis of both papers is done; and the analyses of the second paper is concentrated on GW as applied to Iraq and worldwide.
Seyedhashemi et al. (2023) in their study “presented retrospective simulations (1963–2019) and future projections (1976–2100) of daily time series of discharge and extremes of temperature for the large European basin-Loire basin, France.”Wubaye et al. (2023) studied the extremes of daily rainfall and daily temperature in Ethiopia for the period from 1986 to 2020. In addition, the data is collected from several stations through the “National Meteorology Agency (NMA)” and has developed “statistical trend analysis” for both variables.
It may be mentioned that several other statistical analytical methods and modeling techniques are also developed in CC variables. The well-known structural equation modeling technique of surveys analysis have been developed for different related issues of CC by Baki (2022), He et al. (2020), Li et al. (2018), Smith et al. (2014), and Tikir and Lehmann (2011).
Tuluri et al. (2022) examined how machine learning was applied to research the correlation between environmental factors and COVID-19 cases in Mississippi. Marzouk (2021), based on the data of the air temperature (at a height of 2 m from the ground) of Al Buraimi Governorate-Oman which were obtained from the “online public database of NASA (POWER),” the “simple linear regression,” and classical “F-test,”“test for variances,” and one-factor “Analysis of Variance (ANOVA)” have been developed.
Uetake et al. (2019) assessed the seasonal variations in the bacterial populations in the air over Tokyo and the impact this has on the regional weather. It may be mentioned that “55 articles of global CC impacts were reviewed systematically and analyzed for research topics and other aspects” by Abbass et al. (2022). Also, Santos and Bakhshoodeh, 2021 searched thousands of papers then reviewed 100 cited papers on “climate change/global warming/climate emergency” from 1910 to 2020.
Steps and Processes
The Problem of the Chosen Study in This Project Is Based on Several Reasons
One of these reasons is the phenomenon of CC and its consequences being the most dangerous and greatest existential threat facing the planet. Specifically, the temperature, rainfall, humidity, … are the most important factors in CC, which should be studied and forecasted in order to mitigate the expected risks. In addition, humidity is one of the variables that can affect CC, and consequently life on the planet as discussed in Section “Introduction.” Also, there is a big gap in studying this issue in Oman and the globe (see Sections “Introduction” and “The Needs of the Research and its Objectives”), which necessitates rapid intervention in order to study the problem by developing some possible scenarios. It may be mentioned here that the feasibility of this project was studied and approved.
The Six Meteorological Stations of Oman
There are six meteorological stations in Oman which have collected data for several variables of CC. These stations are: (a) Diba, (b) Rushtaq, (c) Suwaiq, (d) Haima, (e) Salalah Port, and (f) Thumrait and highlighted in Map 1 (https://www.nationsonline.org/oneworld/map/oman-map.htm).
Sources of the Data
The metrological data in Oman is collected in different modes and stored in several different sources. Some of the available sources are the National Centre for Statistics and Information; the Directorate General of Meteorology; the online public database of NASA known as POWER; the Civil Aviation Authority; and National Oceanic and Atmospheric Administration.
Selecting the Data of Humidity
The available data of CC for Oman is extensive and has regard to several random variables which relate to CC. Analyzing the data from all the random variables is not an easy task; it will require a considerable amount of time and necessitate a large amount of space, which exceeds the limitations of this paper. Due to some significant reasons related to data features and quality, the data of this project is based on NASA POWER data (https://power.larc.nasa.gov/data-access-viewer).
Data Checking
The data is checked thoroughly in order to find the missing data or any anomalous observations.
Data Analysis
Because of the lack of the research studies on Climate Change in Oman, especially of the comprehensive analysis of humidity, most of the analysis of available research of CC in Oman was done either by incorporating elementary analysis or it was done without verifying the required characteristics/properties of the developed techniques. Therefore, in this phase the data of this paper is to be analyzed using several techniques in order to verify all the possible characteristics of the other data by developing the Explanatory and Confirmatory techniques including several descriptive measures, several hypothetical tests, and several advanced mathematical/statistical techniques. It may be mentioned that the results of the explanatory and confirmatory methods of this paper were obtained using Statistica, IBM SPSS Statistics, and R.
Explanatory and Confirmatory Methods
Explanatory and Confirmatory analysis is extremely necessary for any collected data in order to successfully use the insights from humidity data. It helps to recognize trends, changes, and extremes by understanding the distribution of humidity levels. Understanding and analyzing the humidity patterns and characteristics can help us to achieve proper modeling for the data and for accurate future predications in order to mitigate the risks of the phenomenon of humidity.
Descriptive Statistics
The statistical measures (mean, median, mode, etc.) are examples of descriptive statistics that offer summary measurements that give a fast overview of the central trend of humidity data. In addition, understanding the typical humidity level in a given dataset is made easier with the help of average and the data summaries which support the initial examination and interpretation of the data. Also, the most representative value of humidity within a dataset can be found using the above measures, and because of these measures we can determine if the data tend to cluster around a certain degree of humidity or not.
In addition, the dispersion or variability of humidity data is quantified by descriptive statistics, like the range, variance, and standard deviation. In addition, the skewness and kurtosis show how the humidity distribution is shaped.
Normality Testing
As it was mentioned in the Section of Methodology that the analysis of available research related to CC in Oman was done with either incorporating elementary analysis or it was done without verifying the required characteristics/properties of the developed techniques. Thus, the first testing of the Explanatory and Confirmatory Analysis to be developed is the normality test of the data. In addition, three testing methods were applied to confirm the normality or non-normality pattern of the data; these three tests are described as follows.
The Shapiro-Wilk test. A common statistical test for determining the normality of a data sample is the Shapiro-Wilk test. In addition, checking the normality is a crucial step in data analysis because normality is a prevalent assumption in many statistical tests and modeling techniques. The Shapiro-Wilk test determines if a certain data sample is representative of a normal distribution. The following is the hypothesis that will be tested:

The Anderson-Darling test. This test is “a goodness-of fit test which allows for the controlling of the hypothesis that the distribution of a random variable observed in a sample follows a certain theoretical distribution which gives more weight to the tails than does the Kolmogorov-Smirnov (K-S) test” (The Encyclopedia of Statistics, 2008). In addition, it is a modification of K-S, and it is fitted for large sample size. The hypothesis of the Anderson-Darling test is similar to the above hypothesis. It may be mentioned that the Lilliefors test is another analog of the above tests.
Units, Classification, Estimating the Percentage, and Expected Level of Humidity
The measures of humidity are either “Absolute humidity unit” or “Specific humidity unit” which are measured by g m−3 and g kg−1 respectively (Rübner et al., 2008). In addition, “the relative humidity” at a specific temperature is measured by (Rübner et al., 2008),

It may be mentioned that the available data of the humidity of Oman is measured by the relative humidity. In order to show a comprehensive picture, the classification of the data of the humidity from six stations into several classes, estimating the percentage and expected number of days of the maximum/minimum humidity are to be developed.
It seems reasonable to place the data of minimum humidity into several classes, that is, it is divided into thirteen classes (the first with a length of less than 5, the final with a length of more than 60, and the others for a length of 5). Additionally, the maximum humidity period was divided into 11 classes with the first having a length of less than 10 and the last having a length of more than 60, the percentage and expected number of days of the maximum and minimum humidity (which is equivalent to the probability of each interval or category) are to be estimated and studied in this paper.
Hypothesis Testing and Comparing Several Stations
When testing a number (greater than or equal to 3) of independent groups, multiple hypotheses for those groups are tested by applying the Analysis of Variance (ANOVA) test. In addition, the basic assumption for applying the ANOVA test must be that the groups are approximately normally distributed, or that the samples are large enough. When the assumption of a normal distribution is not achieved or the samples are small, a nonparametric test is appropriate to test the same hypothesis. Note that there are a number of tests that fulfill this purpose, and two them to be implemented to test the data of humidity. The non-parametric Kruskal-Wallis H test is to be developed, and the related hypothesis of this test is given by,
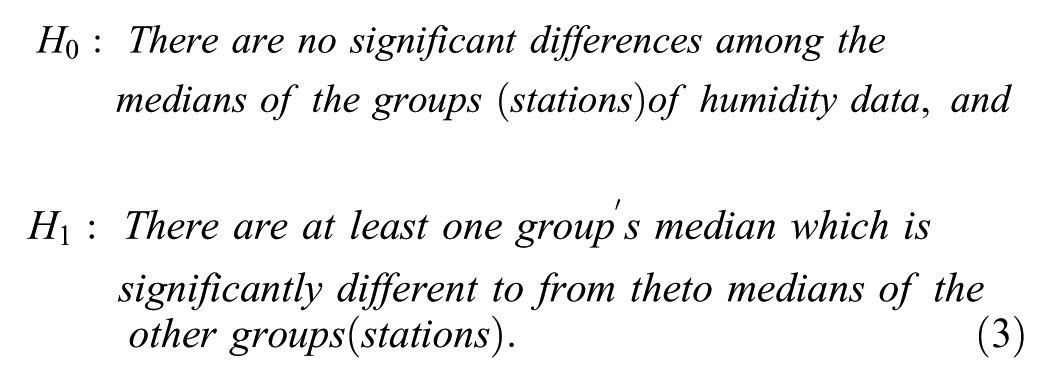
In other words, there is a significant difference in medians among the data of humidity from the stations being compared. One of the necessary tests to complete the result of the Kruskal-Wallis test is called the Dunn’s test; it is used to find out which group or groups have significant differences to other groups. This test is conducted through pairwise comparisons between each of the two independent groups to find out which groups differ statistically significantly from others at the level of α (Dinno, 2015). The related hypotheses of Dunn’s test is given by,

Visualizations and Density Function Estimation
In Sections “Normality Testing” and “Hypothesis Testing and Comparing Several Stations” several important testing of hypotheses techniques are to be implemented to the data of humidity. In order to complete the analysis, and to confirm the results of testing in the above sections, a very efficient and famous non-parametric estimation technique called the Kernel Density Estimation is also to be developed in this paper.
An important method for non-parametric estimation of the probability functions is called the “Averaged Shifted Histogram (ASH),” proposed by Scott (1985). This method is undoubtedly better than its predecessors in avoiding the mathematical derivation complications, thus simplifying them, while achieving good efficiency for its estimation, not less than the histogram methods (Scott, 2015).
It is well-known that the “ASH is a discretized representation of a Kernel estimator” (Scott, 2004), and an alternative technique called the “Kernel Density Estimate (KDE),” which is based on the “Fast Fourier Transform Approach,” and is an important method, more advanced than its predecessors, and truly useful in providing a smooth curve for any set of data. In addition, a more thorough analysis of data patterns, peaks, and modes is possible since the method gives a smooth picture of the underlying data distribution (Klemelä, 2009; Scott, 2004, 2015). It may be mentioned that the KDE algorithm takes a parameter and bandwidth that affects how “smooth” the resulting curve is; and KDE is calculated by weighting the distances of all the data points” (ibid). The KDE of the probability function of the given data set is defined (ibid) by,
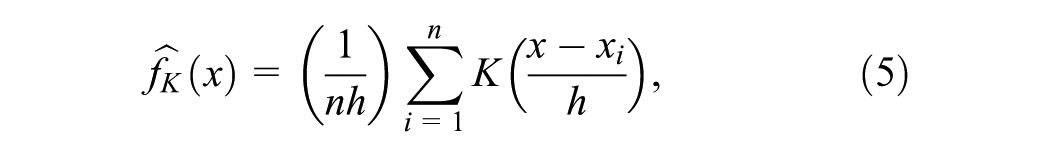
where
In addition, in KDE every data point is given a “Kernel function,” by which all functions are then added up to produce a continuous smooth curve that closely resembles the underlying distribution. The form of the estimated Kernel density depends on the chosen Kernel function, which is frequently a Gaussian (normal) distribution. In Kernel density analysis, the bandwidth parameter regulates the width of the Kernels (ibid).
It may be mentioned that a greater bandwidth produces a smoother, less detailed estimate while a narrower bandwidth produces a more detailed but noisy estimate. In addition, among the several advantages of Kernel Density Analysis is its ability to smooth out the noise in the data, revealing underlying patterns and trends that might be obscured by individual data points. In addition, the graphic representation of the estimated Kernel density which is called a Kernel density plot, is frequently used in data visualization, in order to get more understanding of the distribution of a dataset (ibid).
In this section, the technique of KDE is to be developed in order to estimate the Probability Distribution Function (PDF) of the data of the humidity of the six stations. Thus, comparing the distributions of several datasets can be done with the use of Kernel density graphs. The ability to compare groups or categories within the data visually is made possible by superimposing several Kernel density graphs. Also, it is possible to better grasp the data features including skewness, multimodality, and the presence of outliers on the basis of these displays. In addition, the central tendency and distribution of the data, as well as the existence of subpopulations or separate clusters, can all be revealed via Kernel density plots (ibid).
Results
Goodness of Fit for Normality
It is well-known that “the statistical modeling of data has the general purpose: understanding the shape and features of data through the density function” (Scott, 2004, 2015). In order to understand the shape and features of any data, the normality assumption should be checked. The normality on extreme data (minimum and maximum) of the humidity data for all the stations in northern and southern regions were analyzed using the non-parametric tests: Anderson-Darling test, Shapiro-Wilks test, and Lilliefors test.
The results of the above three tests are given in Table 1. It can be observed from this table that the hypothesis (1) is rejected, that is, the results of all three normality tests provide compelling support for the conclusion that the humidity data from the six stations did not follow a normal distribution.
The Goodness of Fit for Minimum and Maximum Humidity of Northern and Southern Using the A-D, S-W, and Lilliefors Tests.

Non-Parametric Analysis of Humidity
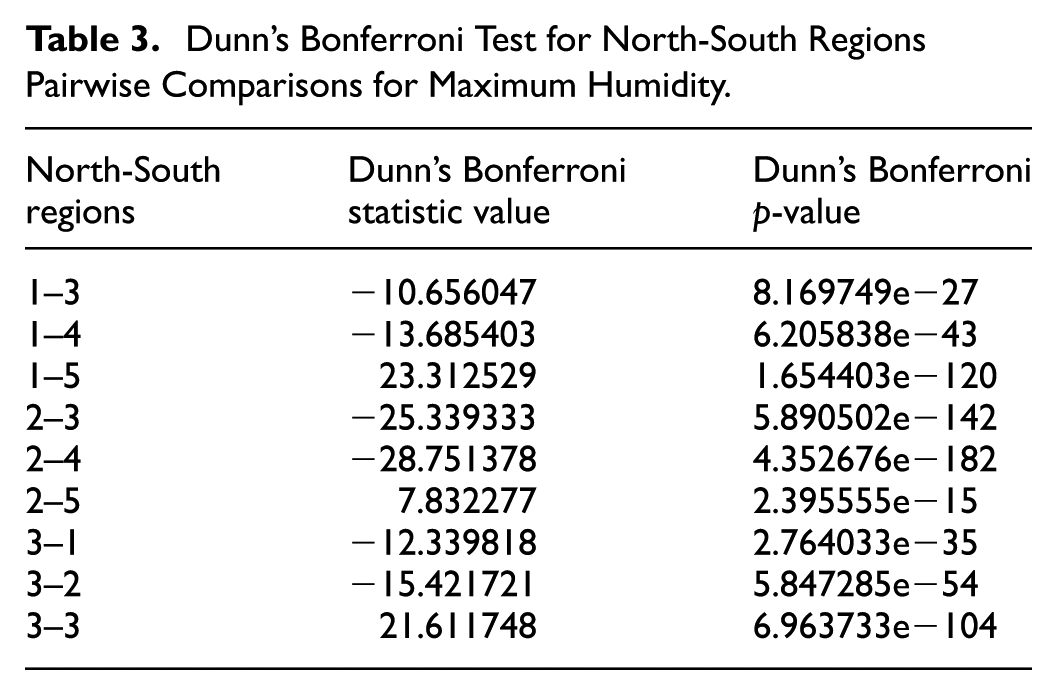
As mentioned in Section “Hypothesis Testing and Comparing Several Stations,” the Kruskal-Wallis test is to be developed in order to test the differences of humidity between the six stations; and the Dunn’s test is also to be developed if the Kruskal-Wallis test is significant in order to know which station (s) caused the significant results. The results are displayed in Tables 2 and 3, and the findings show that for all regions, both the minimum and maximum humidity were significant.
Dunn’s Bonferroni Test for North-South Regions Pairwise Comparisons for Minimum Humidity.

Dunn’s Bonferroni Test for North-South Regions Pairwise Comparisons for Maximum Humidity.
Estimating the Confidence Intervals, Percentage, and Expected Number of Days During the Year of Humidity
The results of the section related to the estimation of the 95% confidence intervals of the Kernel Density Estimation of minimum/maximum humidity of northern and southern regions (Table 4), the percentage and expected number of days of the maximum and minimum of Humidity are given in Tables 5 to 8, and the summarized outcomes are delivered below:
A 95% Confidence Interval Kernel Density Estimation of Minimum/Maximum Humidity of Northern and Southern Regions.

Percentage of Days for Minimum Humidity for the Northern and Southern Regions.

The 95% confidence intervals of the Kernel Density Estimation of minimum/maximum humidity of northern and southern regions are given in Table 4.
For the expected year, the ranges of percentage of days of each interval for minimum.
Humidity in northern regions (Diba, Rushtaq, and Suwaiq) and southern regions (Haima, Salalah Port, and Thumrait) are (0.034, 0.118) and (0.020, 0.209) respectively (Tables 5 and 6).
For the expected year, the ranges of number of days of each interval for minimum humidity in the northern regions and southern regions are (12.366, 43.053) and (7.364, 76.329) respectively (Tables 5 and 6).
The minimum and maximum numbers of days during the expected year for the minimum humidity of northern regions were for the periods 5 ≤ H < 10 and 25 ≤ H < 30; and for the southern regions were for the periods H < 5 and 10 ≤ H < 15 (Tables 5 and 6).
For the expected year, the ranges of percentage of days of each interval for maximum humidity in northern regions and southern regions were (0.004, 0.911) and (0.009, 0.930) respectively (Tables 7 and 8).
For the expected year, the ranges of number of days of each interval for maximum Humidity in the northern regions and southern regions are (1.520, 332.428) and (3.21, 339.34) respectively (Tables 7 and 8).
The minimum and maximum numbers of days during the expected year for the maximum humidity of northern regions are for the periods 20 ≤ H < 25 and H ≥ 60; and for the southern regions are for the periods 15 ≤ T < 20 and H ≥ 60 (Tables 7 and 8).
In minimum data of humidity, Tables 5 and 6 show that for the northern regions (1, 2, and 3), the maximum probability and number of days are 0.109; 39.927 respectively in the class of 55 ≤ H < 60 and are achieved in Diba; and for the southern region the maximum probability and number of days are 0.627; 229.001 respectively in the class of H ≥ 60 are achieved in Salalah Port. In addition, the maximum probability and number of days of Salalah Port is.
Higher than other stations.
Regarding maximum humidity, Tables 7 and 8 show that for the northern region, the maximum probability and number of days are high at all the stations; and the maximum of probability and number of days is achieved in Diba rather than in other northern stations with (0.911, 332.428) respectively in the class H ≥ 60; and for the southern region the maximum probability and number of days are also high in all the stations in the class H ≥ 60 rather than in other classes, and the maximum probability and number of days of Salalah Port is higher than in other southern stations.
Expected Days for Minimum Humidity for the Northern and Southern Regions.

Percentage of Days for Maximum Humidity for the Northern and Southern Regions.

Expected Days for Maximum Humidity for the Northern and Southern Regions.

Kernel Density Estimation Analysis for Humidity
As discussed in Section “Visualizations, and Density Function Estimation,” the Kernel Density Estimation (KDE) is a very accurate technique used to calculate the probability density function of a continuous random variable from a dataset. Moreover, estimating the probability density function of the humidity data is a step in the KDE methodology. In addition, as mentioned in Section “Visualizations, and Density Function Estimation” the purpose of developing the KDE technique is to confirm the results of the testing hypotheses given in Sections “Goodness of Fit for Normality” and “Non-Parametric Analysis of Humidity.”
The KDE for each station and for minimum and maximum humidity are given in Figures 1 and 2. Based on these Figures, the shape of minimum and maximum humidity for the southern and northern stations can be visualized in order to understand possible modeling of the data and comparing them.

Kernel density plot for minimum humidity: (a) Diba, (b) Suwaiq, (c) Rushtaq, (d) Haima, (e) Salalah Port, and (f) Thumrait.

Kernel density plot for maximum humidity: (a) Diba, (b) Suwaiq, (c) Rushtaq, (d) Haima, (e) Salalah Port, and (f) Thumrait.
The KD plots for minimum humidity given in Figure 1 show that the plots of the six stations have either one, two, or three distinct peaks which indicate that the distributions are unimodal or multimodal. This explains that the data of all the stations of minimum humidity are not normally distributed. In addition, this observation is also true for the KD plots for maximum humidity which are given in Figure 2. Thus, the possible mathematical modeling of the data of minimum humidity and maximum humidity cannot be developed based on the normal distribution.
It may be mentioned that the above graphs show 95% confidence intervals of the Kernel Density Estimation of minimum/maximum humidity of northern and southern regions (please refer to Table 4).
Conclusions, Recommendations, Limitations, and Future Directions
In this paper, we have studied the humidity which is one of the CC variables which has a significant impact on the environment and society. In fact, the data was obtained from the Directorate General of Meteorology, Oman for the period 1981 to 2022, and after examining it, we began to study it.
It is necessary to clarify that the various explanatory and confirmatory analysis/methods, especially the advanced ones, have been applied in a creative way, and in a comprehensive and extensive manner. We can say that the methods of descriptive statistics, several hypotheses testing and density function estimations have been used in an unprecedented way in studying a huge data set of relative humidity for about 40 years and from six stations in this paper.
There were no previous explanatory and confirmatory analysis to know the statistical properties of humidity in Oman, as this point was explained in the methodology, and because any statistical analysis of CC factors must be based on certain properties, so our study was explanatory and a confirmatory analysis.
Specifically, the explanatory and confirmatory analysis of humidity data of this paper included the following phases: firstly, and in order to understand the properties, distribution, and variability of humidity data, the descriptive statistical measures have been implemented in this paper since they are important tools in studying the humidity data. The results give a full picture of the nature, levels, and differences of the humidity between the stations.
Secondly, because several natural phenomena follow the normal distribution, and many of those phenomena do not achieve this property, the second group of explanatory and confirmatory analyses develops some of the tests of normality using the Shapiro-Wilk test, Lilliefors test, and the Anderson-Darling test. It was shown from the results of the above tests that the humidity data are not distributed normally, so it is not possible to apply any classical/parametric models or methods for studying, modeling, and forecasting the humidity in Oman, due to the required condition of normal distribution.
The third set of explanatory and confirmatory measures for the humidity data are units, metrices, and classification of the data of minimum humidity into 13 classes, and the maximum humidity period was classified into 11 classes In addition, the humidity data classification categories gave a clear picture of how humidity levels are distributed throughout the year in Oman, also the probability (percentage) of each category and the number of days according to each category throughout the year.
For comparing the six stations in terms of the maximum and minimum humidity; it was found that Rushtaq had the minimum levels of humidity in the northern region whereas the maximum levels were in Diba. In the southern region, Salalah Port showed the maximum levels of humidity; in fact, the maximum levels of humidity of Salalah Port were found to be the highest of all the six stations herein mentioned. Regarding maximum Humidity, and for the northern region, the maximum humidity was achieved in Diba also. In addition, regarding the southern region the maximum humidity was also achieved in Salalah Port, which is higher than other northern and southern stations.
Testing the differences between the data of the six stations (six independent groups) was done based on the Kruskal-Wallis H test and Dunn’s test which is the fourth set of explanatory and confirmatory analyses. In addition, these tests are significant, that is, the humidity ratios of the six stations are different. This point shows that there is a high difference in the humidity between the governates and towns of Oman.
Fifthly, in order to complete the explanatory and confirmatory analysis, and to confirm the results of testing in the second group tests above, and for the stabilizing of the distribution properties of variables, based on more accurate and comprehensive tests, a very efficient and famous non-parametric estimation technique denoted by KDE was developed in this paper for the humidity data of the six stations. The KDE plots for minimum/maximum humidity show that the plots of the six stations have either one, two or three distinct peaks which indicate that the distributions are unimodal or multimodal. This explains that the data of all the stations of minimum/maximum humidity are not distributed in a normal manner.
Thus, the attribution by applying KDE in humidity data is very useful and confirms the results of the second group tests above, and this shows that the data graphs of the six stations with more than one peak are not distributed in a normal manner. In addition, the conclusions of the above tests and measures give multiple, diverse, and reasonably highly reliable results.
Finally, it is useful to clarify the results of this paper. Subsequent papers will contribute by building a base of data information about the specifications and characteristics of CC variables in Oman, allow researchers to benefit from these results in their future research, and facilitate their various applications on CC. In addition, it is an attempt to reduce the existing gap in studies of the properties and characteristics of climate variables in Oman.
It is worth noting that the results of this paper call for an action plan that requires adaptation to existing changes in humidity and its high levels as one of the CC variables and will continue following-up of CC indicators. In addition, the plan should include and address this urgent need and contain mitigatory actions to extreme changes.
Regarding the limitations, it is known that the CC is an integrated phenomenon, and the analysis of CC data should be an integrated analysis. In order to give a very accurate opinion, it must be based on the integration of the results of the analysis of all CC variables for Oman (humidity, temperature, precipitation, wind patterns, …) and this in itself is a very difficult task. In addition, the relationship between humidity and other climate factors, such as temperature, precipitation, and wind patterns, is very complicated and calls for sophisticated multivariate analysis methods. In the final analysis, it is not possible to include all the results related to CC in one research or study. We aspire to conduct a comprehensive analysis of all CC variables in Oman later.
The relationship between humidity and other CC factors, such as temperature, precipitation, and wind patterns, is a complicated feature and should be considered for future research direction. In addition, the multivariate analysis methods would be a possible technique to be applied to this problem.
There are many important practical problems in terms of the environment of the society that is related to humidity, which unfortunately has not been focused properly on in all developing countries, including Oman. Some of these include the following: “concrete structures,”“building cracks,”“tile deterioration,” etc. Thus, the second future research direction of CC is to be focused on studying the relations between the environmental problems of the society as given above and humidity.
Footnotes
Acknowledgements
The authors are thankful to University of Nizwa for funding this project, Mr. Francis Andrew, Polyglot Institute, Ibri, Oman, for proofreading the paper, the editor and the two anonymous referees for valuable suggestions that helped to improve this paper.
Author Note
All authors listed have made a substantial, direct, and intellectual contribution to the work and approved it for publication.
Ethical Considerations
This article does not contain any studies with human participants or animals performed by any of the authors.
Funding
The authors disclosed receipt of the following financial support for the research, authorship, and/or publication of this article: This project was partially supported by the University of Nizwa, Oman.
Declaration of Conflicting Interests
The authors declared no potential conflicts of interest with respect to the research, authorship, and/or publication of this article.