
Abstract
This study examines external debt threshold levels in a huge sample of developing world during the years 1991 to 2020. Methodologically, dynamic panel threshold model is employed for digging out the endogeneity problem. Using yearly data, we confirm the general consensus that external debt negatively affects output growth when it reaches or is above certain threshold level. In particular, we find total external debt threshold at 90% and long-term external debt threshold at 50.53%, respectively. Furthermore, we find that external debt thresholds evolve over each decade; 1991 to 2000; 2001 to 2010 and 2011 to 2020, respectively. One notable finding is that total external debt threshold levels have declined over the three decades from as high as 92% in 1990s to 54.6% during 2001 to 2010 and 47.8% during 2011 to 2020. Similarly, the long-term threshold levels declined from as high as 83% in 1990s to 23.6% during 2001 to 2010, although it increased slightly to 27% during 2011 to 2020, respectively. To prudent public debt management, our findings suggest fundamental policies for developing countries.
Introduction
The upsurge in public debt ratios over the last several decades and recently in the consequences of the global financial crisis (GFC) have reignited the debate among policymakers and academicians about future repercussions in terms of their effects on macroeconomic stability across advanced economies (AEs) and emerging, developing and low-income economies, respectively. In its recent report, the International Monetary Fund (2022) statistics show that global debt stock has reached to approximately 97% of GDP and this ratio is expected to rise further over the years. The effects of external debt on output growth of DEs, however, depend on their debt composition, maturity and their overall fiscal positions (and developmental needs). Furthermore, whilst DEs continue to rely on external financing to meet domestic developmental needs and achieve sustained output growth over the years, the risk of vulnerabilities in terms of volatile exchange rates, low gross capital formation and reduction in domestic savings are expected to persist over the years (United Nations Development Programme, 2021).
External debt utilized efficiently and in productive activities can be growth enhancing for the economies; however, the effects vary over the short-term and long-term periods, respectively. For instance, previous studies indicate that the growth effects of external debt ratios are positive and accelerating growth in the short-term while in the long-term growth is squeezing due to persistent increase debt services cost and deterioration in trade balance (Hakobyan & Marcelino, 2014; Wanniarachchi, 2020). Venuganan et al. (2017) point that growth is negatively affected by external debt in the long-term due to weak fiscal position, rising global interest rates and low domestic savings. Qureshi and Liaqat (2020) attribute the divergent effects of external debt, over the short-term and long-term, on output growth to external debt composition, institutional quality and weak fiscal positions.
On the other hand, another strand of empirical studies focuses on optimality and nonlinear effects of external debt ratios. The main argument of this strand is that public debt affects economic growth negatively after a certain threshold level. For instance, Reinhart and Rogoff (2010) find that growth is negatively affected when debt threshold is above 90% of GDP. Asteriou et al. (2021) find that spending external debt optimally will result in optimal output growth and that the cost of securing external financing is offset by higher output growth and prudent fiscal consolidations. Tran (2018) finds debt threshold between 40% and 55% of GDP for emerging economies. Lau et al. (2022) find 30% to 90% public debt threshold in a sample of 16 Asian economies.
Given the past scant and yet inconclusive evidence on the threshold effects of public debt ratios on output growth, we, in this study aim to examine threshold effects of external debt in a large sample of developing countries, for the time period of 1991 to 2022 by using dynamic panel threshold model. Our study is different in several respects and complement the past empirical literature in several ways. First, since past studies find homogenous threshold effects of public debt on output growth of different countries’ samples, we contrarily focus on overall sample of 86 developing countries to test the threshold effects of external debt on output growth for the years 1991 to 2022. Second, unlike the past empirical research, we examine how threshold effects evolved each sampled decade. This is a very strong and relevant empirical question in the present context of rising external debt ratios across developing countries which so far is unanswered in the previous studies. Finally, we not only rely on total external debt ratios as can be found in previous studies and, therefore, also focus on threshold effects of long-term external debt ratio on output growth of the developing countries. We note that none of the previous studies, to our best knowledge, have tested the threshold effects of both the long-term external debt and total external debt ratios, respectively, both collectively and over separate decades.
We find that further external debt above 90% of GDP and around 50.5% reduces output growth by around 0.02% to 0.03% and by 0.025% 0.027%, respectively. Chudik et al. (2017) indicate the negative effects on output growth of public debt between 0.03% and 0.15% in AEs and emerging economies. Heterogeneities in threshold effects supports the widely held argument that developing countries are experiencing debt distress and increased vulnerabilities over the last decades and that the declining threshold levels over each decade shall be a cause of concern for developing countries (A. Kose et al., 2021; Shah et al., 2024).
The remaining parts of the study is organized as; following section discusses past literature about threshold effects of external debt on output growth. Section III discusses data, econometric specification and summary of the statistics. Section IV highlights the empirical results and tests for robustness check. Conclusion, policy recommendation and future research direction are presented in the last section of the study.
Literature Review
A vast amount of empirical literature has investigated threshold effects of public debt on output growth, arguing that threshold effects differ across samples of AEs, emerging and developing economies, respectively (Elbadawi et al., 1997; Imbs & Rancière, 2005; Reinhart & Rogoff, 2010). The differences in threshold levels and effects are in the previous literature attributed to different samples being used; different econometric and statistical techniques employed and due to differences in time periods being analyzed. Elbadawi et al. (1997), using quadratic model with fixed and random effects, examine threshold levels in 99 developing countries and find that the negative effects of public debt start beyond threshold levels of 97%. Imbs and Rancière (2005), employing, regression kink model, find public debt threshold levels between 55% and 60% in case of 87 developing countries. Reinhart and Rogoff (2010) find that the weak effects of public debt in emerging and developing countries starts already from 50% to 60% of GDP.
Checherita-Westphal and Rother (2012) find the turning point in the ranges between 90% and 100% of GDP for 12 European economies. Baum et al. (2013), using dynamic panel threshold model, examine nonlinearity in debt-growth relationship on a sample of 13 Euro area economies and reports public debt hinders output growth of Euro area economies beyond threshold levels of 67% to 95%. Égert (2015) investigated threshold effects of public debt in 20 AEs, using nonlinear threshold model, and finds that threshold effects are sensitive to modelling choice and data coverage. The study indicates that threshold level is as low as 20% and as high as 60% in the sampled economies. Chang and Chiang (2009) examined nonlinear effects of public debt on output growth in 15 OECD economies over the years 1990 to 2004. The study indicates public debt below threshold levels of 32%, turns weak until reaching 66% of GDP and turns negative above it. Using Reinhart and Rogoff dataset for a group of 44 emerging economies, Minea and Parent (2012) find debt threshold between 90% and 115% of GDP.
One key finding in the previous literature is that threshold levels are broadly lower in case of developing countries. The lower threshold levels are imputed largely to their vulnerabilities to external shocks, low institutional quality, inefficient utilization of external debt and differences in their economic and fiscal priorities (Kumar & Woo, 2010; Lau et al., 2022). Caner et al. (2010) examined threshold levels across AEs and developing economies and find threshold levels around 77% and 64% for AEs and developing economies, respectively. The negative effects, however, on output growth are more pronounced in developing countries – a 0.02% less growth with each additional 1% increase in public debt ratio, than AEs – 0.017% less output growth with a 1% increase in public debt ratio. Chudik et al. (2017), using panel ARDL approach, finds debt threshold at around 80% for AEs and 60% for emerging economies. Mencinger et al. (2014) indicate that there is wide difference between threshold effects of public debt in AEs and developing economies. For instance, the study shows public debt threshold level at 90% in AEs and 45% of GDP in developing countries.
Zaghdoudi (2020) examined public debt threshold for middle-income and low-income developing economies. Using dynamic panel threshold model, the findings report threshold at around 15% beyond which external debt starts hindering output growth of the sampled economies. In case of 18 OECD economies, Cecchetti et al. (2011) find threshold effects below 85% of GDP as weak but negative and growth-retarding above it. For the upper middle-income economies and low-income economies, Kassouri et al. (2020) indicate that the negative threshold effects of public debt are stronger in low-income economies – at 25.1% of GDP, than upper-income economies – 50% of GDP, respectively.
Lau et al. (2022) tests threshold effects of external debt in developing countries of Asia for the time period 1980 to 2016 elaborated that threshold levels ranging from 30% to 90% over the sampled years. For a group of selected Sub Sahara African economies, Sandow et al. (2022), employing panel smooth transition regression (PSTR), show threshold levels at 45% of GDP over the years 2005 to 2017. Cordella et al. (2005) use spline function threshold model for examining the nonlinear correlation of public debt and output growth of non- HIPC (Heavily Indebted Poor Countries) countries. The empirical results report threshold at around 20%; however, improvement in institutional quality enhances threshold level to 15% to 30% over the long-term. In another study on African economies, using panel ARDL model, Mensah et al. (2019) find public debt starts hindering output growth above the threshold levels of 20% to 80%.
Methodology and Summary Statistics
Summary Statistics
In order to estimate threshold effects of external debt ratios, a panel dataset of 86 developing countries for the time period 1991 to 2022 is used. Our main variables for the purpose are total external debt (percent of GDP), long-term external debt (%percent of GDP), annual growth rate of GDP per capita, trade (percent of GDP), gross capital formation (percent of GDP) and gross domestic savings (percent of GDP). We use a crisis dummy for the years 2007 to 2009 GFC where 1 means period of crisis and 0 otherwise. The variables, source and definitions are provided in Table 1.
Variables, Definition, Sources and Summary Statistics.

The mean value of output growth is around 1.6% with minimum and maximum values of −47.5% and 43.4%, respectively. The mean values of long term and total external debt are 48 and 40.9, respectively. We note that the average trade as percent of GDP is around 68.4% with minimum and maximum values of around 0.78% and 181.6%, respectively. The mean value of gross capital formation is 23.3% and the mean value of domestic savings is 15.5%.
Methodology
Dynamic panel threshold effects model (DPTR) suggested by Kremer et al. (2013) is used for the purpose of finding out the threshold effects of external debt on output growth. The authors made two extensions to the original model; first static model of Hansen (1999) has been extended to include endogenous regressors with lags of the dependent variables and, second, for allowing the endogeneity in a dynamic panel setting, model is designed for panel framework with GMM type estimators. The model is specified as;

where,
One main problem as Kremer et al. (2013) identify is to remove the country-fixed effects but without disrupting the fundamental distributional assumptions of the original model. Conversely, unlike in non-dynamic panel models wherein the individual effects are removed with mean differencing, which causes inconsistent estimates as mean of individual error, the transformed individual error and lagged dependent variable are always correlated (Arellano, 2003; Baum et al., 2013). To tackle such problem, Kremer et al. (2013) suggest forward orthogonal deviation as proposed by Arellano and Bover (1995) in order to remove the fixed effects and avoid the problem of facing serial correlation in the transformed error term. In order to make sure that the original theory of Hansen’s (1999) static threshold model is also logical in the dynamic panel context, this mechanism is applied.
The dynamic panel threshold model takes the following form in our panel data context;
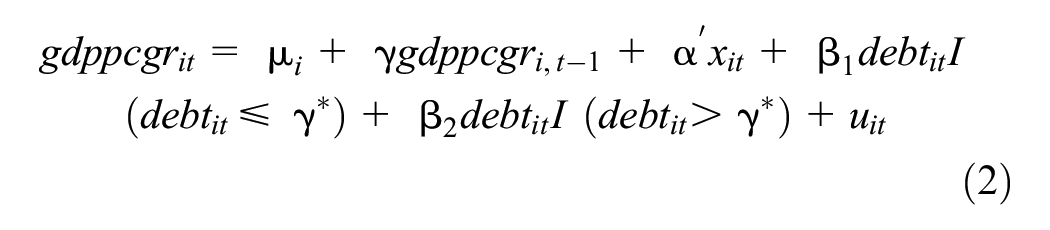
where
In the start of the analysis, we run a reduced form regression on a set of instruments by the endogenous regressor. For this purpose, higher lags of endogenous variables are taken as instruments which are then replaced with their predicted values

where,

where, the threshold residual variance
Empirical Results
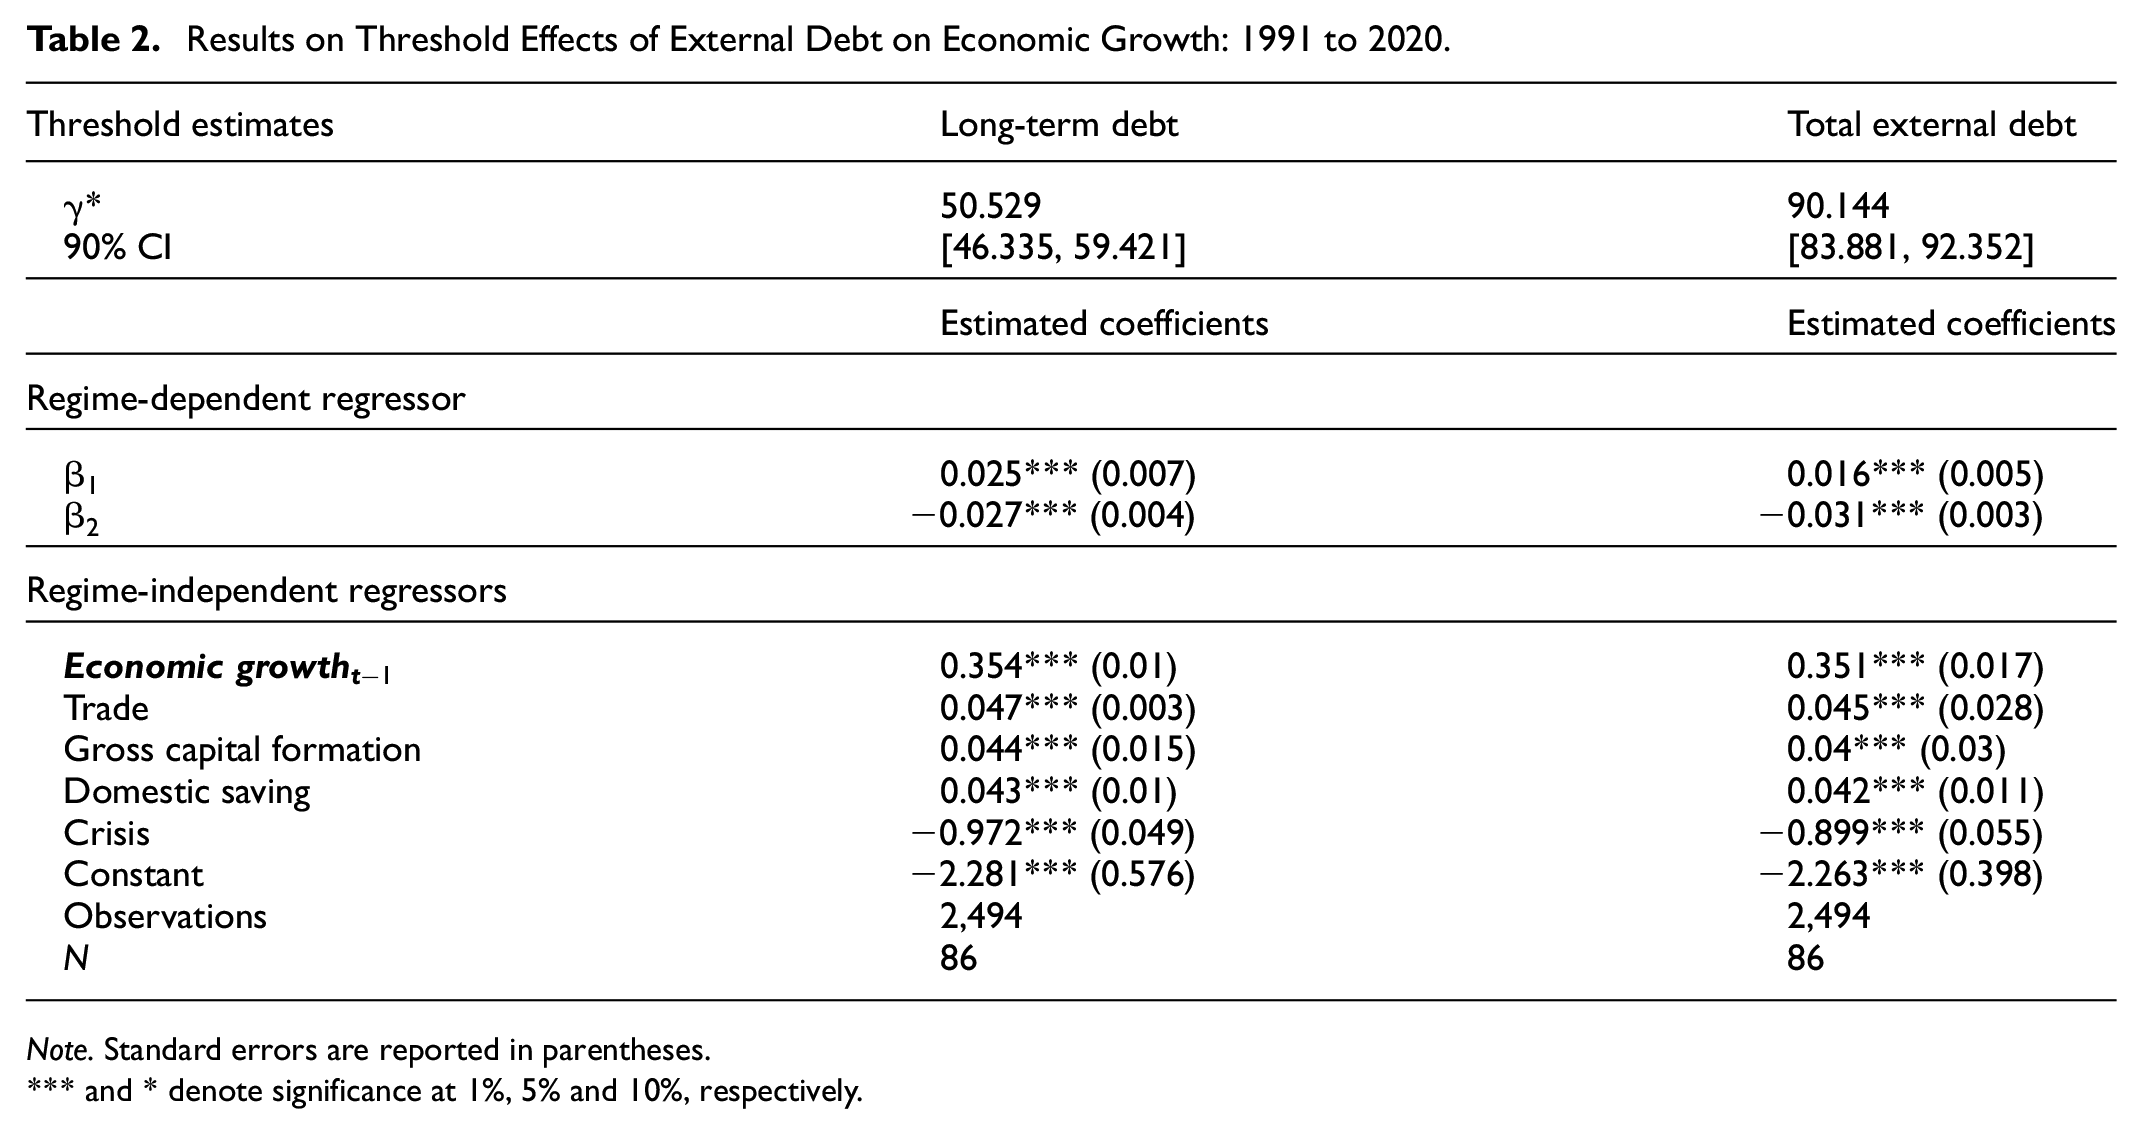
The empirical estimates of the threshold effects of external debt (total and long-term) on output growth are reported in Table 2. The first part of the Table 2 reports threshold estimates, γ*, with 90% confidence interval followed by the marginal effects of the regime-dependent regressors,
Results on Threshold Effects of External Debt on Economic Growth: 1991 to 2020.
Note. Standard errors are reported in parentheses.
and * denote significance at 1%, 5% and 10%, respectively.
In terms of contractionary effects on output growth beyond threshold level, our findings support the previous studies. For instance, Ndoricimpa (2020) find contraction of output growth by around 0.01% to 0.02% beyond certain threshold level in case of African economies. Gómez-Puig et al. (2022) find the contractionary effects between 0.01% and 0.027% for a large sample of developing countries. Finally, we find that debt threshold when above certain threshold not only hinders output growth, also results in deterioration of trade balance, low capital formation in terms of low capital accumulation and decline in domestic savings (de Soyres et al., 2022; Qureshi and Liaqat, 2020). The threshold levels are lower for developing countries than AEs because they have different income levels, institutional development and quality, different fiscal positions, different degrees of trade openness and have different economic and fiscal priorities.
Threshold Effects Over the Decades
One advantage of our study over the previous literature is that we, besides estimating a homogenous threshold level for all sampled countries, also estimate threshold levels and their effects on output growth over the three sampled decades; 1991 to 2000; 2001 to 2010; 2011 to 2020, in order to ascertain the evolution of threshold levels over the past decades. This offers us a unique edge and opportunity which is largely missing in the previous literature to investigate how threshold level evolved over the past decades.
Table 3 reports empirical estimates of the threshold level during 1991 to 2000 period along with control variables impact on output growth. We find threshold level of total external debt as 92% and that of long-term external debt as 83%, respectively. In the former case, we note that external debt below threshold level positively affects output growth; however, it hinders it beyond 92% debt threshold. In other words, output growth during the decade declines by around 0.045% with each additional percent increase in external debt above the threshold level. While, in the latter case, external debt retards output growth by around 0.04% above the threshold level of around 83% over the decade. The impact of gross capital formation, trade and domestic savings is found positive on the output growth. The variables are statistically significant at their conventional levels except gross capital formation which is statistically insignificant in the long-term external debt model.
Threshold Effects During Decades: 1991 to 2000.

Note. Standard errors are reported in parentheses.
and * denote significance at 1%, 5% and 10%, respectively.
Table 4 reports threshold estimates for the decade 2001 to 2010. This period of time is also marked as the decade of GFC that hit not only AEs, the spillover from the crisis were experienced across developing countries. We make two key observations from table 4. First, we find that the threshold levels have reduced significantly during the decade. For instance, total external debt threshold reduced from 92% in 1990s to approximately 54.6% and long-term external debt threshold declined from a high of 83% in 1990s to around 23.6% in 2000s. Second, the decline in threshold levels can also be interpreted as increase in vulnerabilities across developing countries due to the GFC effects. The marginal effects indicate that the output growth tends to reduce by around 0.014% and 0.047% with each additional 1% increase in external debt beyond threshold levels of 23.6% and 54.6%, respectively, over the decade.
Threshold Effects During Decades: 2001 to 2010.

Note. Standard errors are reported in parentheses.
and * denote significance at 1%, 5% and 10%, respectively.
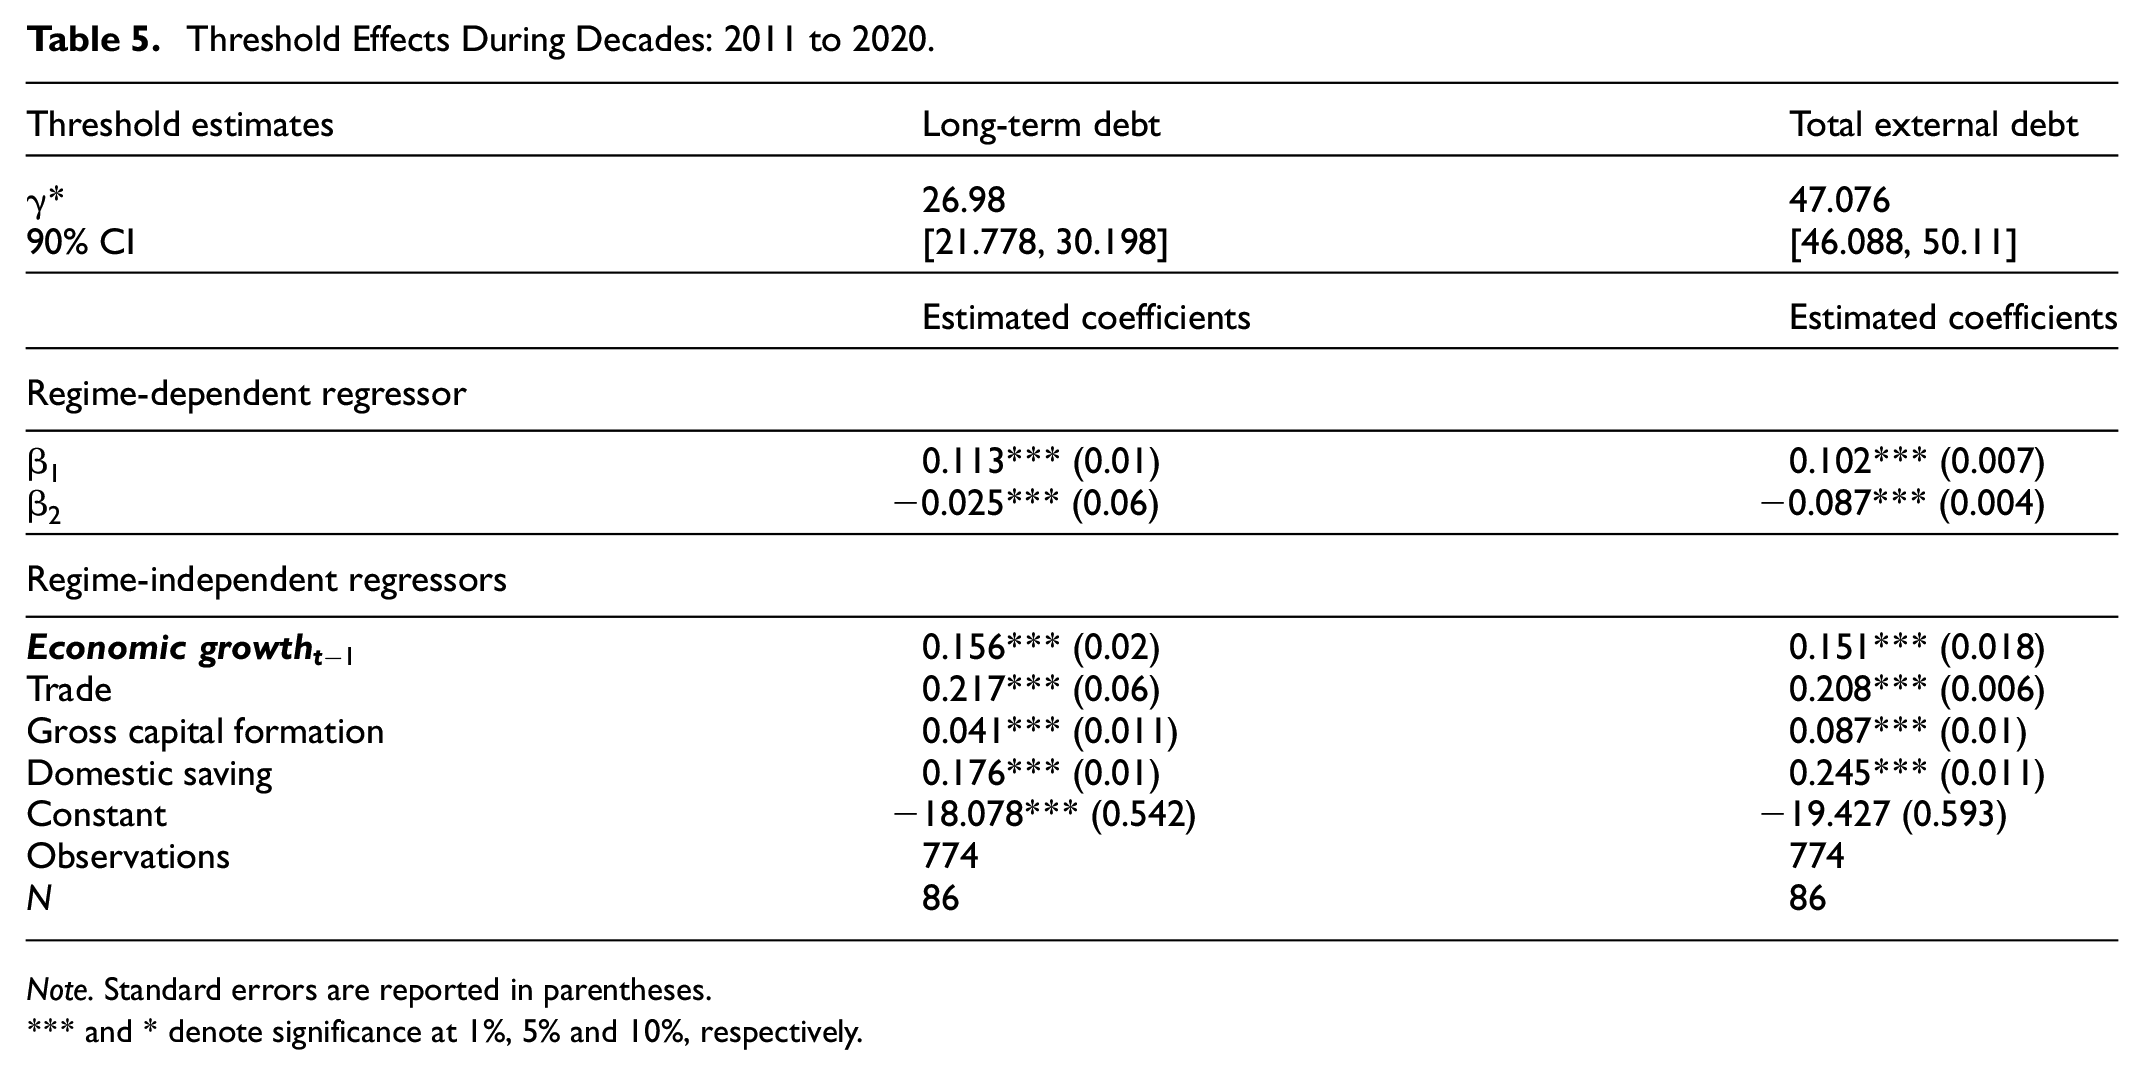
Following the same estimation process, Table 5 reports threshold estimates over the period 2011 to 2020. We find that threshold level of total external debt deteriorated further in the aftermath of the GFC and over the decade 2011 to 2020 which supports the recent findings by M. A. Kose et al. (2022) that developing countries’ vulnerabilities to debt distress are rising which poses significant challenges for the developing countries to avert a debt distress episode. However, we observe that threshold level of long-term external debt slightly improved over the decade 2011 to 2020. This is attributed to measures taken by developing countries in the aftermath of the GFC in terms of implementing fiscal consolidations, enhancing trade balance, accumulation of capital and increase in domestic savings (Ha et al., 2019; Heimberger, 2021; Sheng & Sukaj, 2021). In particular, the output growth over the decade declines by around 0.087% with an additional 1% increase in external debt beyond threshold level of around 47.8% and by around 0.025% when threshold level of long-term external debt is above around 27%, respectively.
Threshold Effects During Decades: 2011 to 2020.
Note. Standard errors are reported in parentheses.
and * denote significance at 1%, 5% and 10%, respectively.
To summarized the results, control variables; trade, gross capital formation and domestic savings, positively influence long-term output growth and over each decade, the threshold levels of long-term external and total external debts have strong impact. For instance, in the previous literature public debt above threshold levels negatively influence output growth of AEs, emerging and developing economies. However, we as further evidence on threshold effects of public debt find that they evolve over the years and decades. This is very strong result in terms of contriving and implementing policies for controlling external debt ratios within certain limits and ensuring sustained output growth over the years. We, therefore, infer that as long as debt threshold levels evolve over the years and decades so does their effects on output growth over the sampled years.
Robustness Check
In order to ensure that the baseline threshold estimates remain robust, we make two alterations; first, we add further controls and, second, we replace our measure of economic growth. We choose two further control variables such as inflation rate and current account balance. We replace our economic growth measure with annual growth rate of GDP of the developing countries. Ibarra and Trupkin (2016) show that the inclusion of control variable is another way of testing the baseline results as it provides further evidence on whether the baseline estimates hold to the alternate expanded model. We include inflation and current account balance, following previous literature, in the robustness check exercise in order to examine if the baseline results are altered. Inflation is an important variable in influencing output growth when debt ratios are higher and above certain threshold level (Kremer et al., 2013). Similarly, most of the developing countries incur external debt in order to support their balance of payments and avert external shock (Henri, 2019).
Table 6 shows that there is broadly no change seen in threshold estimates of the external debt irrespective of whether we change dependent variable or add further control variables. The coefficients of the estimates are comparable to the baseline estimates except gross capital formation which becomes statistically insignificant in the long-term external debt model. All variables are statistically significant at their conventional levels. Inflation negatively affects output growth in both models whereas current account balance positively affects output growth.
Results on Threshold Effects of External Debt on Economic Growth.

Note. Standard errors are reported in parentheses.
, ** and * denote significance at 1%, 5% and 10%, respectively.
In addition, the dynamic panel threshold model with annual GDP growth rate is used to control the endogeneity. We instrument the first lag of our growth variable with higher lags and find that the estimates of threshold are same and unaltered. We find that changing the endogenous variable has no influence on threshold estimates in the baseline model; that is, the threshold values tend to remain same at 90.144% and 50.529% over the sampled years. Differences in result can arise due to different methodological approaches, different countries samples, differences in institutional quality and different time samples (Reinhart & Rogoff, 2010).
Conclusion
This study provided a new empirical evidence and complement the previous literature on threshold effects of external debt on output growth of developing countries. The study performs the analysis in three different ways. First, the threshold levels and effects of total external debt are estimated for the entire sample of developing countries. Second, as a complement to the existing empirical literature on threshold levels, this study estimates threshold level and effects of long-term external debt on output growth of developing countries over the last three decades. Finally, to extend further the empirical literature, this study estimates threshold levels over each of the three decades; 1991 to 2000; 2001 to 2010; 2011 to 2020, respectively, in order to ascertain how threshold levels of total external debt and long-term external debt evolve over each of the sampled decade. Methodologically, dynamic panel model is applied for examining endogeneity problem in the model.
Confirming the general consensus and in line with previous literature, we do find that external debt hinders output growth when it reaches or is above certain threshold level; however, threshold levels and effects vary across total external debt, long-term external debt and over each decade. In particular, we do find that external debt thresholds vary over each decade because the nature and ratios of external debt vary during each period of time. Specifically, we find the general threshold levels for the entire sample of developing countries as approximately 90% (total external debt) and 50.53% (long-term external debt); that is, external debt tends to negatively influence the long-run output growth beyond the estimated threshold levels. Furthermore, we find threshold levels evolved over each decade. One notable finding, in other words, is threshold levels have generally declined over the sampled three decades. For instance, total external debt threshold declined from as high as 92% of GDP in 1990s to 54.6 during 2001 to 2010 to 47.8% of GDP during 2011 to 2020, respectively. Similarly, long-term external debt threshold declined from as high as 83% in 1990s to 23.6% during 2001 to 2010, although it slightly improved to 27% during 2011 to 2020, respectively. This manifests that vulnerabilities in developing countries are mounting which has significant negative effects on their long-term output growth. On the effects of control variables, we find that trade, gross capital formation and domestic savings, being statistically significant, tend to positively affect output growth of developing economies. Addition of further control variables; inflation and current account balance, and replacing the measure of economic growth do not change the baseline results.
We understand that depending only on overall threshold levels, as do previous studies, to draw conclusion on implications of threshold levels of public debt might not be as informative as examined during each decade because it helps us in finding more precise estimates and informs us how external debt thresholds evolve during each decade. We suggest that prudent public debt management, especially external debt which is vulnerable to external shocks along with prioritization given to capital accumulation, trade openness, encouraging domestic savings and ensuring sustained output growth can reduce the negative impact of external debt on output growth. Measures to contain inflation and improvement in current account balance are added benefits to avert the negative influence of external debt on output growth in developing countries. We, therefore, believe that the role of fiscal policy, exchange rate pass-through and trade balance are potential areas for extending the present study and taking the research in the new direction.
Footnotes
Funding
The author(s) received no financial support for the research, authorship, and/or publication of this article.
Declaration of Conflicting Interests
The author(s) declared no potential conflicts of interest with respect to the research, authorship, and/or publication of this article.
Data Availability Statement
The data can be accessed from the authors upon reasonable request.