
Abstract
Understanding the various touchpoints of interaction throughout the journey of young tourists on cruises, in light of their evolving travel behavior, is crucial for improving travel planning. However, previous studies have often overemphasized specific service touchpoints, overlooking their connections within the broader journey context. To improve satisfaction measurement, this study introduces a new evaluation system, the “Quad + SICAS” touchpoints model, which incorporates: (1) phases: travel planning and decision-making; (2) channels: social media or traditional channels; and (3) touchpoint controllers: the firm or the tourist side. An in-depth evaluation of the cruise journey experience, involving 25 identified touchpoints with 301 young tourists, was conducted. Exploratory Factor Analysis (EFA) and Confirmatory Factor Analysis (CFA) revealed a strong fit for an evaluation index system composed of 23 touchpoints. Structural Equation Modeling (SEM) further demonstrated the significant impact of four types of touchpoints, including social media, traditional channels controlled by either the firm or the tourist, on overall satisfaction. Using this diverse evaluation framework, tailored recommendations for enhancing satisfaction among young cruise tourists can be developed, taking into account the varying nature of touchpoints across different cruise lines. These findings suggest that the “Quad + SICAS” touchpoints model can be effectively applied in marketing strategies within cruise tourism.
Plain language summary
Understanding how young tourists interact with service providers through various touchpoints during cruiser journey is crucial for improving travel plans. This study introduces the “Quad + SICAS” model, considering phases, channels, and touchpoint controllers. It evaluated 25 touchpoints with 301 young tourists, finding significant impacts on satisfaction. The model could enhance satisfaction evaluation across different cruise lines, benefiting marketing strategies.
Introduction
Cruise tourism has been one of the fastest-growing sectors in the tourism industry over the past decade. By 2017, China became the world’s second largest source market for cruises, behind North America, with 2.39 million departures (Lin et al., 2022; Sun et al., 2019). The rapid growth of the affluent middle class has contributed to a significant increase in outbound tourists, driving China’s cruise market from a phase of rapid expansion to one focused on high-quality development (Wang et al., 2019). Therefore, it is crucial to understand the changes occurring in the cruise market to enhance the development of China’s cruise industry. China’s cruise industry is undergoing a transformation, affecting not only the needs of tourists but also the service providers (Chen et al., 2020). On the tourist side, a growing number of young people are entering the cruise market, bringing with them new purchasing behaviors and travel patterns that require thorough investigation (Lau et al., 2022; Mohamed et al., 2010). On the firm side, the increasing use of new channels by cruise service providers has expanded the range of services offered, while diversifying the touchpoints for “tourist-firm” interactions (Verhoef et al., 2015). The challenge for cruise market practitioners now lies in updating their services to attract more young people and managing the new channels of “tourist-firm” interaction effectively.
Young people want memorable travel experiences that enrich them and actively involve them in both planning and experiencing destinations. They aim to become co-creators of the value in their travel experiences. As a result, social media plays a key role, with young people using it to gather information about destinations and to plan their trips during the early stages of their journey (Setiawan et al., 2018). For example, mobile social applications are becoming increasingly important roles for hoteliers, as they allow young tourists to obtain travel-related information earlier in their planning process, thereby establishing a more active connection with service providers. The importance of the young market segment lies not only in its growing size but also in its role as the market of the future (Vukic et al., 2015). The urgency of targeting this segment is further highlighted by its significant influence on the decisions of other generations, with family cruise vacations expected to have a promising future according to previous studies (Schänzel et al., 2012; Sieler, 2017). Therefore, understanding young people’s experiences with service providers is crucial for the future development of cruise services in the market.
Recent research has widely explored the direct role of social media in connecting young tourists with cruise companies, particularly from the firm’s perspective. For instance, some scholars have evaluated the impact of user-generated content (UGC) as tourist’s co-creator of travel experience, as well as the influence of electronic word-of-mouth (e-WOM) on tourists during their pre-purchase phase (Cheong & Mohammed-Baksh, 2021). Hu and Olivieri (2021) tried to examine how touchpoints in social media are managed within the marketing strategies of hospitality firms, considering the customer journey of tourists (Hu & Olivieri, 2021). Due to the convenience of new channels such as social media, research on travel services has shifted from traditional to online platforms (Talwar et al., 2020). However, the role of social media in shaping young tourists’ experiences has often been overstated. Previous studies also highlight that segmenting touchpoints from various perspectives and dividing the customer journey have become central issues in the field of travel experience assessment.
Satisfaction is seen as the degree to which expectations are fulfilled, and it is also influenced by perceptions of the experience. It can be quantified by first measuring expectations and then assessing perceptions of the customer experience (Mcdowall et al., 2010). In the context of tourist satisfaction assessment, touchpoints have been identified as key influencing factors in several studies. Many scholars have focused on specific types of touchpoints and their effects on young tourists’ satisfaction (Ieva & Ziliani, 2018; Stein & Ramaseshan, 2016), or have concentrated on particular phases of the customer journey, such as the decision-making and purchase processes, to explore how touchpoints influence tourists’ behavioral intentions (Dhebar, 2013; Manser Payne et al., 2017). While these studies provide valuable insights into the factors affecting satisfaction in greater detail, few have examined the interaction between social media and traditional channels in shaping tourists’ experiences. In reality, satisfaction is closely tied to the evolving dynamics of tourist experiences and the interactions between tourists and service providers. Different types of touchpoints occur at various stages of the customer journey and play distinct roles, so analyzing their impact on tourist satisfaction requires a systematic and dynamic approach.
This study proposed the “Quad + SICAS” touchpoint model by composing the newest classification of service touchpoints and consumer behavior (SICAS) model, it represents a theoretically contribution to understand the new travel pattern of young people by classifying the touchpoints. Practically, the new satisfaction index system developed through the data analysis in this study offers a fresh scale for measuring satisfaction, considering the phases, controllers, and channels of touchpoints. This system will be seen as an innovation in cruise practices and related service sectors. The specific objectives of this study are (1) to provide a more systematic and diverse approach to measure young tourists’ satisfaction for service providers, offering valuable insights for cruise lines aiming to improve their service and (2) to understand how different touchpoints function during the cruise journey of young tourists, helping service planners and developers better understand the specific impacts of various touchpoint types on overall satisfaction. In summary, this study introduces a new satisfaction index system for evaluating young tourists, specifically tailored for the cruise tourism sector.
Literature Review
New Travel Patterns of Young Tourists
The United Nations World Tourism Organization (UNWTO) has pointed out that the traditional age range for the young tourists market has shifted to 15 to 30+, with young people now considered cruise travel (Monaco, 2018) and experience-seekers (Morgan & Xu, 2009). Contemporary academic literature indicates that Millennials, born between the early 1980s and 2000s (Delbosc et al., 2017), exhibit different travel patterns from previous generations and have significant influence on the older segment (Veiga et al., 2017). Studies from China also show that young adults play a key role in shaping travel decisions, particularly when travelling with their families (Jia et al., 2023). Young travelers increasingly look experiences where they can actively participate in creating their own tourism experiences (Sigala, 2016). Additionally, they are eager to share their journey experiences on social media, creating a lasting impact on others (Islam, 2021; Zhou et al., 2023). This new travel behavior is characterized by the integration of digital channels for cruise services, allowing young people to engage in “tourist-firm” interaction early on, enabling them align their needs before making a purchase.
Role of Service Touchpoints
Touchpoints, originally a concept from marketing, are used to describe the moments of interaction between service providers and customers (Homburg et al., 2017). Young tourists are seen as active participants in the value co-creation of tourism services, engaging with suppliers to enhance their experience (Cova & Salle, 2008). Many service providers have recognized the importance of social media in reaching potential young travelers (Chen et al., 2021), leading cruise companies to shift their offerings from tangible services to intangible ones, and from traditional channels to multichannel approaches (Jászberényi & Miskolczi, 2020). For instance, mobile social applications play a role throughout the entire purchase-decision process, as tourists rely on them to compare options and book their trips (Ana & Istudor, 2019; Chavez et al., 2020). These interactive touchpoints are often managed by cruise companies to provide personalized services related to itineraries, rooms, accommodations, destinations, and onboard activities (Jászberényi & Miskolczi, 2020). However, it has been proved that not all touchpoints within social media are under the control of cruise lines (Hu & Olivieri, 2021). For instance, personal TikTok accounts controlled by tourists themselves can significantly influence their hotel choices (Varkaris & Neuhofer, 2017), purchase decisions, and serve as key platforms for sharing experiences (Mangold & Faulds, 2009). Social media is highly valued by young people due to the opportunity for electronic word-of-mouth (e-WOM) reviews (Yu et al., 2013), and user-generated contents (UGC) is regarded as more authentic, thus offering higher reference value (Campos et al., 2018). These new touchpoints in social media are studied as complementary to traditional channels for “tourist-firm” interaction across various stages of the customer journey.
Although some scholars have overemphasized the role of social media, traditional channels remain essential touchpoints for travelers to experience cruising, including onboard activities. Therefore, cruise services are still delivered through touchpoints in both social media and traditional channels, with varying degrees of control by tourists or service providers. A quadrant diagram, as shown in Figure 1, can illustrate these new and traditional touchpoints. The diagram categorizes touchpoints based on their respective channels (social media or traditional), and their controllers (tourist or firm). Social media firm-controlled touchpoints (SFC), such as official blogs, are positioned in the first quadrant, while social media tourist-controlled touchpoints (STC), such as personal accounts on WeChat, and traditional channel firm-controlled touchpoints (TFC), like online travel agencies (OTAs), are placed in other quadrants. Traditional channel tourist-controlled touchpoints (TTC), such as face-to-face (F2F) sharing, are also included in the diagram. This categorization of service touchpoints provides a foundation for analyzing the distinct roles played by each type in cruise travel. The findings can offer practical guidance for service providers, especially regarding social media touchpoints, to better serve young travelers.
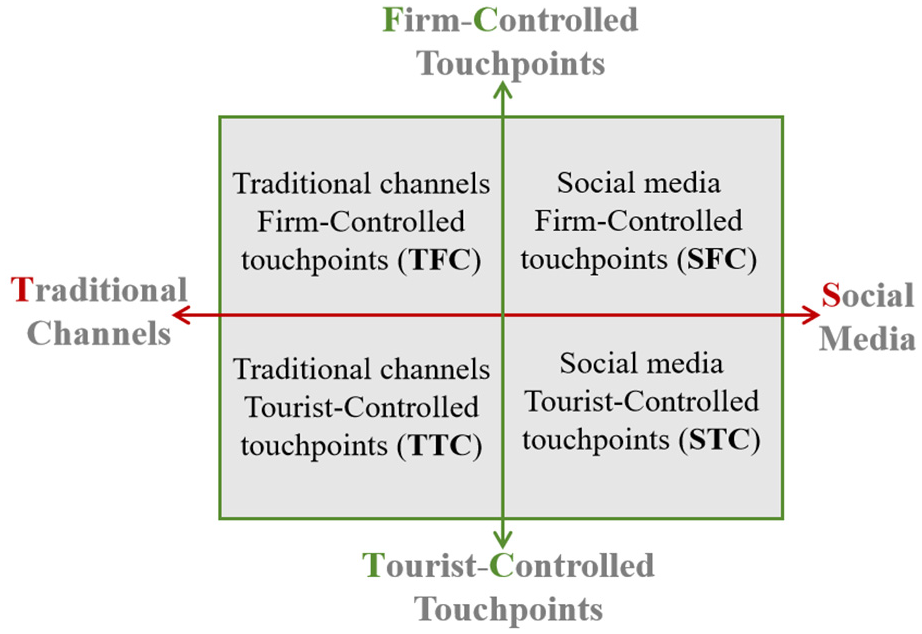
Quadrant diagram of cruise service touchpoints classification.
Satisfaction Measurement in Cruise Tourism
According to the “expectation-perception” theory proposed by Parasuraman et al. (1985), tourist satisfaction arises from the gap between their expectations and actual perceptions throughout the process, which can be tracked over time. Thus, the overall satisfaction of visitors is the sum of the differences between their actual perceptions and expectations for each node. This can be expressed in Equation (1): “SQ” refers to overall satisfaction, which can also be defined as perceived service quality; “Pi” refers to score of the i-th index in terms of customer perception; “Ei” refers to score of the i-th index in terms of customer expectation; and the “n” refers to the total number of indexes in the evaluation system.

Since Sweden introduced the first consumer satisfaction index (SWICS) in 1989, many other countries have followed suit by developing their own consumer satisfaction indexes tailored to their specific characteristics, including the United States (ACSI), Europe (ECSI), and China (CCSI). Due to its significant economic impact, the consumer satisfaction index has been applied across various service industries such as healthcare, hospitality, education, and tourism (Bertaccini et al., 2021; Deng et al., 2013). In the tourism industry, previous studies have focused on specific indexes related to accommodation, food and beverage, attractions, facilities, activity organization, perceived value, and perceived services (Saayman et al., 2018). Different indexes have emerged for various segments within the tourism industry, such as the effectiveness and authenticity of information in online travel agencies (OTAs; Tang & Zeng, 2021), and factors like cruise ships, entertainment, and distance in cruise tourism (Arasli et al., 2020). The indexes used to gauge tourists’ satisfaction must be practical to measure and align with the characteristics of the research subject (e.g., industry, product, or respondent). Therefore, this study proposes a new index system designed to address the evolving dynamics of the cruise market today, focusing on the characteristics of the touchpoints involved.
Phase Division on Customer Journey for Satisfaction Detailed Measurement
Lemon and Verhoef (2016) defined the customer journey the evolving experience a customer has with a company over time. Building on this concept, this study introduces the “cruise journey” as the dynamic and changing experience of a cruiser interacting with cruise service providers throughout their journey. Similar to the customer journey, the cruise journey can be divided into three main phases: pre-purchase, purchase, and post-purchase (Lemon & Verhoef, 2016). Previous literature has also identified various phases in the cruise journey, such as onshore, port of call, and destination stages. Additionally, some studies have segmented the cruise journey into a larger number of phases, with some even expanding it to eleven phases (Chubb & Chubb, 1981). However, more phases do not necessarily lead to better insights; there should be guiding principles for segmenting the customer journey. For instance, dividing the journey based on customer behavioral intentions can provide a clearer understanding of satisfaction drivers, as numerous studies have demonstrated the connection between consumer behavioral intentions and satisfaction (Furquim et al., 2022; Sun et al., 2022).
The AIDMA model of consumer behavior, one of the earliest theoretical frameworks for segmenting the customer journey based on behavioral intentions, consists of five phases of attention, interest, desire, memory and purchase action. However, some scholars soon realized the important of the after-sale phase in sustaining customer loyalty, arguing that the purchase action is not the end of consumer journey, but rather, sharing is the final phase. This led to the development of the AISAS model, which adds “sharing” as the final phase and replaces “desire” and “memory” with “search” (Wei & Lu, 2013). In 2012, China introduced the SICAS model, a new trajectory based on an in-depth understanding of Internet consumption behavior (Yan et al., 2017). The SICAS model, tailored to the Internet consumption environment, is more suited for describing the consumption process of young Chinese people. It replaces “attention” with “sense,” emphasizing the dynamic nature of a tourist’s progression from potential tourist to actual tourist and highlighting the role of information service touchpoints in engaging potential tourists in the digital age. Furthermore, it substitutes “search” with “connection,” focusing on the interaction between the service provider and the visitor, rather than the visitor searching for information independently. The term “connection” better captures the behavioral intention of tourists at this stage. This makes the SICAS model more relevant for understanding the consumer behavior of young people, especially those who are active Internet users.
In the SICAS model, the rapid flow of information through online channels boosts the interactivity of each stage in the purchasing process, leading to the five phases: sense, interest (interaction), connect (communication), action and sharing (see Table 1). This dynamic progression is advantageous in empowering young tourists to become co-creators of their own cruise experiences.
Descriptions on the Five Phases of Consumer Behavioral (SICAS) Model Refer to the Previous Studies (Huang, 2019; Yan et al., 2017).

The “Quad + SICAS” touchpoints model is proposed by combining the SICAS model (shown in Table 1) with the four types of touchpoints (illustrated in Figure 1). As demonstrated in the SICAS model in Table 1, the five phases of the cruise journey align with behavioral intentions and are proven to effectively reflect the travel patterns of young tourists, thanks to the rapid flow of information and detailed description of the consumption process. The four types of touchpoints, introduced based on the evolving consumption environment, are well-suited to the changes in the cruise industry driven by the growing use of social media. Therefore, the “Quad + SICAS” model serves as a framework for developing a new index system to systematically assess young cruise tourists’ satisfaction, as shown in Figure 2.
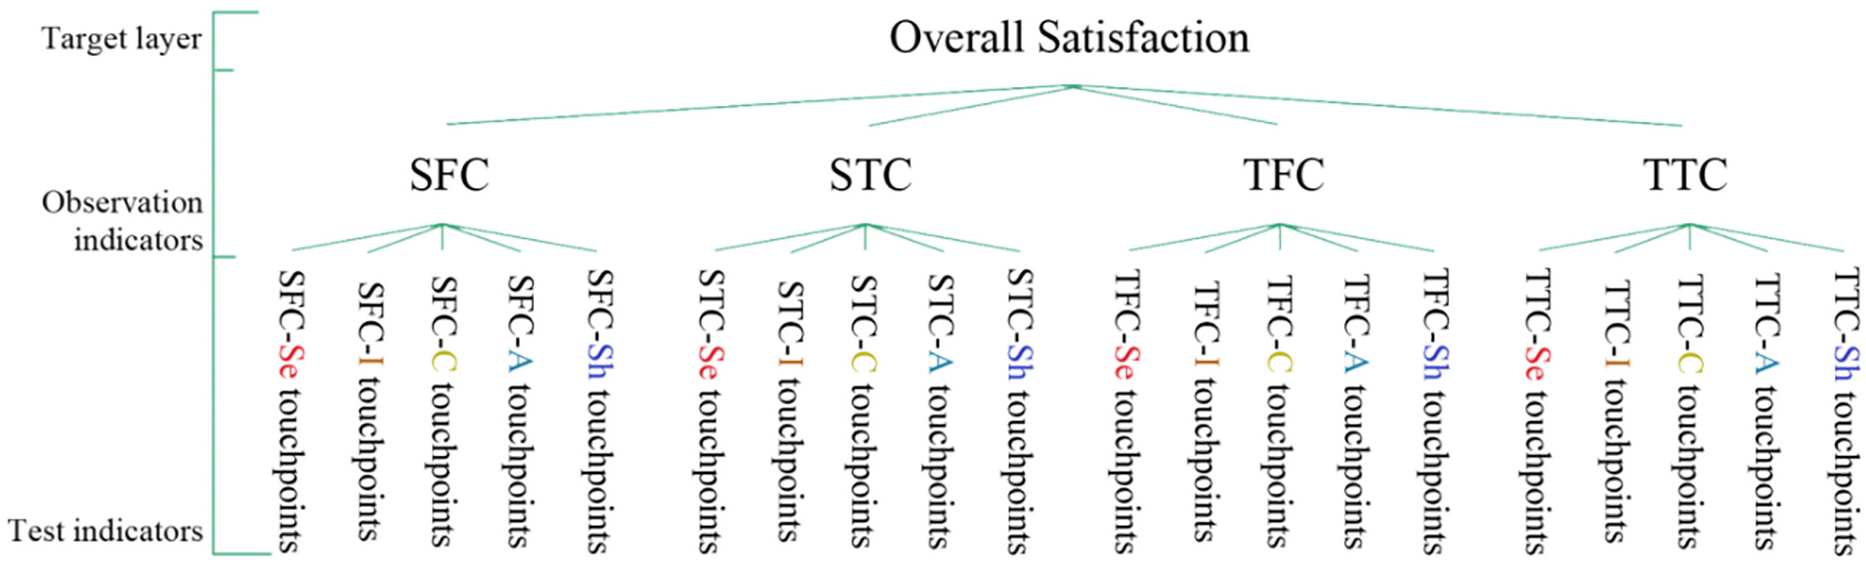
Structure of new satisfaction evaluation system developed from 4 touchpoint types and 5 phases (Quad + SICAS).
Hypotheses
Given the crucial role of touchpoints in delivering services and facilitating “tourist-firm” service co-creation, it is hypothesized that touchpoints significantly impact the overall satisfaction of young cruiser. Based on the literature review, four research hypotheses are proposed in this study as follows:
H1: SFC touchpoints have a significant impact on the overall satisfaction of young tourists during their cruise journey.
H2: STC touchpoints have a significant impact on the overall satisfaction of young tourists during their cruise journey.
H3: TFC touchpoints have a significant impact on the overall satisfaction of young tourists during their cruise journey.
H4: TTC touchpoints have a significant impact on the overall satisfaction of young tourists during their cruise journey.
Methodology
To achieve the overall aim of this study, a research strategy combining both qualitative and quantitative methods is proposed. The qualitative research component includes Word Frequency Analysis (WFA) applied to interview data, while the quantitative research focuses on statistical analysis of data collected through an online survey. This analysis involves Exploratory Factor Analysis-Confirmatory Factor Analysis (EFA-CFA) and Structural Equation Modeling (SEM). Additionally, the Fuzzy Analytic Hierarchy Process (FAHP) will be employed to express the quantitative relationships between variables (touchpoints and satisfaction) in normalized weight values, aiding in the construction of a hierarchical system based on these relationships (Zhu et al., 2020). The research process, aligned with the study’s objectives, is outlined in the methodology flow chart presented in Figure 3.

Method flowchart.
Study Site
The data for this study were collected from four major cities along the Yangtze River in China, including Chongqing, Yichang, Nanjing, and Shanghai (Figure 4). These cities were chosen as they are ideal locations for measuring tourists’ satisfaction with their cruise journey due to their advanced economies and the variety of cruise products available (Sun et al., 2014). The Yangtze River, running across China from east to west, creates a diverse and picturesque natural landscape, offering unique conditions for river tourism. Chongqing, Yichang and Nanjing are well-known port cities along the river, making them advantageous for the development of inland river cruise routes that integrate port-of-call and cruise tourism experiences. Shanghai, located at the mouth of the Yangtze River, has abundant inland river and marine tourism resources. It is not only a major departure port but also a popular port of call for international cruise lines (Yin & Liu, 2017). These four cities attract thousands of domestic and international tourists annually, including young cruise travelers, who are the focus of this study on the future development of the cruise industry. Therefore, the presence of prestigious universities in these cities makes it easier to access young respondents, while the strategic location along the Yangtze River leads to a higher number of cruise tourists.
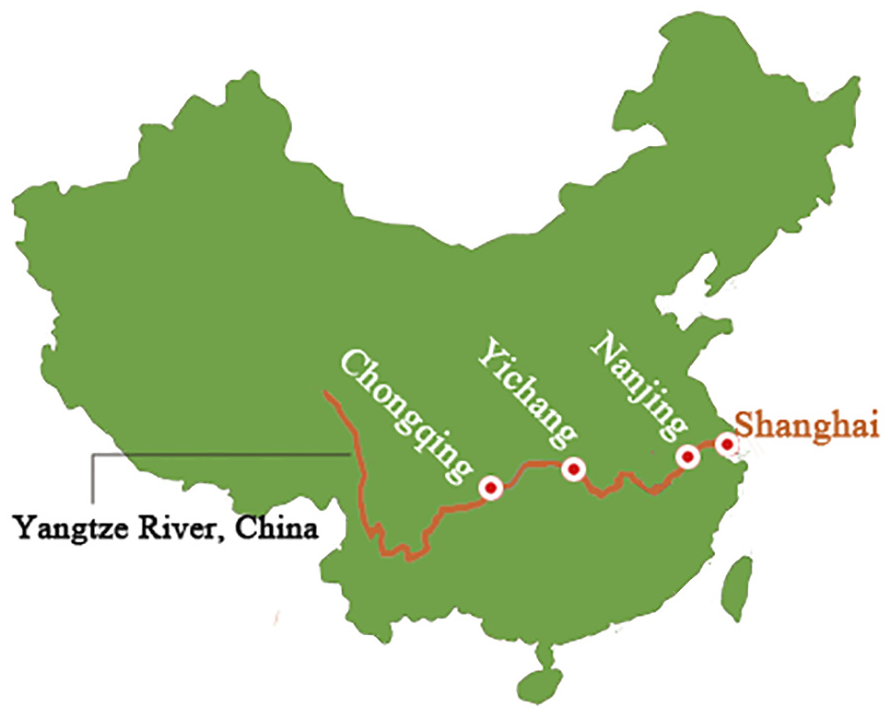
Study sites.
Data Collection
Data collection was divided into two parts: the first part involved face-to-face interviews using an interview guide to identify key touchpoints corresponding to the structure of the new evaluation index system (see Figure 2). A total of 32 interviewees, aged 15 to 35 years and with at least one cruise experience in the past year, were selected. The second part was an online survey designed to assess satisfaction with the cruise journey. The survey targeted students and teachers from universities in Chongqing, Yichang, Nanjing, and Shanghai, who were asked to complete the questionnaire and share it with their families and friends who had at least one cruise experience. While the number of people with cruise travel experience is growing, the subgroup of young travelers is dispersed, making the internet an effective method for reaching respondents aged 15 to 35 with relevant cruise experience (Sue & Ritter, 2012). The interview guide used in first part was based the structure in Figure 2. During the interviews, participants were asked to identify the most important touchpoints in each phase of their cruise journey. The online survey questionnaire was developed from the most frequently mentioned touchpoints in the interviews, with specific touchpoints used as measurement items, as shown in the Supplemental section.
Finally, six marketers and four experienced tourists from two cruise companies in Chongqing and Shanghai were invited to participate in the FAHP process to score the newly constructed satisfaction index system using the identified touchpoints. The data collected during this part will be used to calculate the weights and test consistency. The data collection process was designed as follows: (1) construct a goal-oriented hierarchical index system; (2) create pairwise comparison matrices based on hierarchical relationships at all levels, with six matrices constructed from the three levels of the index system; (3) conduct a consistency test by using the weighted average of each expert’s score, based on the maximum eigenvalue of the matrix; (4) calculate and normalize the weight values at each level to obtain the final index weights. The consistency test formula is presented in equation (2), where “CI” refers to the consistency index, “RI” is the random index (see Table 2), “n” is the number of factors in the matrix, and “λmax” is the largest eigenvalue of the matrix. If CR < .1, the judgment matrix is considered acceptable.

Random Index on Different Factor Number.

Measurement and Analysis
To validate the four hypotheses proposed in the literature review, it is essential to assess the performance of the four types of touchpoints across the five phases, including the 20 touchpoint sub-types, as illustrated in Figure 2. Consequently, the “Quad + SICAS” touchpoints model was used as an interview guide to gather specific touchpoints corresponding to the 20 sub-types. Data for this study were collected from 32 interviewees, identifying 25 high-frequency touchpoints (see Table 3), which were then used to develop a questionnaire measuring the satisfaction of young cruise tourists. In addition, three items—revisit intention, recommendation, and praise—were included first in reference to overall satisfaction with a past cruise experience, in order to avoid any priming effects before completing the questionnaire regarding specific touchpoint types (Ozturk & Gogtas, 2016) All items were completed online using a Likert scale, widely employed in surveys to gauge respondents’ subjective perceptions, ranging from 1 (extremely dissatisfied) to 5 (extremely satisfied; Nemoto & Beglar, 2014).
The 25 High-Frequency Touchpoints Identified from Interviewees Corresponding to the 20 Sub-Types.

The data collected through the online survey were analyzed in two phases. First, the EFA-CFA method was employed to evaluate the reliability and validity of the scale in measuring the impact of the four touchpoint types on the overall satisfaction of young tourists during their cruise journey. Next, Structural Equation Modeling (SEM) was applied to validate the relationships between the four touchpoint types (factors) and the specific touchpoints (items), as well as the connections between these touchpoint types and overall satisfaction. SEM also facilitated the use of FAHP by modeling these relationships into a three-level index structure. FAHP serves two key functions in the literature: it helps construct a hierarchical system that categorizes all factors influencing the overall objective into goal, criterion, and index layers, and it assigns weight values to indicators using fuzzy theory (Zhu et al., 2020). To calculate the weights for each index level in the newly developed satisfaction evaluation system based on the “Quad + SICAS” touchpoints model, 10 experts from two cruise lines were invited to participate in the process.
Results
Sample Characteristics
The interview and online survey respondents were restricted to individuals aged 18 to 35, a demographic often highlighted in travel-related studies for their distinct consumer preference (Marcevova et al., 2010; Scarpato et al., 2014), and projected to be a dominant group in the future tourism market. In both the interview and online survey samples, the number of female respondents was approximately 1.5 times that of male respondents. One-third of the respondents (students) were under 25 years old, while two-thirds (teachers and their family members) were over 25 years old (see Table 4). These similarities between the two samples suggest that they were randomly selected. In terms of occupation and cruise experience, the two groups were also quite similar, with around one-third of the total travelers having experienced international cruise lines.
Samples Characteristics.

EFA-CFA Results
EFA is used to test the correlation structure and reduce unnecessary variables in the indexes (Vasuaninchita et al., 2019), while CFA aims to validate the results obtained from EFA (Chen et al., 2015). Data from 25 service touchpoints collected from 301 experienced young cruise travelers were analyzed using SPSS software. The analysis revealed that the sub-types “SFC-A” (Marketing account to sell) and “TFC-Sh” (After-sales customer service) should be excluded due to their failure in the reliability test. The Kaiser–Meyer–Olkin (KMO) value (.936 ≥ .6) and the significant (Sig.) value (.000 < .05) for the 23 remaining touchpoints met the required standards, indicating that the data is suitable for further EFA. To avoid common method bias, the total variance interpretation was assessed, as shown in Table 5. Five common factors with eigenvalues greater than 1 were identified, which aligns with the five factors outlined in this study, including overall satisfaction. The variance extracted from the first factor was 20.858, which is significantly lower than the 40% threshold (Viswanathan & Kayande, 2012). Therefore, no common method bias was detected in the data collection, and the data is suitable for further statistical analysis, with the results from EFA and CFA deemed acceptable.
Total Variance Interpretation.

The results of the EFA are summarized in Table 6, where all touchpoints (items) were correctly categorized into the predicted types (factors: TTC, TFC, SFC, and STC), with factor loadings exceeding the threshold value of .5. This indicates strong correlations between touchpoints (items) and factors, confirming that the touchpoints were accurately identified during the interviews. Cronbach’s alpha values, which measure the reliability of the scale, should be greater than .7 to indicate high reliability. As shown in Table 6, the Cronbach’s alpha values for all factors exceed .7, demonstrating that the scale used in this study has high reliability.
Summary of Study EFA.

Note. Extraction method: Principal component analysis (PCA). Rotating method: Kaiser normalized maximum variance method.
Rotation converged after 5 iterations.
The initial model fit for the proposed model, based on the 23 touchpoints and overall satisfaction, was acceptable. The model fit for the CFA measuring the impact of touchpoints on overall satisfaction of young tourists yielded the following results: CFI = .991 (≥.9), TLI = .990 (≥.9), RMSEA = .022 (<.08), and SRMR = .034 (<.08). As shown in Table 7, regarding convergent validity, all touchpoints (items) within each factor (type) had factor loadings above the recommended .5, composite reliability (CR) values exceeding .7, and average variance extracted (AVE) values higher than the recommended value of .5 for all factors. Regarding discriminant validity, all squared correlations between factors were smaller than the AVE (Table 8). The diagonal represents the AVE for each factor, and the numbers below the diagonal indicate the squared correlations between factors, providing sufficient evidence of good discriminant validity.
Summary of Study CFA.

Cruise travel fit statistics: CFI = .991, TLI = .990, RMSEA = .022, SRMR = .034.
Squared Correlations Between Types (Factors) Affecting the Overall Satisfaction.

SEM Results
The SEM was constructed based on the CFA results, as shown in Figure 5, where the research hypotheses are represented by the correlations between the latent variables (types) and overall satisfaction. The 23 service touchpoints were included in the analysis as observed variables, maintaining the same model fit as the CFA, and were assigned to their respective latent variables (types) as outlined in Table 7. Figure 5 illustrates the paths from the four latent variables to overall satisfaction, indicated by arrows with correlation coefficients, which show that there are significant relationships between the four types of touchpoints and overall satisfaction.

SEM of overall satisfaction and its affecting variables.
The data analysis supported all four paths from the latent variables (types) to overall satisfaction, with significant values below the recommended threshold of .05. This indicates that the four hypotheses proposed in this study are supported by the data (Table 9).
Path Analysis Results of SEM.

p < 0.001.
FAHP Results
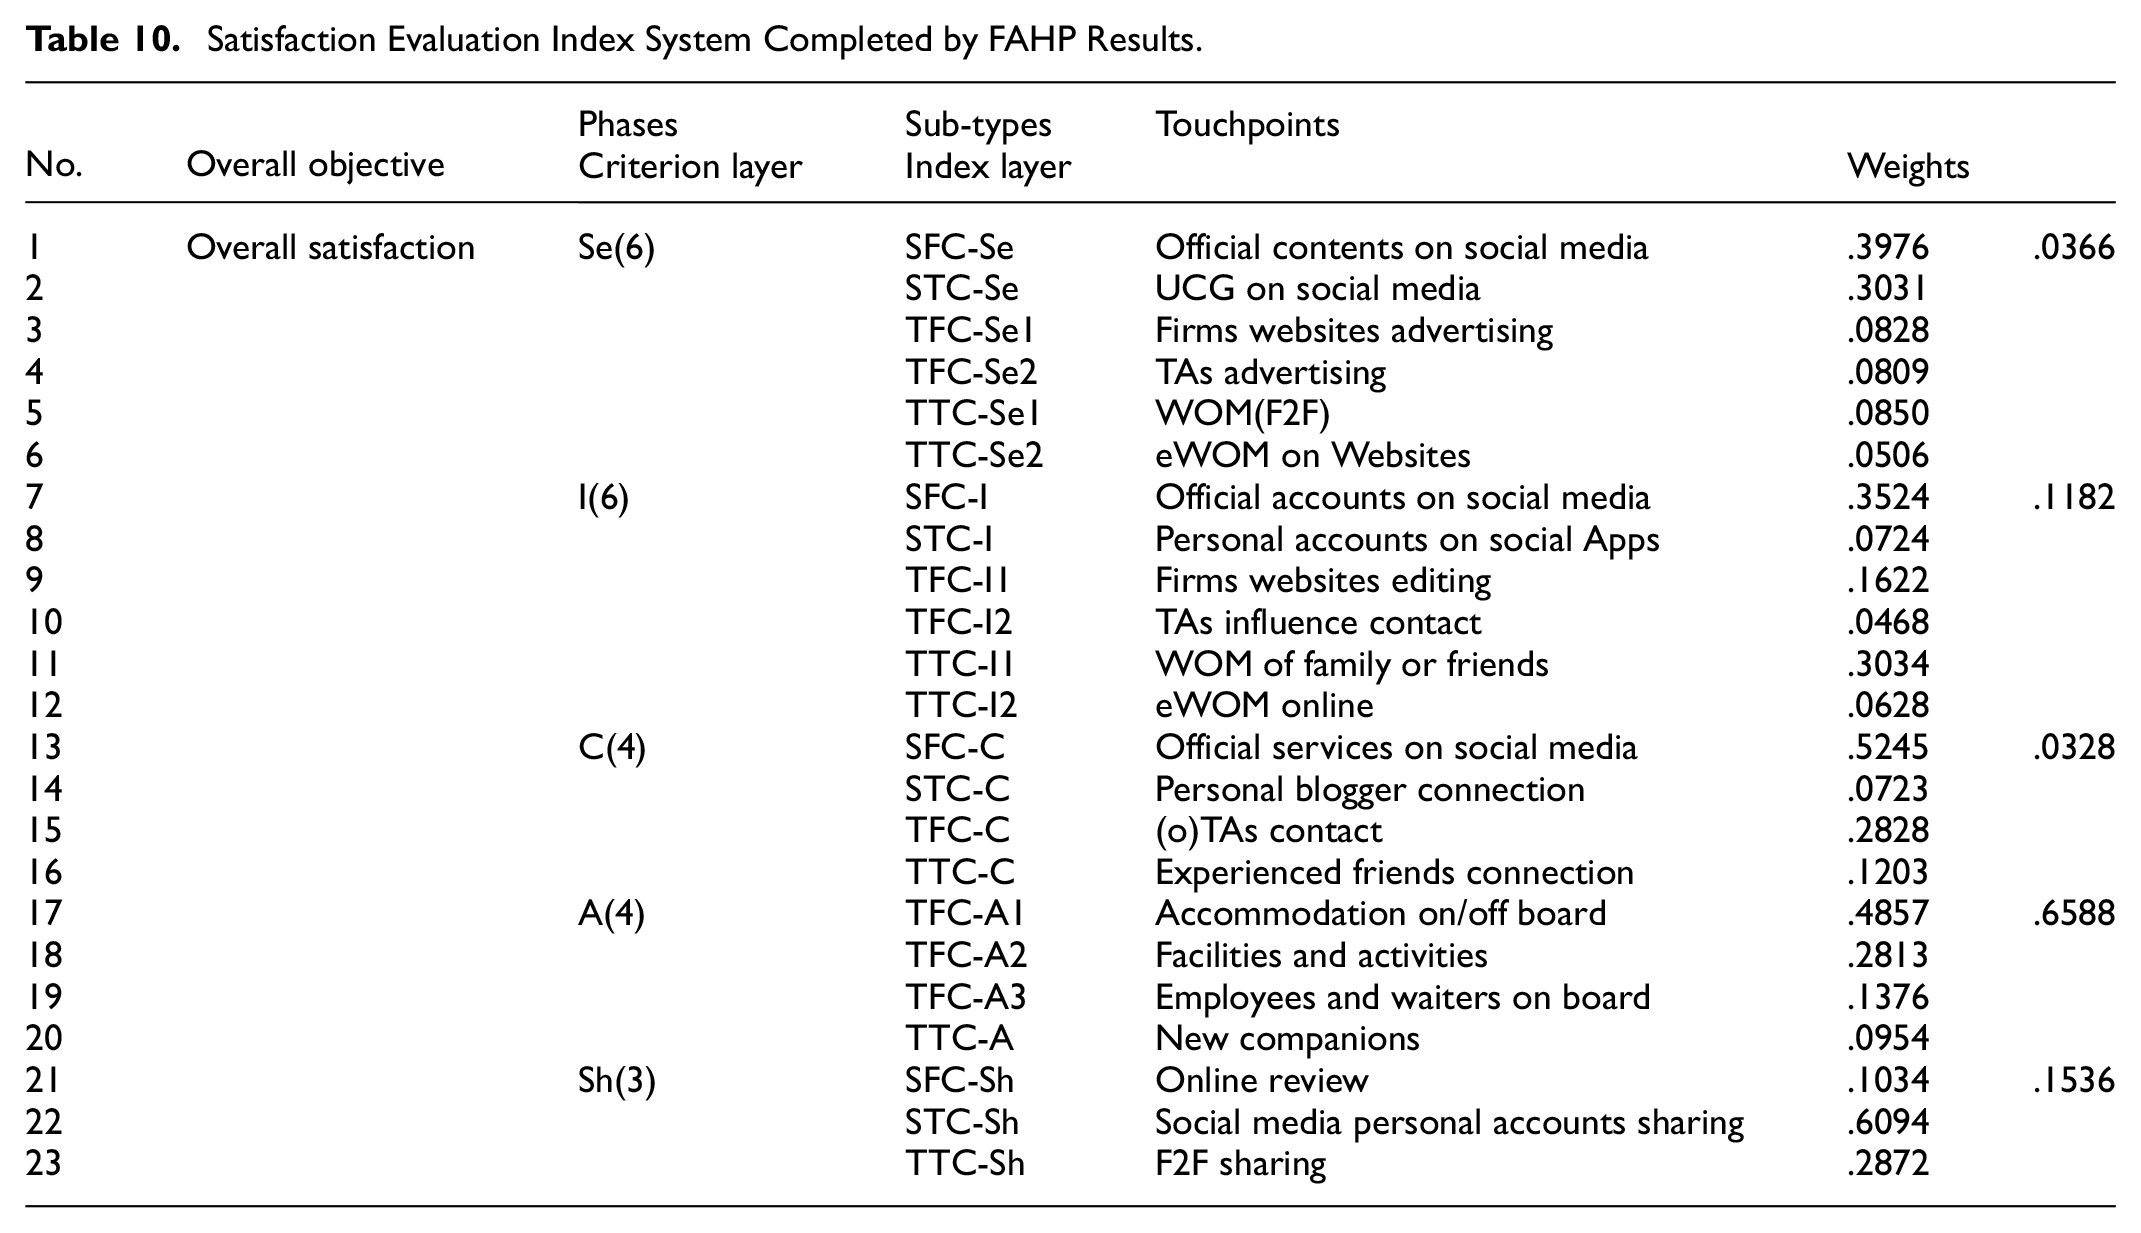
For the construction of the index system, the 23 touchpoints identified through the EFA-CFA method and their corresponding sub-types were clearly considered as the indexes in the indicator layer. During the interviews to identify high-frequency service touchpoints, it was found that using the five phases of the consumer behavior (SICAS) model as a guideline made it easier to identify service touchpoints. Therefore, the five phases were used as the criterion layer, replacing the four touchpoint types in the construction of the satisfaction evaluation index system. The evaluation index system for young tourists’ overall satisfaction is shown in Table 10. Regarding the calculation of the indexes’ weight values, a group of experts, including six cruise marketers and four experienced tourists from two cruise lines (“Golden Cruise” from Chongqing and “Blue Dream Cruise” from Shanghai), participated in the scoring process. Using the pairwise comparison matrices from the three-level index system, the expert scores were collected. The calculated weight values were then normalized and filled in Table 10, with all values showing consistent test results.
Satisfaction Evaluation Index System Completed by FAHP Results.
Discussions
This article aims to improve the effectiveness of touchpoints in young tourists’ cruise experiences by examining their channels, controllers, and occurrence processes. Additionally, it aims to establish a new satisfaction evaluation index system for young cruise travelers, based on service touchpoints. The EFA-CFA analysis results showed that the touchpoints identified in interviews demonstrated strong reliability and validity when used as a measurement tool for testing latent variable types. SEM results confirmed that all four touchpoint types were positively associated with overall satisfaction, as hypothesized. However, specific touchpoints, such as “marketing account to sell” and “after-sales customer service,” corresponding to the “SFC-A” and “TFC-Sh” sub-types, were found to be inadequate during the EFA process. This suggests that SFC type touchpoints may not influence the action phase of cruise travelers, nor can TFC type service touchpoints be considered to impact the sharing phase. Furthermore, the absence of specific service touchpoints related to the “STC-A” category, as collected in the interviews, reinforces this observation. As a result, the final indicators selected for the new satisfaction evaluation index system for young cruise travelers consist of 23 specific service touchpoints representing 17 sub-types. These touchpoints were organized into a three-level index system and assigned weights using the FAHP process, as presented in Table 10.
Theoretical Implications
The new scale used in this study to measure young cruisers’ satisfaction was developed from the “Quad + SICAS” touchpoints model and performed effectively during the EFA-CFA process. This finding suggests that the customer behavior model (SICAS) is well-suited to explaining the travel patterns of young people. Veiga et al., (2017) and Cova and Salle (2008) argued that the new travel patterns of young people emerge from value co-creation through “tourist-firm” interactions on social media. This perspective is supported by the new evaluation index system, particularly by the distribution and weight values of the identified touchpoints. In the five phases of the consumer behavior (SICAS) model, social media touchpoints dominate in terms of both number and weight in the “Sense,”“Interest and Interaction,”“Connect and Communication,” and “Sharing” phases. This indicates that social media touchpoints play a more significant role in young tourists’ travel planning, decision-making, and experience-sharing. In contrast, traditional service touchpoints dominate in the “Action” phase, both in terms of number and weight, suggesting that these traditional touchpoints are indispensable for young tourists seeking a superior physical experience from onboard services and activities (see Tables 3 and 10). The WFA and FAHP results highlight both the advantages and limitations of social media service touchpoints: (1) The advantage lies in their ability to facilitate “tourist-firm” interactions throughout young tourists’ experience-seeking, travel-planning, decision-making, and experience-sharing processes (Hu & Olivieri, 2021); (2) The limitation is that, although social media touchpoints influence young travelers across multiple phases, they are primarily used as channels to enhance physical experiences and do not significantly impact the core aspects of the tourism activity (Chakravarthi & Gopal, 2012; Sigala, 2016).
While the findings of this study align with some of the arguments in previous literature, it adopts a significantly different approach from a systematic perspective. Unlike earlier studies that focus on specific touchpoints or particular phases of the customer journey, this study examines the relationships between different types of touchpoints and overall satisfaction, considering the interactions between these touchpoints. This approach helps avoid overemphasizing the impact of any single type of service touchpoint. Lemon and Verhorf (2016) highlight the importance of classifying touchpoints and segmenting the customer journey, which served as a key reference for this study. However, the classification of touchpoints and phase division in this study is more focused on the evolving experiences resulting from interactions between young tourists and cruise service providers, as well as changes within the cruise industry. This offers new insights into the field of cruise tourism and satisfaction assessment compared to previous studies.
Practical Implications
This study also uncovers valuable insights from the measured touchpoints regarding channels, controllers (owners), and phases of interaction, offering useful implications for marketing strategies. Regarding channels, social media is highlighted as an effective way to facilitate early “tourist-firm” interactions compared to traditional channels. This is evidenced by the performance of three touchpoints and their corresponding sub-types (SFC-Se, STC-Se, and STC-Sh) in the SEM (as shown by factor loadings in Figure 5) and FAHP (with weight values in Table 10). The high weight and factor loadings of these social media touchpoints suggest that the beginning (Sense) and end (Sharing) phases of young cruisers’ customer journeys are heavily influenced by social media. These findings support previous studies that indicate tourists’ experiences are increasingly shaped by digital touchpoints on social media (Sigala & Gretzel, 2017). This also emphasizes the need for cruise service providers to cultivate a strong brand image and positive word-of-mouth through social media.
In terms of touchpoint controllers, this study provides additional insights to support previous research that highlights the value of customer-owned touchpoints in interactions (Hu & Olivieri, 2021; Yakhlef & Nordin, 2021). While social media touchpoints have been shown to be effective across various phases of young tourists’ cruise journeys, tourist-controlled and firm-controlled touchpoints perform differently. Service providers should prioritize tourist-controlled touchpoints during the “Sense” and “Sharing” phases, such as content on personal microblogs. In contrast, during the “Connect and Communication” phase, firm-controlled touchpoints, like service accounts on platforms such as WeChat, should be optimized for greater convenience and efficiency to better align with the behavioral preferences of young consumers.
The division of phases in the cruise journey should be considered from the tourists’ perspective, based on their behavioral intentions, which have been shown to directly influence satisfaction in previous studies (Dolnicar et al., 2015; Huang et al., 2015). The same touchpoints can appear in different phases of the cruise journey (see Tables 3 and 10), addressing different issues based on the tourists' evolving intentions (see Table 1), thereby achieving the overall goal step by step. This provides a clearer interpretation of the significance of phase division, an aspect not explicitly addressed in Sun et al. (2022) and Furquim et al. (2022). It suggests that cruise providers should adapt the functions of the same type of service touchpoints to cater to different phases. For instance, a TikTok account may impact young travelers differently in the “Interest” phase compared to the “Connect and Communication” phase, where the former requires the creation of engaging graphic content, while the latter calls for professional customer service.
Limitations of this Study
This study offers recommendations for market practitioners on managing touchpoints in terms of their phases, controllers, and channels, based on the new satisfaction index system proposed. However, these suggestions are intended as a framework to inspire future research in satisfaction assessment within the cruise industry, particularly for the younger demographic. The study does not take into account practical policies and challenges, which is a limitation of the current research. It is recommended that future studies address these aspects.
Furthermore, the methods used in this study have areas for improvement that should be addressed in future research. The EFA-CFA method was employed to validate the questionnaire design and test the structure of the proposed satisfaction index system, based on its effectiveness with similar items in previous studies. However, some scholars have suggested that using separate samples for EFA and CFA is preferable to ensure the reliability and validity of the data analysis. As a methodological limitation, this study recommends using different samples for EFA and CFA in future research.
Conclusions
The present study aimed to explore the various roles that different types of touchpoints play in the customer journey of young cruisers and to develop a new evaluation index system for their satisfaction based on the nature of these touchpoints. The findings suggest that the “Quad + SICAS” touchpoint model aligns well with the behavioral preferences of young cruisers. Through the EFA-CFA process, 23 touchpoints and their 17 sub-types were validated, contributing to the creation of the new satisfaction evaluation index system. This system was applied in surveys of experienced tourists, and insights were drawn from the SEM and FAHP results regarding touchpoints’ channels, controllers, and phases. The study’s contributions are notable both in terms of practical touchpoint management for the cruise industry and in the theoretical research on young cruise travelers. However, the study is limited by the authors’ single disciplinary perspective, which may have led to an incomplete interpretation of the findings and a lack of interdisciplinary integration. Additionally, demographic variables known to influence study outcomes were not included, presenting an opportunity for future research. Incorporating these variables, such as income, region, and educational background, would enhance the applicability of the satisfaction assessment framework in professional practice.
Supplemental Material
sj-docx-1-sgo-10.1177_21582440251359091 – Supplemental material for Assessing the Satisfaction of Young Chinese Cruise Tourists Using the “Quad + SICAS” Touchpoints Model
Supplemental material, sj-docx-1-sgo-10.1177_21582440251359091 for Assessing the Satisfaction of Young Chinese Cruise Tourists Using the “Quad + SICAS” Touchpoints Model by Hao Liu, Xu Li and Honglei Lu in SAGE Open
Footnotes
Ethical Considerations
This study was conducted in accordance with the ethical guidelines set by University Ethics Committee. Approval was obtained prior to data collection, with the code of BECAHU-2024-010.
Consent to Participate
All participants in this study were fully informed of the research purpose and procedures. Participation was voluntary, and written consent was obtained from each participant before they took part in the survey.
Funding
The author(s) received no financial support for the research, authorship, and/or publication of this article.
Declaration of Conflicting Interests
The author(s) declared no potential conflicts of interest with respect to the research, authorship, and/or publication of this article.
Data Availability Statement
The data supporting the findings of this study are available upon reasonable request from the corresponding author.
Supplemental Material
Supplemental material for this article is available online.
References
Supplementary Material
Please find the following supplemental material available below.
For Open Access articles published under a Creative Commons License, all supplemental material carries the same license as the article it is associated with.
For non-Open Access articles published, all supplemental material carries a non-exclusive license, and permission requests for re-use of supplemental material or any part of supplemental material shall be sent directly to the copyright owner as specified in the copyright notice associated with the article.