
Abstract
Economic groups have played a pivotal role in the development of emerging economies, and Ecuador is not an exception. Ecuadorian economic groups have experienced substantial growth over the past decade. This study examines the Ecuadorian economic group rankings from 2016 to 2021 using quartile-based financial analysis and t-tests for equality of means. The results reveal a 141.60% increase in the number of registered Ecuadorian economic groups between 2015 and 2021, growing from 125 to 302 groups. The findings highlight economic concentration in their geographical distribution and member composition, while also showing sectoral diversification and interconnections between Ecuadorian economic groups. The analysis of macroeconomic and financial variables confirms the significant role of economic groups in the Ecuadorian economy. However, their relative contribution to fiscal variables remained stable during the study period. Additionally, t-test for the equality of means revealed statistically significant differences in financial performance across quartiles between 2015 and 2020, confirming a hierarchical structure among Ecuadorian economic groups based on their financial variables. The study provides a comprehensive overview of the growth, transformation, and structural composition of economic groups in Ecuador, emphasizing their oligopolistic tendencies and the strong presence of family-owned and controlled firms. For future research, it is recommended to explore the internal governance models and corporate social responsibility practices of Ecuadorian economic groups, with particular focus on the role of family ownership in corporate decision-making. Comparative studies across Latin America are also encouraged to better understands regional patterns of economic concentration and implications for development policy.
Keywords
Introduction
The concept of an economic group is attributed to the economist and academic Francesco Vito, who contributed to the theory of political economy and corporatism during the Great Depression. His work explored alternative models to classical and neoclassical economies, emphasizing the role of industrial unions and business conglomerates. An economic group is typically formed when an individual or group of owners administratively and financially controls multiple companies across the same or different economic sectors, collectively making strategic decisions regarding the allocation of economic surplus (Dahse, 1981). According to Leff (1978) economic groups often exhibit shared management practices and are linked by familial, personal, or business relationship. The existence of economic groups tends to exacerbate agency problems and information asymmetries, as their interconnected structures may foster market concentration, depending on their development strategies and ability to influence public policy (Chang, 2003; Guriev & Rachinsky, 2005).
An economic group is characterized by (1) the formation of productive conglomerates with functional inter- and intra- relationships, (2) a limited separation between ownership and control, (3) vertical and/or horizontal integration across economic sectors, (4) close ties with financial institutions, and (5) significant economic and communicational power. In Latin America, a defining feature of economic groups is their diversification across multiple sectors (Groose & Mesquita, 2007).
In Ecuador, the Internal Tax Regime Law defines an economic group, for tax purposes, as a collection of individuals and legal entities (domestic or foreign) in which one or more members directly or indirectly hold 40% or more of the shareholding in other firms (Servicio de Rentas Internas del Ecuador, 2015). Historically, the evolution of Ecuadorian economic groups dates back to the 1970s, when their primary activities were focused on oil extraction, commerce, construction, and mining. During this period, two major conglomerates emerged: the Guayaquil group (agro-porter) and the Filantrópica group (manufacturing-based). These groups have since expanded significantly through vertical and horizontal integration, and have diversified their operations across products, services, activities, and industries.
This manuscript aims to investigate the evolution, structure, and economic impact of Ecuadorian economic groups from 2016 to 2021, drawing on an extensive literature review and empirical analysis. In particular, it seeks to identify key characteristics of Ecuadorian economic groups based on their geographic composition (planning zones, regions, and provinces), legal integration (types of members: natural persons, foreign individuals, national firms, and foreign firms), primary economic activities, and the interrelationships between economic groups. The study also examines the influence and contribution of Ecuadorian economic groups to key macroeconomic and financial variables, with a focus on their dominance in terms of assets and tax contributions. A quantitative methodology is applied, which includes (i) descriptive statistical analysis of Ecuadorian economic groups, (ii) quartile-based classification according to financial performance, and (iii) t-tests for equality of means to evaluate significant financial disparities between quartiles. Finally, the research provides a compressive overview of the economic, social, and legal influence of Ecuadorian economic groups, offering insights into their role in the broader national landscape.
In 2007, the Internal Revenue Service (in Spanish Servicio de Rentas Internas SRI), identified only 17 Ecuadorian economic groups. By 2021, this number had increased to 302 Ecuadorian economic groups, reflecting a substantial expansion in their presence and influence within the national economy. Geographically, these groups were predominant located in the Sierra provinces (64.57%), and the Coastal region (35.10%), with only one group (0.33%) based in the Amazon region. The majority of Ecuadorian economic groups were domiciliated and operated in Ecuador’s most economically significant provinces: Pichincha, with 153 groups, and Guayas, with 92, together accounting for 81.13% of all registered Ecuadorian economic groups in these two provinces. On the other hand, the importance of Ecuadorian economic groups. The macroeconomic impact of Ecuadorian economic groups is considerable. In 2020, their tax contributions represented 5.56% of the current gross domestic product (GDP) and 8.33% of the real GDP, while they accounted for 47.89% of the total national net tax collection. Despite this high level of contribution, their effective tax rate and tax burden showed a decline from 10.50% in 2015 to 9.13% in 2020, and from 2.28% to1.74%, respectively.
Regarding asset concentration, the top 10 Ecuadorian economic groups in 2020 held 43.29% of the total assets of all economic groups and represented 57.24% of Ecuador’s current GDP. In terms of taxation, these top 10 Ecuadorian economic groups were responsible for 46.40% of the total tax contribution from all Ecuadorian economic groups and 22.22% of the country’s total national net tax revenue. These findings illustrate that a small number of Ecuadorian economic groups control a substantial portion of economic power in Ecuador and may exert significant influence over national economic policy and decision-making. These groups often operate in oligopolistic markets, where their economic, commercial, and financial decisions are closely tied to family networks and interrelated firms. Nevertheless, the growth and representativeness of Ecuadorian economic groups stagnated in the aftermath of the COVID-19 pandemic, a trend that coincided with a notable GDP contraction of 8.16% between 2019 and 2020.
The analysis of Ecuadorian economic groups provides valuable insights into the country’s macroeconomic landscape and the role these entities play in the political economy. Despite the presence of state-owned enterprises, particularly in sectors such as public utilities and oil extraction, the Ecuadorian economic groups remain dominant market players and major contributors to national tax revenue. According to the International Standard Industrial Classification of All Economic Activities (ISIC), revision 4, five economic sectors accounted for 72.48% of the total national firms affiliated with Ecuadorian economic groups: (i) financial and insurance activities (1,378 firms), (ii) wholesale and retail trade (1,019 firms), (iii) agriculture, forestry, and fishing (688 firms), (iv) manufacturing (664 firms), and (v) real estate activities (593 firms). Moreover, a quartile-based analysis of the financial variables of Ecuadorian economic groups revealed significant differences in the average values for quartiles 2 and 3, particularly in terms of total assets, total equity, total income, total tax collection, and total income tax. Notably, the mean values of these financial variables were consistently higher over time, possibly linked to macroeconomic shocks such as the COVID-19 pandemic.
The importance of this study lies in its effort to address a critical gap in the academic and policy discourse surrounding Ecuadorian economic groups, which have played a pivotal role in the country’s economic development. Their significance is underscored by their substantial growth, with an increase of 141.6% in registered groups between 2015 and 2021, and their strong presence in fiscal metrics. This study highlights the concentration of assets within Ecuadorian economic groups, their tax contributions, and their dominance across key economic sectors.
At the heart of this research is a central policy issue: the economic and fiscal concentration of power among a relatively small number of economic groups in Ecuador. This concentration raises important concerns regarding tax equity, market competition, and economic resilience. Although Ecuadorian economic groups contribute nearly half of the country’s total net tax revenue, their effective tax rates have declined over time. Moreover, the widespread use of offshore structures and connections to tax havens among many Ecuadorian economic groups poses risks to Ecuador’s fiscal sustainability, prompting urgent questions around tax avoidance, fiscal responsibility, and the effectiveness of regulatory oversight. To tackle these challenges, the study adopts a data-driven approach that uses robust quantitative methods, including quartile analysis and t-tests, to examine the structure and behavior of Ecuadorian economic groups. Drawing from 1,330 firm-year observations, it reveals hierarchical disparities in financial performance and uncovers patterns of spatial and ownership-based concentration. By stratifying Ecuadorian economic groups by quartile and ownership type, the study provides a nuanced understanding of their internal dynamics and external impact.
Importantly, the findings and policy implications of this research extend beyond Ecuador. Many Latin American countries face similar issues related to economic concentration, tax avoidance, and the dominance of family-controlled conglomerates. As such, this study offers a replicable analytical framework that can inform comparative research across the region and support the coordination of regional strategies focused on fiscal reform, anti-avoidance measures, and economic diversification. This paper is organized as follows. Section “Literature review and hypotheses development” presents the definition of economic groups, a literature review on the evolution of the Ecuadorian economic groups from 1970 to 2020, and the development of the study’s hypotheses. Section “Data and methodology” describes the methodological framework employed in the research. Section “Results” outlines the empirical findings based on quantitative data analysis. Discussion section engages in discussion and interpretation of the results. Last section concludes the study by summarizing the key findings, outlining policy implications, noting limitations, and proposing directions for future research.
Literature Review and Hypotheses Development
Economic Groups
Economic groups are defined as collections of businesses, typically comprising parent firms and subsidiaries, that function collectively as a single economic entity (Dau et al., 2021). These entities are generally controlled by a common source, creating complex networks of interrelated firms. Despite operating in diverse markets, they maintain common or interconnected administrative and financial control, often tied together through interpersonal, familiar, or long-standing business relationships. Economic groups may operate in similar industries or across entirely different sectors, and are typically formed through consolidations, mergers, and acquisitions. Their global prevalence is evident in the various terms used to describe them, such as keiretsu and zaibatsu in Japan, chaebol in South Korea, and business houses in India, each reflecting local historical, institutional, and economic contexts.
Structurally, economic groups can be organized either horizontally or vertically. Horizontally integrated economic groups, also known as associative business groups, lack a central holding company and are linked more loosely through strategic partnerships or informal affiliations. On the other hand, vertically integrated economic groups are typically owned by a single or majority investor and follow a pyramidal structure, with a central entity exerting control over multiple layers of subsidiaries (Leff, 1978). These organizational forms have significant implications for market behavior, competition, and corporate governance, particularly in emerging and developing economies.
Economic groups in Latin America play a significant role in national economies, contributing notably to GDP. These groups benefit from strategic advantages, such as dominance over local distribution channels, swift access to financial resources to seize market opportunities, and the ability to produce at lower unit costs (Groose & Mesquita, 2007). In this context, EGs contribute meaningfully to employment generation, technological development, production, and exports. In many cases, economic groups operate as monopolies or oligopolies, maintaining their dominance over several decades. Although they face competition from international firms, local economic and political barriers often favor domestic groups, reinforcing their control over key markets. The economic impact of economic groups on national growth, however, is a complex phenomenon. Previous studies, such as those by Katircioglu (2006, 2009, 2010), used Granger causality models to examine the contributions of sectors like agriculture, tourism, and trade to GDP. Building upon this methodological foundation, the present study introduces a model tailored to assess the contribution of Ecuadorian economic groups to the country’s GDP over time. This empirical approach is grounded in the available data and enables the evaluation of the evolution and structural role of economic groups in Ecuador’s economy.
Ecuadorian Economic Groups
The study of economic groups and their influence on economic concentration in Ecuador dates back to the 1970s. Over the decades, scholars have analyzed the structural evolution, ownership patterns, and economic significance of these groups in various sectors. Table 1 provides a summary of the principal findings from key historical research on Ecuadorian economic groups.
Previous Studies of Ecuadorian Economic Groups.

Ecuadorian economic groups represent conglomerates and networks of firms that are owned and controlled by a common source. These entities operate across multiple economic sectors and industries, contributing to their growing prevalence, economic importance, and influence within the national financial landscape. Based on this context, the study proposes the following hypotheses:
Despite the historical and institutional significance of Ecuadorian economic groups, the existing literature remains largely descriptive and outdated, with a primary focus on ownership structures and their historical development. In contrast, this study offers a contemporary, data-driven analysis that utilizes recent empirical evidence to examine the evolution, financial disparities, and macroeconomic implications of Ecuadorian economic groups in the aftermath of the COVID-19 pandemic. Where earlier research, such as those by CEDIS (1986), Fierro (2019a), Navarro (1975), Unda and Bethania (2010), relied mainly on descriptive and conceptual approaches, this study introduces methodological advancements by employing well known statistical techniques, including quartile analysis and t-tests. These tools enable a more nuanced understanding of the financial stratification within Ecuadorian economic groups.
Recent studies have begun incorporating methods such as quartile distribution analysis (to categorize economic groups by the number of constituent individuals and firms; Cañas, 2015), as well as correlation (Solano & Tobar, 2017; Tobar & Solano, 2017; Tulcanaza-Prieto, 2018; Tulcanaza-Prieto & Morocho-Cayamcela, 2021) and regression techniques (Villarruel-Meythaler et al., 2019) or panel data (Granda, 2021) to explore their relationship with macroeconomic variables. Others have taken a more descriptive approach to examine their role in the national economy (Cañas, 2015; Vanoni & Rodríguez, 2017) and their financial evolution (Fierro, 2019b). While earlier studies examined Ecuadorian economic groups using data from previous periods, this study fills a critical gap by utilizing the most recent data from official government sources. This approach allows for a more current and accurate understanding of recent trends and the evolving dynamics of economic groups in Ecuador.
Building on this foundation, the present research analyzes financial performance across quartiles, assesses the fiscal responsibility and economic influence of these groups, and evaluates their geographic concentration by planning zones and provinces, highlighting a marked spatial clustering in key economic regions. It further explores the internal composition of these groups based on ownership type, distinguishing between natural persons, domestic firms, and foreign firms. Importantly, the study captures emerging post-pandemic trends by examining how COVID-19 has reshaped the representativeness, tax burden, and asset concentration of economic groups in Ecuador, dimensions that have received limited attention in previous research.
Data and Methodology
Data on Ecuadorian economic groups were obtained from the official website of Servicio de Rentas Internas del Ecuador (2020), while socioeconomic data were sourced from Banco Central del Ecuador (2021) and Instituto Nacional de Estadística y Censos (2021). The Ecuadorian economic groups dataset includes: (i) ranking information from 2016 to 2021 and (ii) financial and fiscal variables covering the years of 2015 to 2020. However, due to the unavailability of firms’ financial and fiscal reports for 2017 on the public server, data from that year were excluded from the analysis. The final sample consists of 1,330 firm-year observations corresponding to Ecuadorian economic groups.
Using the data from rankings of 2017 and 2021, the composition of Ecuadorian economic groups is outlined in Table 2. From 2017 to 2021, Ecuadorian economic groups saw a 40.47% increase, with their membership structure consisting of 64.90% national firms, 19.54% foreign firms, 11.70% Ecuadorian natural persons, and 3.86% foreign persons. The total number of Ecuadorian economic group members grew by 27.34% from 7,126 members in 2017 to 9,074 in 2021. Notably, 11.25% of Ecuadorian economic groups in 2017 and 10.48% in 2021 were located in tax havens, owned offshore firms, operated financial institutions, or controlled media entities. These entities are particularly attractive to individuals and firms due to favorable tax regulations (Servicio de Rentas Internas del Ecuador, 2015), which grant them significant privileges.
Membership Composition of the Ecuadorian Economic Groups.

Source. Author’s calculations based on official data.
Note. Rk = ranking.
These trends reflect the expansion and increasing concentration of economic groups both domestically and internationally, along their growing economic and political power (Tulcanaza-Prieto & Morocho-Cayamcela, 2021). The 2021 ranking revealed that Almacenes Juan Eljuri had the largest share of Ecuadorian economic group members in tax havens, accounting for 9.89% of the total of members domiciled in such jurisdictions, and owning 10.61% of offshore firms. In the financial sector, Banco Pichincha, Exportadora Bananera Noboa, and Grupo Futuro emerged as the most significant Ecuadorian economic groups representing 31.11% of the total. Additionally, five Ecuadorian economic groups (Almacenes Juan Eljuri, Ayasa, Grupo TV Cable, Ecuavisa, and Teleamazonas) accounted for 45.45% of the total members connected to media institutions.
The study proposes the following analyses: (i) a comparative analysis of the evolution of the Ecuadorian economic groups from 2015 to 2020, (ii) a focused examination of the top 10 Ecuadorian economic groups, assessing their economic performance and representativeness within the national context, and (iii) a t-test for the equality of means across Ecuadorian economic groups, disaggregated by quartile, to identify significant financial disparities. The financial variables analyzed include total assets, total equity, total income, total tax collection, and total income tax.
The t-test are conducted as two-sample, two-tailed statistical hypothesis tests to determine whether significant differences exist between the means of two groups. The null hypothesis (Ho) assumes no difference between the mean values of a given variable in the two groups. In contrast, the alternative hypothesis (H1) suggests a statistically significant difference (Gujarati, 1988). The t-score is calculated using Equation (1). A p-value ≤ .05 is considered statistically significant. If the calculated t-score exceeds the critical value from the Student’s t-distribution, the null hypothesis is rejected, supporting the study’s second hypothesis regarding mean differences between quartiles.

Where
To analyze economic concentration, particularly within economic groups, the t-test serves as a valuable tool for comparing the means of financial variables across different quartiles. This method enables the assessment of whether economic groups in higher quartiles demonstrate significantly different levels of financial performance compared to those in lower quartiles. Given that economic groups differ in size, market power, sectoral focus, and geographic distribution, the t-test is especially well-suited for economic research (Furió & Alonso, 2008; Gujarati, 1988; Horna et al., 2009; Pindyck & Rubinfeld, 2001). It allows for testing hypotheses related to economic performance and concentration metrics (e.g., income, assets, tax contributions, and sectoral dominance), both across time and under varying policy contexts.
In parallel, quartile analysis complements the t-test by offering a more nuanced, stratified view of the dataset. This is particularly critical in highly skewed economies like Ecuador, where a small number of dominant economic groups control a disproportionate share of the national economy. By classifying economic groups into quartiles based on variables such as total income, asset value, or tax contribution, researchers can gain insights into the distribution of economic power, uncover patterns of inequality and concentration, and identify sectoral or regional clustering within top-performing groups (Katircioglu, 2010; Tulcanaza-Prieto & Morocho-Cayamcela, 2021).
Together, these methods offer a robust framework for analyzing structural imbalances in the economic system and understanding how dominance is maintained and reproduced among elite economic actors.
Results
Ecuadorian planning zones are administrative units conformed by groups of provinces or metropolitan districts, created to facilitate the decentralization of government activities. These nine planning zones collectively encompass the 24 Ecuadorian provinces. As shown in Figure 1, the number of Ecuadorian economic groups increased significantly from 17 in 2007 to 302 in 2021. Between 2015 and 2021, the number of Ecuadorian economic groups rose from 125 to 302, marking a 141.60% increase. According to the 2021 rankings, Zones 8 and 9 accounted for195 Ecuadorian economic groups, representing 81.13% of the total. This highlights the concentration and centralization of economic power in Ecuador’s largest urban centers: Quito, the capital (located in Zone 9) and Guayaquil, the country’s main port city (located in zone 8). Servicio de Rentas Internas del Ecuador (2020) registers the location of each Ecuadorian economic group based on the fiscal address reported in tax declaration. This data shows that most business quarters are located in the following provinces: Pichincha (153), Guayas (92), Loja (19), Manabí (14), Azuay (13), Tungurahua (9), Imbabura (1), and Orellana (1). The sustained and significant increase in the number of Ecuadorian economic groups is closely linked to the implementation of fiscal and regulatory policies by the Ecuadorian governmental agencies (Vanoni & Rodríguez, 2017).
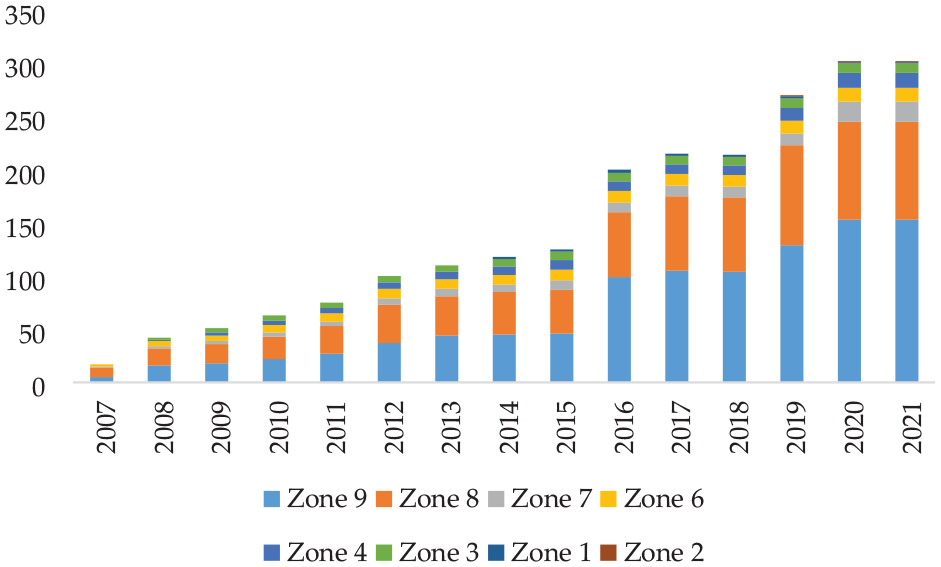
Evolution of the Ecuadorian economic groups per planning zone.
According to the 2021 ranking, Ecuadorian firms and natural persons represent 77.85% of the total membership in Ecuadorian economic groups (66.04% and 11.81%, respectively), while foreign firms and foreign persons account for 18.45% and 3.70%, respectively. This distribution highlights the importance of analyzing the economic in which national firms of Ecuadorian economic groups are involved (Table 3).
National Firms of Ecuadorian Economic Groups Classified According to ISIC Revision 4, Ranking 2021.

Source. Author’s calculations based on official data.
Using the ISIC revision 4 classification, national firms in Ecuadorian economic groups are predominantly concentrated in the following five sectors: K (23.00%), G (17.01%), A (11.48%), C (11.08%), and L (9.90%). Together, these five sectors represent 72.48% of the national firms’ involvement in Ecuadorian economic groups. These sectors are also aligned with the contribution of economic sectors to Ecuador’s real GDP in 2020. Specifically, eight key sectors contributed nearly 69.49% to the GDP, though not directly classified by ISIC revision 4 as economic sectors. These include: manufacturing (11.97%), trade (10.17%), education, social and health services (9.30%), oil and mining (9.01%), agriculture, livestock, hunting, and forestry (8.25%), construction (7.12%), public administration and defense (6.86%), and transportation (6.80%). In contrast, financial services represented just 3.47% of Ecuador’s real GDP in 2020. These economic trends reflect the broader of the COVID-19 pandemic, which significantly disrupted the Ecuadorian economy. As a result, the economy contracted by 7.79% compared to the previous year. This contraction was primary driven by reductions in the following areas: (i) formation of gross fixed capital, (ii) household consumption expenditures, (iii) government consumption spending, and (iv) exports of goods and services. Specifically, the gross value added by the financial services sector declined by 2.71%, with the value of credit operations reaching USD 9.7 million, which was 17.09% lower than the USD 11.7 million in 2019.
Moreover, Servicio de Rentas Internas del Ecuador (2020) identified 114 intra-relationships between Ecuadorian economic groups (Table 4). These intra-links occur when firms belong to at least two Ecuadorian economic groups, whether within the same or across different economic activities. Of these, 78.07% involved firms from different ISIC sections, while 21.93% belonged to the same category. Notably, the transportation and storage sector (section H) was the only economic activity where intra-relationship were confined to the same category. In contrast, intra-relationships involving firms from different economic activities were observed across sex sections: B, E, I, J, L, and M. The most interconnected economic activity was manufacturing, which has links with six other sections: A, E, F, G, K, L, and M.
Firms that Belong to at Least Two Ecuadorian Economic Groups, ISIC Revision 4, Ranking 2021.

Source. Author’s calculations based on official data.
Economic diversification is critical for long-term development because countries with a more diverse production and trade structure are better positioned for sustained growth. However, many developing countries, including Ecuador, remain heavily dependent on natural and non-renewable resources. This dependence leads to more concentrated economic structures, which are vulnerable to sector-specific shocks, such as weather-related changes or fluctuations in commodity prices.
Table 5 presents the evolution and relationships between macroeconomic and financial variables from 2015 to 2020. Over this period, the total income tax and total tax collection of Ecuadorian economic groups decreased by 24.25% and 13.67%, respectively. However, most of their financial variables showed growth. Specifically, the total assets and total equity of Ecuadorian economic groups increased by 37.89% and 35.19%, respectively, while the total income declined by less than 1%. On average, the total income of Ecuadorian economic groups represented 62.61% of Ecuador’s GDP, and their total tax collection accounted for an average of 5.80% of the current GDP.
Macroeconomic and Financial Variables (in USD Millions).

Source. Author’s calculations based on official data.
Note. The total debt of the Ecuadorian economic groups and information from 2017 were not reported (Servicio de Rentas Internas del Ecuador, 2020).
Additionally, Ecuadorian economic groups contributed, on average, 48.39% of the total national net collection, with their income tax (direct tax) contribution being 11.78% of the national total. The effective tax rate, calculated as the ratio between total tax collection and total income for Ecuadorian economic groups, was 10.50% in 2015 and decreased slightly to 9.13% in 2020. This suggests that for every USD 100 earned by Ecuadorian economic groups, they paid approximately USD 10.50 in taxes in 2015, which decreased to USD 9.13 in 2020. Furthermore, the tax burden, calculated as the ratio of income tax to total income, decreased by 0.54 percentage points from 2.28% in 2015 to 1.74% in 2020. These findings support our first hypothesis, indicating that while tax collection from Ecuadorian economic groups have decreased, their financial strength, measured by assets and equity, has continued to grow.
Table 6 shows the top 10 Ecuadorian economic groups ranked by total assets. Nine of these 10 groups maintained their positions in the top 10 between 2016 and 2021, indicating strong stability among the country’s largest conglomerates. In 2021, these top 10 Ecuadorian economic groups accounted for 43.66% of the total assets held by all Ecuadorian economic groups, and their combined assets represented, on average, 49.17% of Ecuador’s current GDP. In terms of fiscal relevance, these groups also contributed significantly to national revenues. On average, their total assets corresponded to 24.66% of the national net tax collection and 10.77% of the total assets across all Ecuadorian economic groups.
Top 10 Ecuadorian Economic Groups Ranked by Total Assets (in USD Millions).

Source. Author’s calculations based on official data.
Note. Rk = ranking. Information from 2017 (including the ranking of 2018) was not reported on (Servicio de Rentas Internas del Ecuador, 2020).
A dominant trend among these top performers is the prevalence of the financial and insurance sector, which constitutes the main economic activity of five out of the ten largest Ecuadorian economic groups. In 2021, these five financial institutions represented 68.38% of the total assets of the top 10 Ecuadorian economic groups and 29.60% of total Ecuadorian economic group assets. Their average tax contribution in 2020 was 25.22% of total national tax collection, reaffirming the banking sector’s central role in Ecuador’s fiscal system. This trend is aligned with the sector’s consistently high return on equity (ROE), an indicator of efficient resource utilization. In 2020, the banking sector reported a ROE of 12.3%, slightly above the national average across productive sectors (11.9%). According to Servicio de Rentas Internas del Ecuador (2018), financial and insurance activities ranked second in national tax contribution for 16.21%, equivalent to USD 16 for every USD 100 collected.
Table 7 ranks the top 10 Ecuadorian economic groups by total tax contribution. Six of these groups remained in the top 10 from 2016 to 2021, indicating persistent fiscal influence over time. Between 2015 and 2020, national net tax collection, total Ecuadorian economic groups tax contributions, and tax revenue from the top 10 Ecuadorian economic groups (by fiscal weight) declined by 9.63%, 13.67%, and 8.45%, respectively. Still, on average, these top 10 groups contributed 43.41% of the total tax revenue from all Ecuadorian economic groups and 21.00% of the total national net tax collection. Their average tax contribution as a share of GDP over the study period was 2.52%.
Top 10 Ecuadorian Economic Groups Ranked by Tax Collection (in USD Millions).
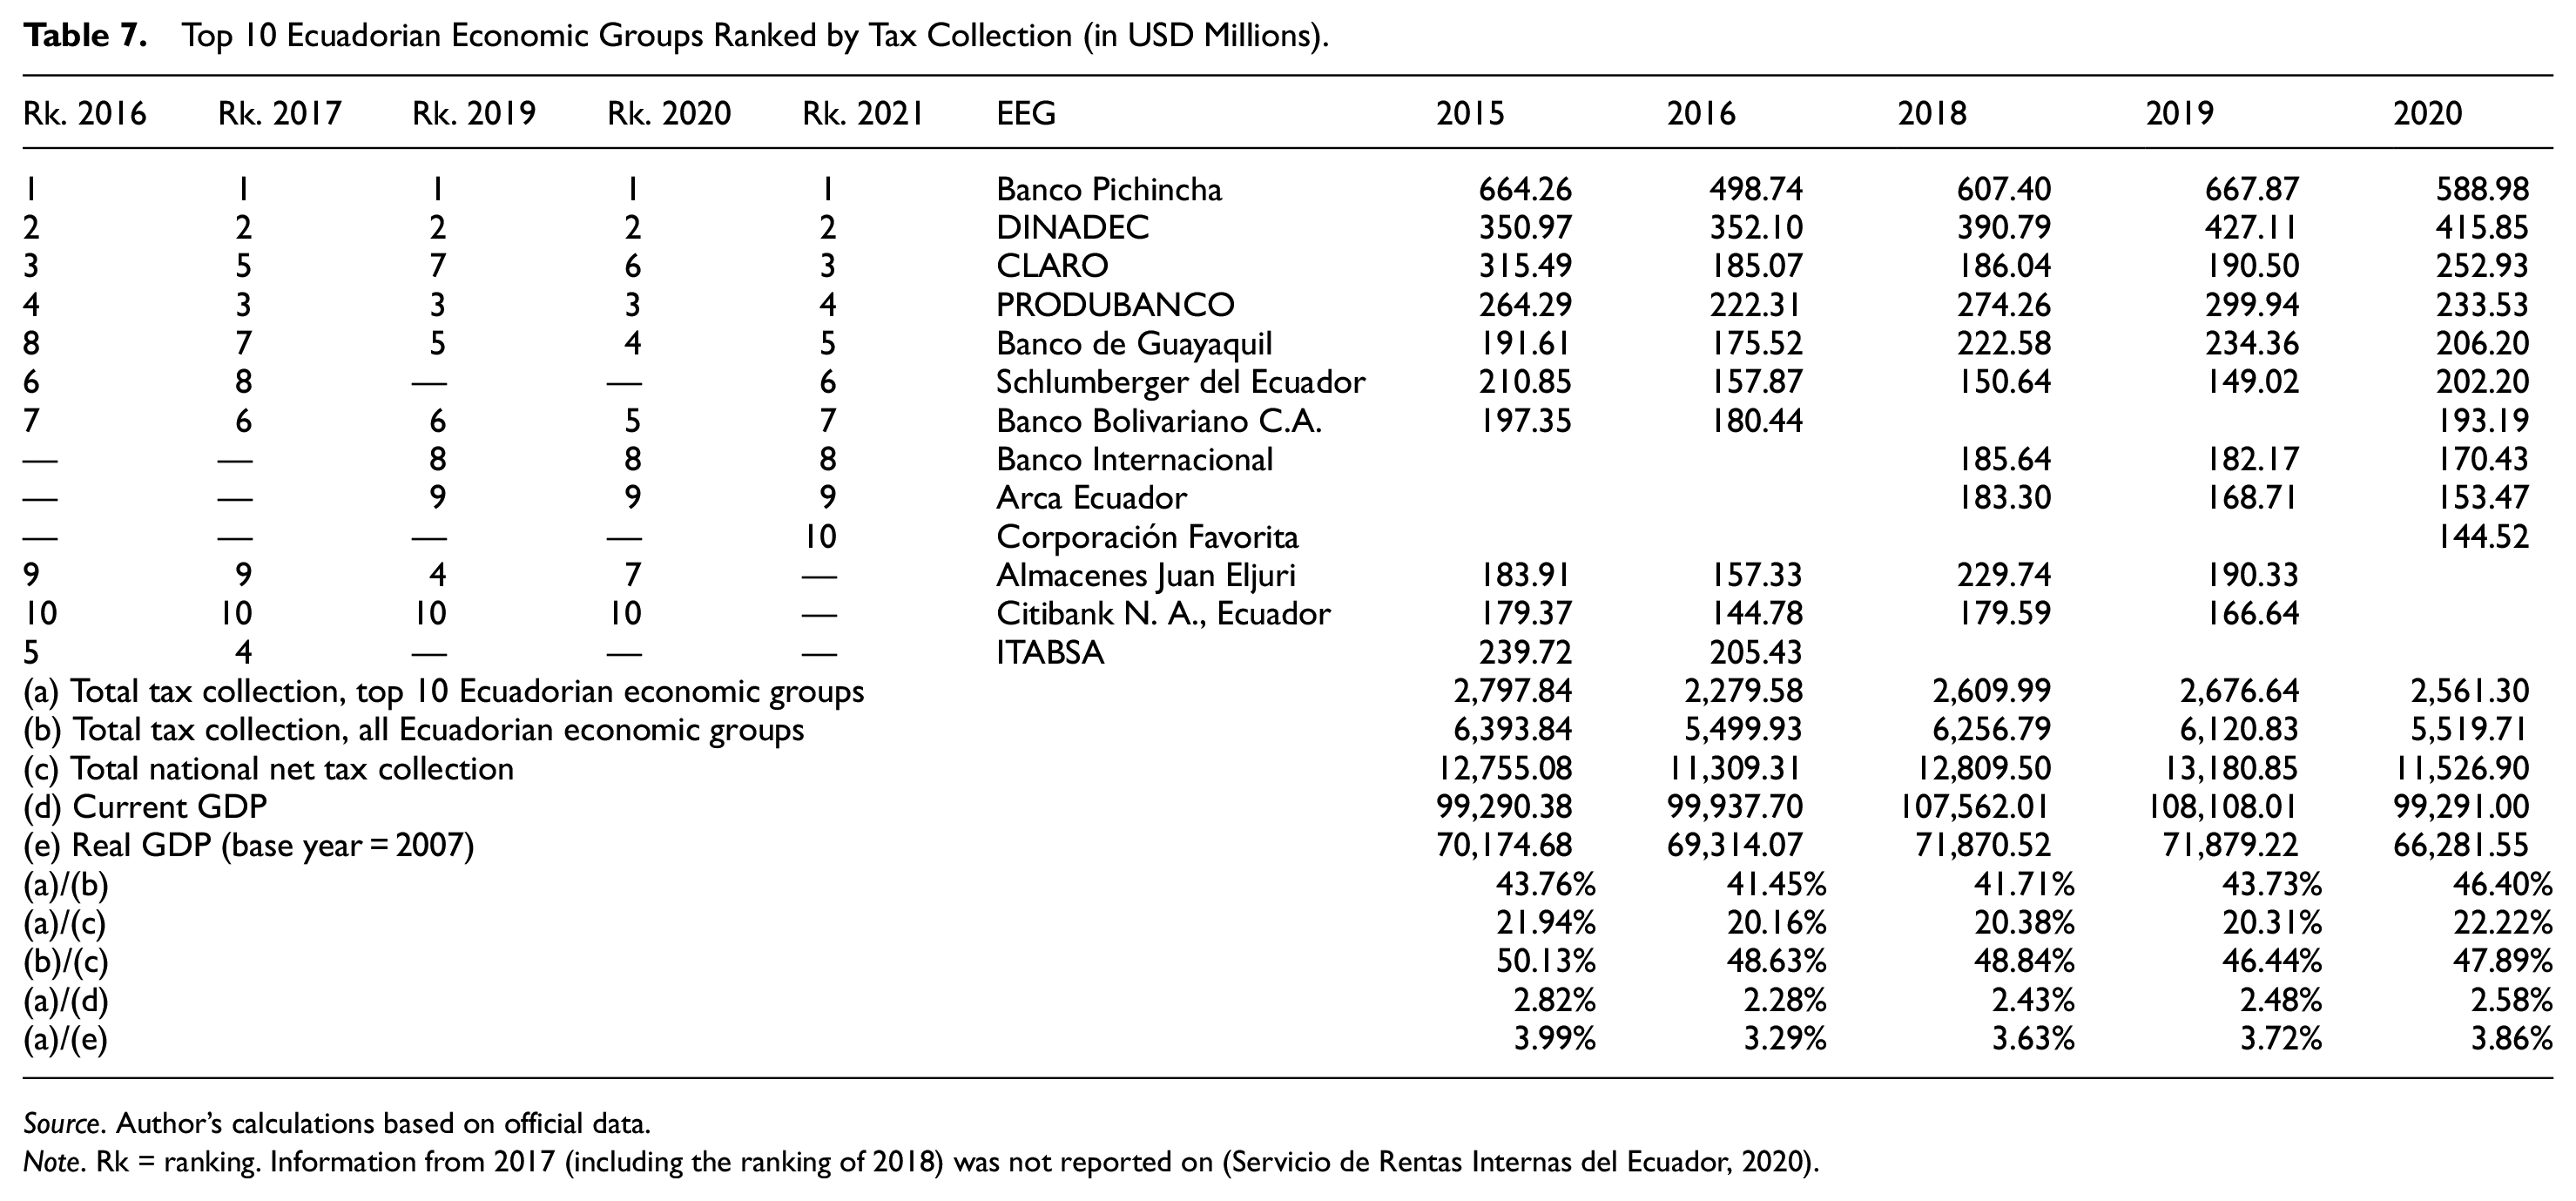
Source. Author’s calculations based on official data.
Note. Rk = ranking. Information from 2017 (including the ranking of 2018) was not reported on (Servicio de Rentas Internas del Ecuador, 2020).
A comparison of Tables 6 and 7 reveals that seven Ecuadorian economic groups appeared in both rankings in 2021: Banco Pichincha, Banco Guayaquil, Produbanco, Banco Bolivariano, Banco Internacional, Corporación Favorita, and Schlumberger. Five of these seven belong to the financial and insurance sector (category K). Collectively, these seven groups accounted for 34.73% of total Ecuadorian economic groups assets, 31.51% of total Ecuadorian economic groups tax contributions, and 15,09% of the national net tax collection in 2021, underscoring their dual dominance in both economic and fiscal dimensions.
Table 8 presents a comparative summary of the financial characteristics of Ecuadorian economic groups, disaggregated by quartiles for the years 2015 and 2020. Quartile analysis is a critical analytical tool that enables researchers to: (i) understand the distribution of data, (ii) evaluate data dispersion, (iii) assess the shape of distributions, (iv) perform cross-sectional comparisons, and (v) identify potential outliers or structural disparities.
T-test for Equality of Means for Financial Variables of Ecuadorian Economic Groups Disaggregated by Quartile (in USD).

Source. Author’s calculations based on official data.
Note. ***, **, and * indicate statistical significance at the 1%, 5%, and 10% levels, respectively.
The analysis reveals that, on average, financial variables across Ecuadorian economic groups in 2015 exhibited higher values compared to 2020, with a few exceptions. Quartile 4 recorded increases in both total assets and total equity, and quartile 1 showed a marginal rise in total equity between 2015 and 2020. However, these increases were not statistically significant. Significant differences at the 5% level were identified in quartiles 2 and 3 for all financial variables. In particular, the average total assets of Ecuadorian economic groups declined significantly in all quartiles, except for quartile 4, which experienced a modest 3.25% increase. This suggest a growing concentration of assets among the top-tier Ecuadorian economic groups during the study period. Similar trends were observed in total equity, with quartiles 1 and 4 showing increases of 6.61% and 0.54%, respectively, though these changes were not statistically significant. In contrast, total income declined across all quartiles, with reductions of 5.57%, 39.97%, 43.14%, and 49.66% from quartiles 4 to 1, respectively. These differences were statistically significant for all quartiles except quartile 4, emphasizing the disproportionate impact of macroeconomic shocks, such as the COVID-19 pandemic, on lower-tier groups. additionally, both total tax collection and total income tax demonstrated a consistent decrease in mean values across all quartiles from 2015 to 2020. These differences were statistically significant in every quartile, reflecting a general contraction in fiscal contributions from Ecuadorian economic groups during this period. These findings lend robust support to the study’s second hypothesis that there are statistically significant differences in the mean financial performance of Ecuadorian economic groups across quartiles, particularly between 2015 and 2020.
Discussion
Effects of Economic Concentration
Economic Effects
Taxes
The effects of economic concentration are particularly evident in the contribution of the largest taxpayers and their influence on the general state budget. In Ecuador, direct taxes are linked to the annual income of individuals and business operating within the economy. While income tax exhibits progressivity, higher rates for higher income, this contrast with the relatively non-progressiveness (or regressive) tax burden of Ecuadorian economic groups, which decreased from 2.28% in 2015 to 1.74% in 2020. This reduction indicates a decline in the tax burden relative to the income of the largest economic entities, raising concerns about tax fairness and the overall contribution of the wealthiest firms to the national fiscal system.
Integration and Diversification
Ecuadorian economic groups expand their operational scope through strategies of horizontal and vertical integration, as well as diversification across different industries. In the 2021 ranking, 114 intra-group relationships were identified among Ecuadorian economic groups, with 21.93% of these relationships occurring within in the same sector and 78.07% across different sectors. The most integrated and diversified Ecuadorian economic group was found within the manufacturing sector, which connects with at least six other sectors, including agriculture, forestry, and fishing; water supply; construction; wholesale and retail trade; financial and insurance activities; real estate activities; and professional, scientific, and technical activities.
These integration and diversification strategies enable Ecuadorian economic groups to reduce costs, secure a steady supply of inputs, minimize supplier bargaining power, and avoid intermediaries. Moreover, they provide firms with opportunity to differentiate their goods and services. By forming networks of interconnected firms, these diversified Ecuadorian economic groups extend beyond the parent firm’s primary objectives, creating broader economic influence and consolidating market power.
Profitability
According to data from the Superintendency of Companies and Ekos website (Ekos, 2023), the most profitable firms in Ecuador, ranked by total income, predominantly belong to Ecuadorian economic groups (Table 9). Notably, 74.96% of the 25 largest firms in Ecuador by total income operate in three sectors: wholesale and retail trade, mining and quarrying, and financial and insurance activities. This concentration of profitability in just a few sectors highlights the presence of monopolies and oligopolies, where dominant firms have significant control over market pricing, creating a less competitive environment. These concentrated profits within a small number of Ecuadorian economic groups further exacerbate economic inequality and underscore the challenges to market competition and fiscal policy in Ecuador.
Business Ranking 2022: The 25 Largest Firms in Ecuador Classified by Total Income (in USD Millions).

Source. Author’s calculations based on official data.
Social Effects
Employment
One of the ley social consequences of economic concentration in Ecuador is its impact on employment. The increased concentration of economic power among few large economic groups has contributed to a decline in labor intensity, the precariousness of employment conditions, growing informality, unemployment, and underemployment. These outcomes reflect the structural complexity of the Ecuadorian labor market and its limited capacity to absorb a growing supply within the formal productive sectors. As a result, labor conditions have become increasingly deregulated, often leading to the substitution of labor with capital, workforce reductions, and the use of informal hiring schemes. Although the national unemployment rate remained relatively stable between 2015 and 2020, averaging around 4.85%, it decreased slightly to 4.10% in December 2021. However, this apparent stability marks deeper labor market issues. In 2020, the employment rate was 30.40%, while the underemployment rate reached 22.9%, indicating that a significant portion of the population remains in vulnerable or suboptimal employment conditions.
Poverty
Income and consumption concentration in Ecuador have also contributed to persistent poverty and inequality. As of December 2020, the official monthly poverty and extreme poverty lines were set at USD 84.05 and USD 47.37 per capita, respectively. Based on these thresholds, the national income poverty rate stood at 32.40%, with a marked disparity between urban areas (25.1%) and rural areas (47.9%). The Gini coefficient, a widely used measure of income inequality, further highlights the unequal distribution of oncome in the country. In 2020, the Gini index was 0.50 nationally, 0.48 in urban areas, and 0.47 in rural areas. These figures underscore the challenges of ensuring equitable income distribution in an economy characterized by high levels of concentration among a few dominant economic groups.
Corporate Social Responsibility (CSR)
CSR refers to the voluntary and proactive efforts of firms to contribute to social, economic, and environmental development, aiming to enhance societal well-being while also adding value to the firms through competitiveness and expansion strategies (Tulcanaza-Prieto et al., 2020). Most Ecuadorian economic groups engage in CSR initiatives through various mechanisms, including: (1) foundations or non-profit institutions directly owned and operated by the economic group, (2) flagship firms with the group that lead social, educational, or economic campaigns, often branded as initiatives of the entire group, and (3) financial sponsorships and support provided through corporate or affiliated financial institutions. These CSR activities are typically focused on areas such as education, healthcare, environmental sustainability, vocational and technical training, arts and culture, micro-enterprise support, sports, and employment promotion. While these efforts play a sportive role, they also serve to bolster the public image of Ecuadorian economic groups, which can be strategically aligned with their broader market and political influence.
Legal Effects
The emergence and consolidation of economic groups in Ecuador have significantly influenced the evolution of the country’s legal and regulatory framework. Since the enactment of the Constitución de La República Del Ecuador (2008), foundational elements for the recognition and formation of economic groups were established, laying the groundwork for their legal status and oversight. Subsequently, a series of legislative reforms have aimed to address the incentives, regulation, and control of corporate entities, particularly those with significant economic power, such as the Código Orgánico de La Producción, Comercio e Inversiones (2010), which introduced various incentives to promote production and investment, particularly benefiting large corporate firms. In addition, Ley Orgánica de Regulación y Control Del Poder de Mercado (2011) established mechanisms to prevent anti/competitive practices and regulate market dominance, with a specific focus on economic groups. Also, the Ley Orgánica de Incentivos a Producción y Prevención de Fraude Fiscal (2015) and Reglamento Para La Ley Orgánica de Incentivos a Produccion y Prevención de Fraude Fiscal (2015) aimed to enhance tax control and prevent fiscal fraud, particularly targeting practices such as profit shifting and tax base erosion. Then, the Reglamento Para La Ley Orgánica de Regulación y Control Del Poder de Mercado (2017) strengthened regulatory tools for monitoring the behavior of dominant market players. Additionally, the Reglamento Para La Aplicación de La Ley de Régimen Tributario Interno (Updated; 2018) included specific provisions to ensure clearer tax obligations for economic groups. Finally, the Ley de Compañías (Updated, 2023) updated corporate governance norms, including elements related to the structure and transparency of economic groups.
Despite these legal developments, the findings of this study highlight the persistent gap between regulatory intent and practical enforcement. While economic groups have expanded significantly in both assets and market influence, their relatively tax contributions have declined over time. This disconnect suggests the current legal instruments may be insufficiently robust or effectively enforced to ensure that economic groups contribute to national taxation in proportion to their economic power and profitability. Consequently, further legislative strengthening is necessary, particularly in areas concerning anti-monopoly regulation, tax justice, and transparency. More effective legal oversight is essential to ensure that economic groups not only comply with fiscal obligations but also operate within fair and competitive market conditions.
Policy Effects
The empirical results underscore the sustained dominance of a small number of powerful, family-owned economic groups across key sectors of Ecuador’s economy. This concentration of economic power, both geographically and sectorally, highlights the limitations of current tax enforcement and regional development policies, which have failed to curb inequality or effectively promote economic decentralization. The findings point to significant structural imbalances. For example, the geographic clustering of economic power in just two provinces raises serious concerns about the inclusiveness and effectiveness of Ecuador’s regional development strategies. Additionally, the identification of legal loopholes and weak tax oversight underscores the urgent need for fiscal reforms, particularly in strengthening enforcement mechanisms and closing gaps that allow tax avoidance by dominant groups.
Importantly, the study offers concrete policy directions: (1) implementing equitable tax reforms, (2) designing regionally inclusive development policies to address over-concentration, and (3) fostering sectoral diversification and competition through regulatory improvements and targeted public investment. These recommendations are not only consistent with broader development goals but also support increased transparency and more democratic economic governance. While the study could benefit from a more explicit policy discussion, its findings provide a solid foundation for engaging with current policy debates and shaping future reform agendas centered on equity, accountability, and balanced national development.
Conclusion
The significant growth in the number of Ecuadorian economic groups from 2007 to 2021, especially after 2015, can be attributed to improved fiscal and regulatory policies implemented by government entities. This finding supports our first hypothesis regarding the evolution of Ecuadorian economic groups in response to institutional reforms. However, despite this expansion, a considerable portion of these groups remains under the control of a few powerful families. As highlighted by various authors (Programa de las Naciones Unidas para el Desarrollo, 2021; Villarruel-Meythaler et al., 2019), such concentration of economic power can exacerbate social inequalities, disproportionately affecting marginalized and low-income populations, and may hinder inclusive economic development.
Although financial indicators of Ecuadorian economic groups have shown growth during the period of analysis, their total tax contributions have declined by 13.67%. This divergence suggests the persistent influence of offshore structures and tax havens affiliations, an issue previously noted by Báez (2017). Despite some regulatory improvements, Ecuador continues to lack a comprehensive tax policy with effective enforcement mechanisms to monitor and curb tax avoidance practices by these powerful entities. This raises concerns about fiscal equity and governance, and it underscore the need for further investigation into the real tax burden of Ecuadorian economic groups and the role of aggressive tax planning.
The diversified and dynamic models of Ecuadorian economic groups, evident their cross-sector participation, are often part of deliberate risk diversification and growth strategies. Tables 2 and 3 illustrates this sectoral breadth, while intra-group relationships detailed in Table 4 show how Ecuadorian economic groups leverage shared resources, technology, and knowledge to optimize costs and enhance market presence. These interconnections reflect a strategic consolidation that may also serve to concentrate market power.
The economic contraction of 2020 had a measurable impact on Ecuadorian economic groups, as shown in the quartile-based financial analysis in Table 8. Most financial variables recorded higher mean values in 2015 than in 2020, with statistically significant differences in several quartiles. These findings provide strong support for our second hypothesis. Lastly, a notable methodological limitation of this study was the unavailability of financial and fiscal data for 2017 due to server-related issues at Ecuador’s Internal revenue Service. This gap constraints the ability to fully trace year-on-year trends and highlights the importance of institutional data transparency for further research.
This study enhances the theoretical understanding of the evolution of economic groups in emerging economies like Ecuador by analyzing their structural composition, geographic concentration, sectoral diversification, and intergroup interrelations. Building on classic theories (Dahse, 1981; Leff, 1978; Vito, 1935), it incorporates modern empirical tools, such as quartile-based financial analysis and t-tests, to provide a more systematic and quantitative approach compared to the largely descriptive nature of previous studies.
From the research perspective, the study makes a notable contribution to corporate governance and economic concentration theories within the Latin American context by highlighting how family-owned and controlled economic groups maintain oligopolistic power and influence strategic decision-making across key economic sectors. It also brings a multidimensional view of economic power concentration by linking it to fiscal, geographic, and sectoral patterns. On the practical side, the study underscores the urgent need for tax policy reform, stronger enforcement mechanisms, and the closing of legal loopholes frequently exploited by dominant economic groups. The evidence of heavy geographic concentration, particularly in the provinces of Pichincha and Guayas, positions this research as a valuable reference for designing regional development policies aimed at reducing economic centralization and promoting inclusive growth in underrepresented areas. Additionally, by identifying five dominant economic sectors (e.g., finance, trade, agriculture, manufacturing, and real estate), the study offers strategic guidance for public investment priorities and foreign investment decisions, aligning economic policy with national development goals. On a societal level, the findings shed light on the structural inequalities embedded in Ecuador’s economic landscape. The sustained dominance of a few powerful groups poses challenges to inclusive development, competitive markets, and democratic governance. By informing both policy debates and public discourse, this study serves as a foundation for advocating more equitable economic reforms, promoting transparency, and fostering broader participation in the national economy.
Future research could pursue a comparative analysis of economic groups across Latin American countries to identify regional patterns, regulatory differences, and the broader impact of these groups on economic development. Such an approach would offer valuable insights into how national contexts shape the structure and influence of economic groups. Additionally, a deeper investigation into the use of tax havens and offshore structures by Ecuadorian economic groups could shed light on mechanisms of tax avoidance. This would be particularly relevant for informing the design of stronger and more effective fiscal policies. Finally, exploring the business innovation models adopted by Ecuadorian economic groups and understanding how these are perceived by potential customers could provide meaningful insights into the drivers of innovation within these firms. Such analysis would help clarify their role in promoting economic growth and enhancing national competitiveness.
Footnotes
Funding
The author(s) disclosed receipt of the following financial support for the research, authorship, and/or publication of this article: We extend our gratitude and acknowledgment to the Universidad de Las Américas, which financially supported this research (520.B.XV.24).
Declaration of Conflicting Interests
The author(s) declared no potential conflicts of interest with respect to the research, authorship, and/or publication of this article.