
Abstract
This study analyzes the leverage policies of the family and non-family firms of eight East Asian Economies (Hong Kong, Indonesia, Japan, Korea, Malaysia, Philippines, Singapore, and Taiwan) by using combined data of 690 family and non-family firms with 3,224 firm–years over the period 2006–2010. This study has used an ordinary least squares (OLS) regression for analyzing the data for the first question, while for the second question, logit regression has been used as the dependent variable (a binary variable). Prior research on family and non-family firms has revealed that family firms issue less (high) debt than non-family firms. Our analysis on a sample of East Asian Economies discloses that family firms have significantly different leverage levels than non-family firms, but their signs are not consistent. On the contrary, when the owner works as CEO/Chairman or member of the Board of Directors, then the family firms issue less debt than the non-family firms. Besides that, this study adds a new question that has not been addressed in the prior studies. The new question has focused on the speed of leverage adjustment. It is found that family firms and non-family firms regarding their debt maturity structure (short-term debt and long-term debt), the speed of leverage adjustments, and their decision to issue securities (i.e., debt vs. equity) are not significantly different. This study concluded that though family firms have a strong influence on each economy, but in South-East Asian countries, leverage policies of the family firms are not much different than that of non-family firms.
Introduction
The family founders or their heirs control a large number of firms around the world. Family firms are playing a significant role in the economy of each country; therefore, they have gained increasing attention by both finance and economics researchers (Anderson & Reeb, 2003; Bennedsen et al., 2007; Buvanendra et al., 2017; La-Porta et al., 1999; Pérez-González, 2006, among others). Family ownership is widespread among privately held firms. A large number of firms in almost every region, that is, Western Europe, South-East Asia, the Middle East, Latin America, and Africa, are managed and controlled by families or their heirs (Burkart et al., 2003). Many of the prior studies have revealed that family firms perform better than others because of the involvement of owners in the management of the firm, that is, family owners or their heirs work as CEO/Chairman (Anderson & Reeb, 2003). Moreover, families may be carrying a reputation, which plays a significant role in both political and economic markets thanks to their performance, or connections (Burkart et al., 2003). Moreover, these relationships help them get external finance without difficulty. Hence, family firms tend to have better access to the capital market (Murro & Peruzzib, 2019).
This study endeavors to provide empirical evidence on leveraging in family and non-family firms by comparing the market and book debts. This study addresses two important questions: (a) Do family firms have lower or higher leverage ratios than non-family firms? and (b) Do family firms differ in adjusting their debt or stocks more or less frequently than non-family firms? Previous studies on leveraging of family firms (e.g., Anderson & Reeb, 2003; González et al., 2013; King & Santor, 2008; Mulyania et al., 2016) attempted to answer the first question only. The focus of this study is to address the first question with a more extensive look by adjusting core firm characteristics and applying both book debt and market debt to analyze the leverage level.
The sample used in the study consists of family and non-family firms from East Asian Economies (notably Hong Kong, Indonesia, Japan, Korea, Malaysia, Philippines, Singapore, and Taiwan) for the period from 2006 to 2010. East Asian countries have played a significant role in the world economy. Especially in the past, Asian countries like China, Hong Kong, Malaysia, and Taiwan held strong economic growth. Corporate governance issues became more focus for these countries after the Asian financial crisis of 1997–1998. Moreover, most of these countries hold a significant number of family firms. These are a few major reasons behind selecting these countries. To construct the data set, we used Carney and Child’s (2013) data set of ultimate ownership and then hand-matched it with financial data of firms from Worldscope. In the primary analysis, the study used ultimate ownership data at 10% threshold level. For robustness reasons, we used 20% threshold level too, to analyze whether there is any difference in leverage policies by incorporating more concentrated ownership. However, the conclusion of the study remained the same.
Since Modigliani and Miller’s (1958) initial work on the analysis of a capital structure known for capital structure irrelevance proposition, a good number of studies and theories have been developed, but a few of them appear to have many advocates. Notably, most of the corporate finance books and literature discuss the “trade-off theory” that statutes the cost and benefits of using debt. Firms move toward target leverage to maintain a balance between the cost and benefits of expanding debt (Titman, 1984). Myers (1984) anticipated a pecking order theory that states the hierarchy of the firm’s financing. According to this theory, firms use retained earnings more than debt and equity as a last resort. Recently, the “market timing” theory developed by Baker and Wurgler (2002) endeavored to explain the association of capital structure with historical market prices. Finally, agency theory remained part of many discussions which focus on conflict of interest among major stakeholders of the company. While Myers (2001) opinioned that there is no universal theory of the debt-equity choice, there is no reason to accept one. Hence, the capital structure of the firms has remained a puzzle. The capital structure of family and non-family firms is a recent phenomenon, and it has an association with the agency theory. A number of studies have analyzed this aspect, but their results are mixed.
This study differs from the prior researches which examined the family and non-family firms’ leverage. First, most of the previous studies, such as Anderson and Reeb (2003), King and Santor (2008), Setia-Atmaja et al. (2009), and Psillaki and Dimitris (2010), have used book debt ratio (BDR). A few of them, such as Santos et al. (2014), have used market debt ratio (MDR). This study has included both book and market debts as a measure of financial leverage. Second, for the leverage adjustment, this study has added a new question regarding family and non-family firms. Third, most of the previous studies (Anderson & Reeb, 2003; King & Santor, 2008; Psillaki & Dimitris, 2010, among others) either used U.S. data or focused on European or other developed markets. This study has used Carney and Child’s (2013) data set about the ultimate ownership of eight East Asian Economies (Hong Kong, Indonesia, Japan, Malaysia, Philippines, South Korea, Singapore, and Taiwan).
Overall, the results suggest that family firms have significantly different debt levels than that of non-family firms, but the relationship of the family variable with leverage is inconsistent. At the second level, the study added another variable “Manage” (a dummy variable having a value of 1 if the owner works as CEO/Chairman or member of the Board of Directors). The relationship of leverage and Manage is significantly negative, explaining that in family firms when owner works as CEO/Chairman or member of the Board of Directors, he or she keeps the leverage level of a firm lower to avoid the bankruptcy cost. On the contrary, it is found that family and non-family firms do not have many variations in relation to their debt maturity, the speed of adjusting leverage, or their tendency to issue securities (i.e., among debt and equity). In conclusion, higher ownership concentration (i.e., 20% threshold level) also provided the same results. Future studies could focus on institutional variables and legal systems of the countries that could affect the leverage policies of the firms in those countries.
Rest of the study is planned as follows. The “Research Background and Questions” section sheds light on prior studies and formulates questions. The “Data and Research Design” section elaborates on data collection and research methods. While the results of the study are described in the “Empirical Results” section, the “Concluding Remarks” section of the study provides the concluding remarks.
Research Background and Questions
Since Modigliani and Miller’s (1958) initial work on the analysis of a capital structure known for capital structure irrelevance proposition, a good number of studies and theories have been developed, but only a few of them appear to have many advocates. Pecking order theory focused on the hierarchy of the firm’s financing decision; it states that firms use earning more than debt and equity as a last resort (Myers, 1984). Furthermore, trade-off theory outlines that each firm has a target leverage/debt ratio, and firms move toward that to keep a balance between choosing debt and equity by their costs and benefits.
It is acknowledged that the introduction of ultimate owners changed the old explanation of Berle and Means (1932) that states that the ownership and control of the U.S. firms are separated. It is said that agency conflicts between managers and owners have a significant impact on the performance and cost associated with it. Owners wish that manager does work for the interest of owners. Hence, in family firms, this cost is lower as both manager and owners are pronounced to be the same person (Jensen & Meckling, 1976). It has been argued that if managers’ interests coincide with that of owners, then they prefer to issue debt. As owners are reluctant to dilute their ownership, these agency conflicts determine the capital structure of the firm (Myers & Majluf, 1984). However, Berkovitch and Israel (1996) stated that corporate governance structure of the firm has a substantial role in defining the capital structure of the firm. Large shareholders and board effectiveness give positive signals to lenders. Moreover, the big-block holders have political and personal links with the banks, which facilitate them in having easier access to the debt market, as large block holders do not intend to dilute their ownership by issuing more shares (Jensen & Meckling, 1976). On the contrary, the deadweight cost of bankruptcy restricts them to lend more. Furthermore, firms’ block holders prefer less debt when it brings more monitoring (Jensen & Meckling, 1976). This study endeavors to analyze the effects of concentrated ownership on the firm’s capital structure decision.
Related Theories, Literature, and Questions
Numerous studies have been conducted to do a comparison between leverage policies amid family and non-family firms. Some of them (e.g., Anderson & Reeb, 2003) have used only BDR. However, using book leverage as a measure of leverage found that there is no difference of leverage level in the family and non-family in the United States. King and Santor (2008), by using book leverage measure on Canadian data, found that family firms in Canada tend to have higher financial leverage than their counterparts. Setia-Atmaja et al. (2009), while using data from Australian family firms and employing BDR, concluded that family firms do have a higher level of debt than non-family counterparts. Gallo et al. (2004) used BDR, and without controlling the crucial firm characteristics, they found that family business in Spain has lower debt ratios than that of non-family companies. Mulyania et al. (2016), in their analysis, used sample of Indonesian family, non-family firms, and employed a BDR. They found that in Indonesia, family firms tend to be more leveraged than their non-family counterparts. González et al. (2013) used their measures of leverage based on Rajan and Zingales (1995) by using book value as their primary measure. Their study came up with the conclusion that family firms tend to have more debt than non-family businesses. Some studies have used only market leverage measure. For example, Ampenberger et al. (2013), in their study of 660 listed German family and non-family firms, used market leverage as a leverage measure. They found that family firms have lower leverage than that of non-family firms. Agrawal and Nasser (2012), in their study, concluded that the existence of an independent director, who is blocking holders in firms, has no meaningful relationship with the debt structure of the firm. Very few studies have used both market and book measures of leverage. For example, Santos et al. (2014), while using a sample of 12 Western European countries, by using both market and book leverage as their measure found that family firms tend to issue less debt than non-family firms. Despite some developed theories, a few empirical studies tried to analyze the association between leverage and large shareholders. However, those studies could not come to a consensus about the exact relation between family block holders and leverage due to varying measures of leverage and different data sets and methodologies used. This study has explored and analyzed the leverage level of family and non-family firms extensively by using two measures of leverage. Besides that, this study has added a new question to the family and non-family firms’ research, which intends to examine the pattern of leverage adjustments and security issuance of the family and non-family firms. Security issuance (debt and equity) patterns may also vary in family and non-family businesses. If family firms can have reasonable access toward external capital markets, family firms will issue or redeem their securities with higher frequency if their target leverage or equity level is higher or lower than the current level. Hence, we aim to analyze a question that when family firms have better access to the capital market, they issue securities (do not issue securities) if they are at higher (lower) level than their target level. Thus, the two hypotheses need to be tested in this study are as follows:
Data and Research Design
Sample and Data
To examine the relationship of ownership structure and leverage, at first, we gathered ownership data of eight East Asian Economies (Hong Kong, Indonesia, Japan, Korea, Malaysia, Philippines, Singapore, and Taiwan). Availability of family firms’ data is the major concern for family firm research, but we were able to get data of nine East Asian countries from Carney and Child (2013). In this study, we have omitted the data of ninth country (Thailand) as its financial data were not enough to run regression. Carney and Child’s (2013) data set is classified into ultimate controlling shareholders, cash flow, and voting (control) rights. Financial data for this study were gathered from the Worldscope database. The data were then hand-matched with ownership data set of Carney and Child (2013). Following Attig et al. (2015), this research used data for a period from 2006 to 2010. Data were winsorized at 1% and 99% so that the results are not affected by extreme observations. Firms with insufficient financial data were dropped from the analysis. Data of financial and utility firms were excluded by using Standard Industrial Classification (SIC) codes (firms range between 6000–6999 and 4900–4949). After this procedure, we were left with 3,224 observations for 690 unique firms over the years 2006–2010.
Variables
Leverage variables
Previous studies on family and non-family firms used book or market leverage ratios. For example, King and Santor (2008), and Setia-Atmaja et al. (2009) used BDR as their primary measure. Schmid (2013) used only MDR as the measure. The opinion regarding the better measure of leverage varies. Advocates of BDR say that debtors are interested in book values, not in the growth opportunities. The markets tend to fluctuate more, which makes the number unreliable. Hence, the real value of debt could be determined by book assets. Advocates of market leverage argue that book debt values are simply plugged numbers. These are used to equalize the two sides of the balance sheet (capital structure and stock returns; Welch, 2004). Therefore, following Park et al. (2013) and Santos et al. (2014), this study used both BDR and MDR as primary measures. Following Park et al. (2013), variables used in this study are measured as follows. BDR is measured by (Lndebt + Shdebt)/TA. Here, Lndebt is the long-term debt, and Shdebt is the short-term debt, while TA is the total assets (book value). MDR is measured by (Lndebt + Shdebt)/Lndebt + Shdebt + MVE, where MVE is the market value of equity, measured by multiplying stock price to the number of shares outstanding.
Model and Method
The objective of the study is to analyze the leverage level of family and non-family firms in South-East Asian countries. The basic model of the study is based on the following equation:
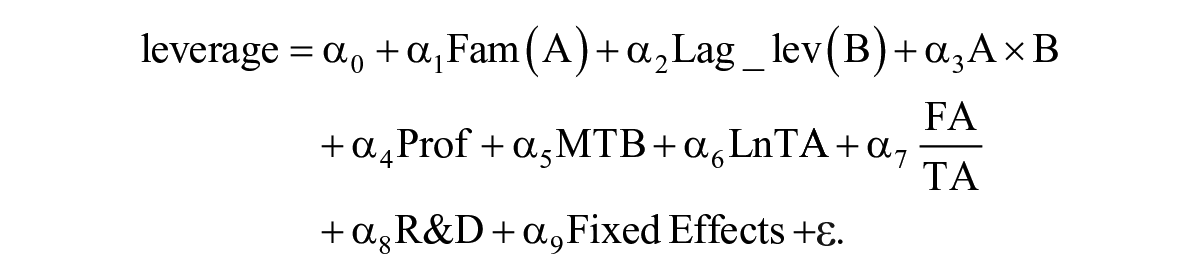
The explanation of all the variables is provided in Table 1. This study started with the basic model by analyzing the data through ordinary least squares (OLS) regression. The same has been used in the prior studies of leverage measurement, notably Ampenberger et al. (2013), González et al. (2013), and Park et al. (2013), among others. The further analysis of the study to address the endogeneity issue used a two-stage least square (2SLS) method, which is widely used in an economics and financial economics literature. Finally, the second question—that is, “Do family firms differ in adjusting their debt or stocks more or less frequently than non-family firms?”—was tested following Park et al. (2013). For the second question, this study used a logit regression method for equity (debt) issuance (non-issuance).
Description of Key Variables Used in the Study.

Family Control
Following Attig et al. (2015) and Lins et al. (2013), a dummy variable was created for a proxy of family control. A dummy variable “Family” has value 1 if the ultimate owner is a family, and 0 otherwise. This study added another variable “Manage” (a dummy variable having a value of 1 if the owner works as CEO/Chairman or member of Board of Directors, and 0 otherwise). Carney and Child (2013) classified ultimate ownership at 10% and 20% threshold level. The primary analysis of the study used the family firm at 10% threshold level.
Control and Other Variables
In this study, the firm-level control variables have been used by following Park et al. (2013). Table 1 defined the variables used in the study.
Empirical Results
Table 2 summarizes the sample distribution by country, year, and industry (using Fama–French’s 12 industries). Among the sample countries from East Asia, Taiwan has the largest proportion of sample firms (16.72%). On the contrary, the Philippines represent the least number of firms, which contributed 6.82%. Among industries, the business equipment industry represents the highest number of observations (17.43%), while telephone and television transmission, and energy, oil, gas, and coal extraction have the least observations, 1.27% and 6.33%, respectively. Moreover, no firms from utilities are part of the study because of the difference in their capital structure as compared with others. Table 2 shows a good number of variations among industry and countries, while the year has the least variation in these categories.
Sample Breakdown by Country, Year, and Industry.
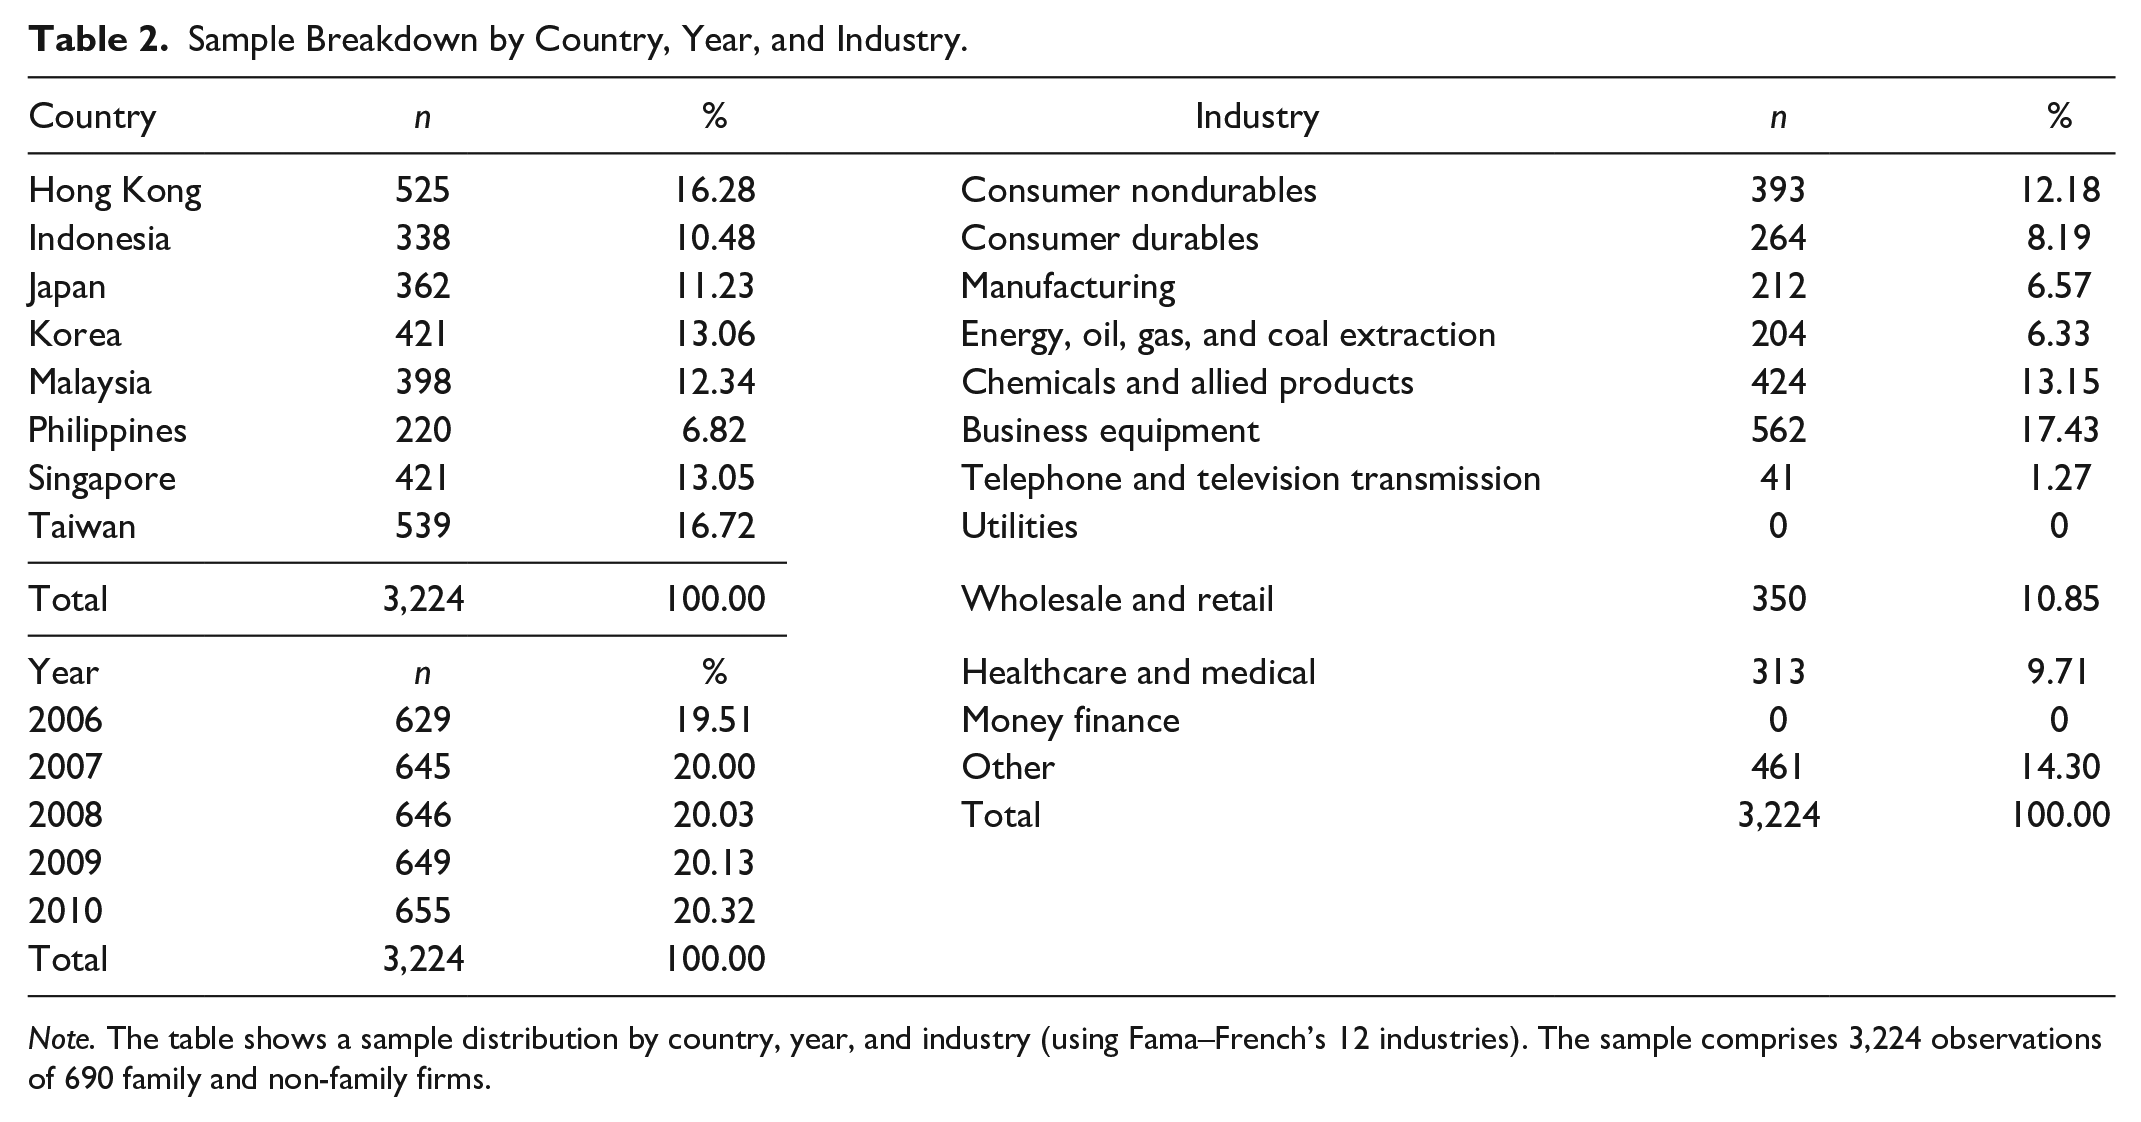
Note. The table shows a sample distribution by country, year, and industry (using Fama–French’s 12 industries). The sample comprises 3,224 observations of 690 family and non-family firms.
Table 3 includes summary statistics for key variables for both family and non-family firms for the overall sample. Mean and median values for both MDR and BDR for family firms (0.261 (0.231) and 0.212 (0.20)) are higher than mean and median values (0.243 (0.223) and 0.211 (0.201)) of non-family firms, respectively. However, these results are preliminary because key control variables for financial policy choices are not controlled here. The profitability measure (EBITDA/TA) of family firms is higher with a mean (median) value of 0.056 (0.05) than the non-family firms, 0.045 (0.043), showing that family firms in these countries have higher profitability than their non-family counterparts. In the same way, the market-to-book value of family firms is also higher. Family firms have more tangible assets (FAS_TA), but they spend less on R&D than non-family firms. Family firms even show higher earnings volatility than their counterparts with a mean (median) value of 0.073 (0.064) as compared with 0.050 (0.046). Overall, the summary statistics confirm that family firms have higher profitability and more tangible assets along with higher growth potential despite that they are spending less on their R&D than non-family firms.
Descriptive Statistics for the Overall Sample.

Note. The table reports summary statistics for key variables for both family and non-family firms. A dummy variable Family has value 1 if the ultimate owner is a family, and 0 otherwise. Definition of the variables has been given in Table 1.
Leverage Regression
This section presents the regression analyses to do a comparison between the leverage level of family and non-family firms by employing key controlling indicators of firm characteristics. This study followed the methodology of Park et al. (2013), their and took account of the same key controlling variable for comparing the leverage level of family and non-family firms. Here, key explanatory variable is a dummy for family firms like Attig et al. (2015). The value of the variable is 1 for family firms and 0 for non-family firms. Six firm characteristics have been used as control variables for regression purposes. These characteristics include profitability, market-to-book ratio, firm size, asset tangibility, volatility in earnings, and R&D expenses. Industry fixed effect and with and without year fixed effect in these regressions have also been added so that the results are not affected by different industries or years. *, **, and *** indicate significance at the 10%, 5%, and 1% levels, respectively.
Table 4 reports the results of a leverage regression to test whether there is a difference in leverage level in family and non-family firms of eight South-East Asian Economies. The control variables used in the regression have predicted effect in this leverage regression. For example, market-to-book value and profitability (EBITDA/TA) have significant adverse effects on leverage, while asset tangibility (FAS_TA) has a significantly positive effect in most of the cases. The main feature of the regression results is that in most of the cases, the family dummy has a significant impact on leverage, but its signs are not consistent, as explained by the previous studies (e.g., Ampenberger et al., 2013; González et al., 2013).
Regression Results.

Note. Leverage regression with the family firm dummy; it has a value of 1 if the controlling shareholder is a family, and 0 otherwise. The table presents the results of a collective sample of both family and non-family firms for the period 2006–2010. Panels A and B have a dependent variable of market debt ratio (MDR) and book debt ratio (BDR), respectively. Explanation of the variables has been given in Table 1. The given numbers in parentheses are showing the standard errors.
Significance at the 10% level. **Significance at the 5% level. ***Significance at the 1% level.
Panel A of the regression results employed MDR as a dependent variable. The coefficient for the family firms dummy is significant except the Philippines and Singapore, which is different in summary statistic results. For main firm characteristics, the two countries do not come up with significantly different values. Results show that the leverage level of family firms is considerably different from that of non-family firms, but their signs are not consistent. Family firms in Hong Kong, Korea, and Singapore tend to issue less debt than non-family firms, while others show positive and significant results. The same result has been obtained by the earlier studies on different countries (Ampenberger et al., 2013; González et al., 2013; Mulyania et al., 2016). A possible explanation for these results is the involvement of owners as management of the firm. If owners are taking part in the management (CEO/Chairman or member of Board of Directors), then they do not keep the leverage level high with the threat of bankruptcy cost (Westhead & Howorth, 2006). Book debt results show that in almost all cases, family firms have considerably different debt levels than non-family firms (Friend & Lang, 1988). Moreover, previous studies have explained that the countries’ legal, political (Muttakin et al., 2015), and institutional systems (Moh’d et al., 1998) make them determine their leverage level. Moh’d et al. (1998) argued that if among the block holder, institutions are involved, they do not keep the leverage level low.
To address the issue of this positive and negative relationship of the family dummy with the leverage of the firm, this study has added another variable Manage (a dummy variable having a value of 1 if the owner of the company works as CEO/Chairman or member of Board of Directors of the company, and 0 otherwise). The results of the study are presented in Table 5. This table explains that if a family firm owner works as CEO/Chairman or member of the Board of Directors, he or she has a significant impact on the leverage of the company. MDR (Panel A), except Malaysia, all the countries show a significant negative relationship of Manage with leverage and BDR. Panel B results show that, except Taiwan, all the countries show a significant negative correlation with leverage. These results suggest that if owners work as CEO/Chairman or member of the Board of Directors, they tend to keep the leverage level of the company lower to keep themselves safe from bankruptcy risk, which has been addressed theoretically in many of the previous studies (González et al., 2013, among others).
Regression Results With Management Variable.
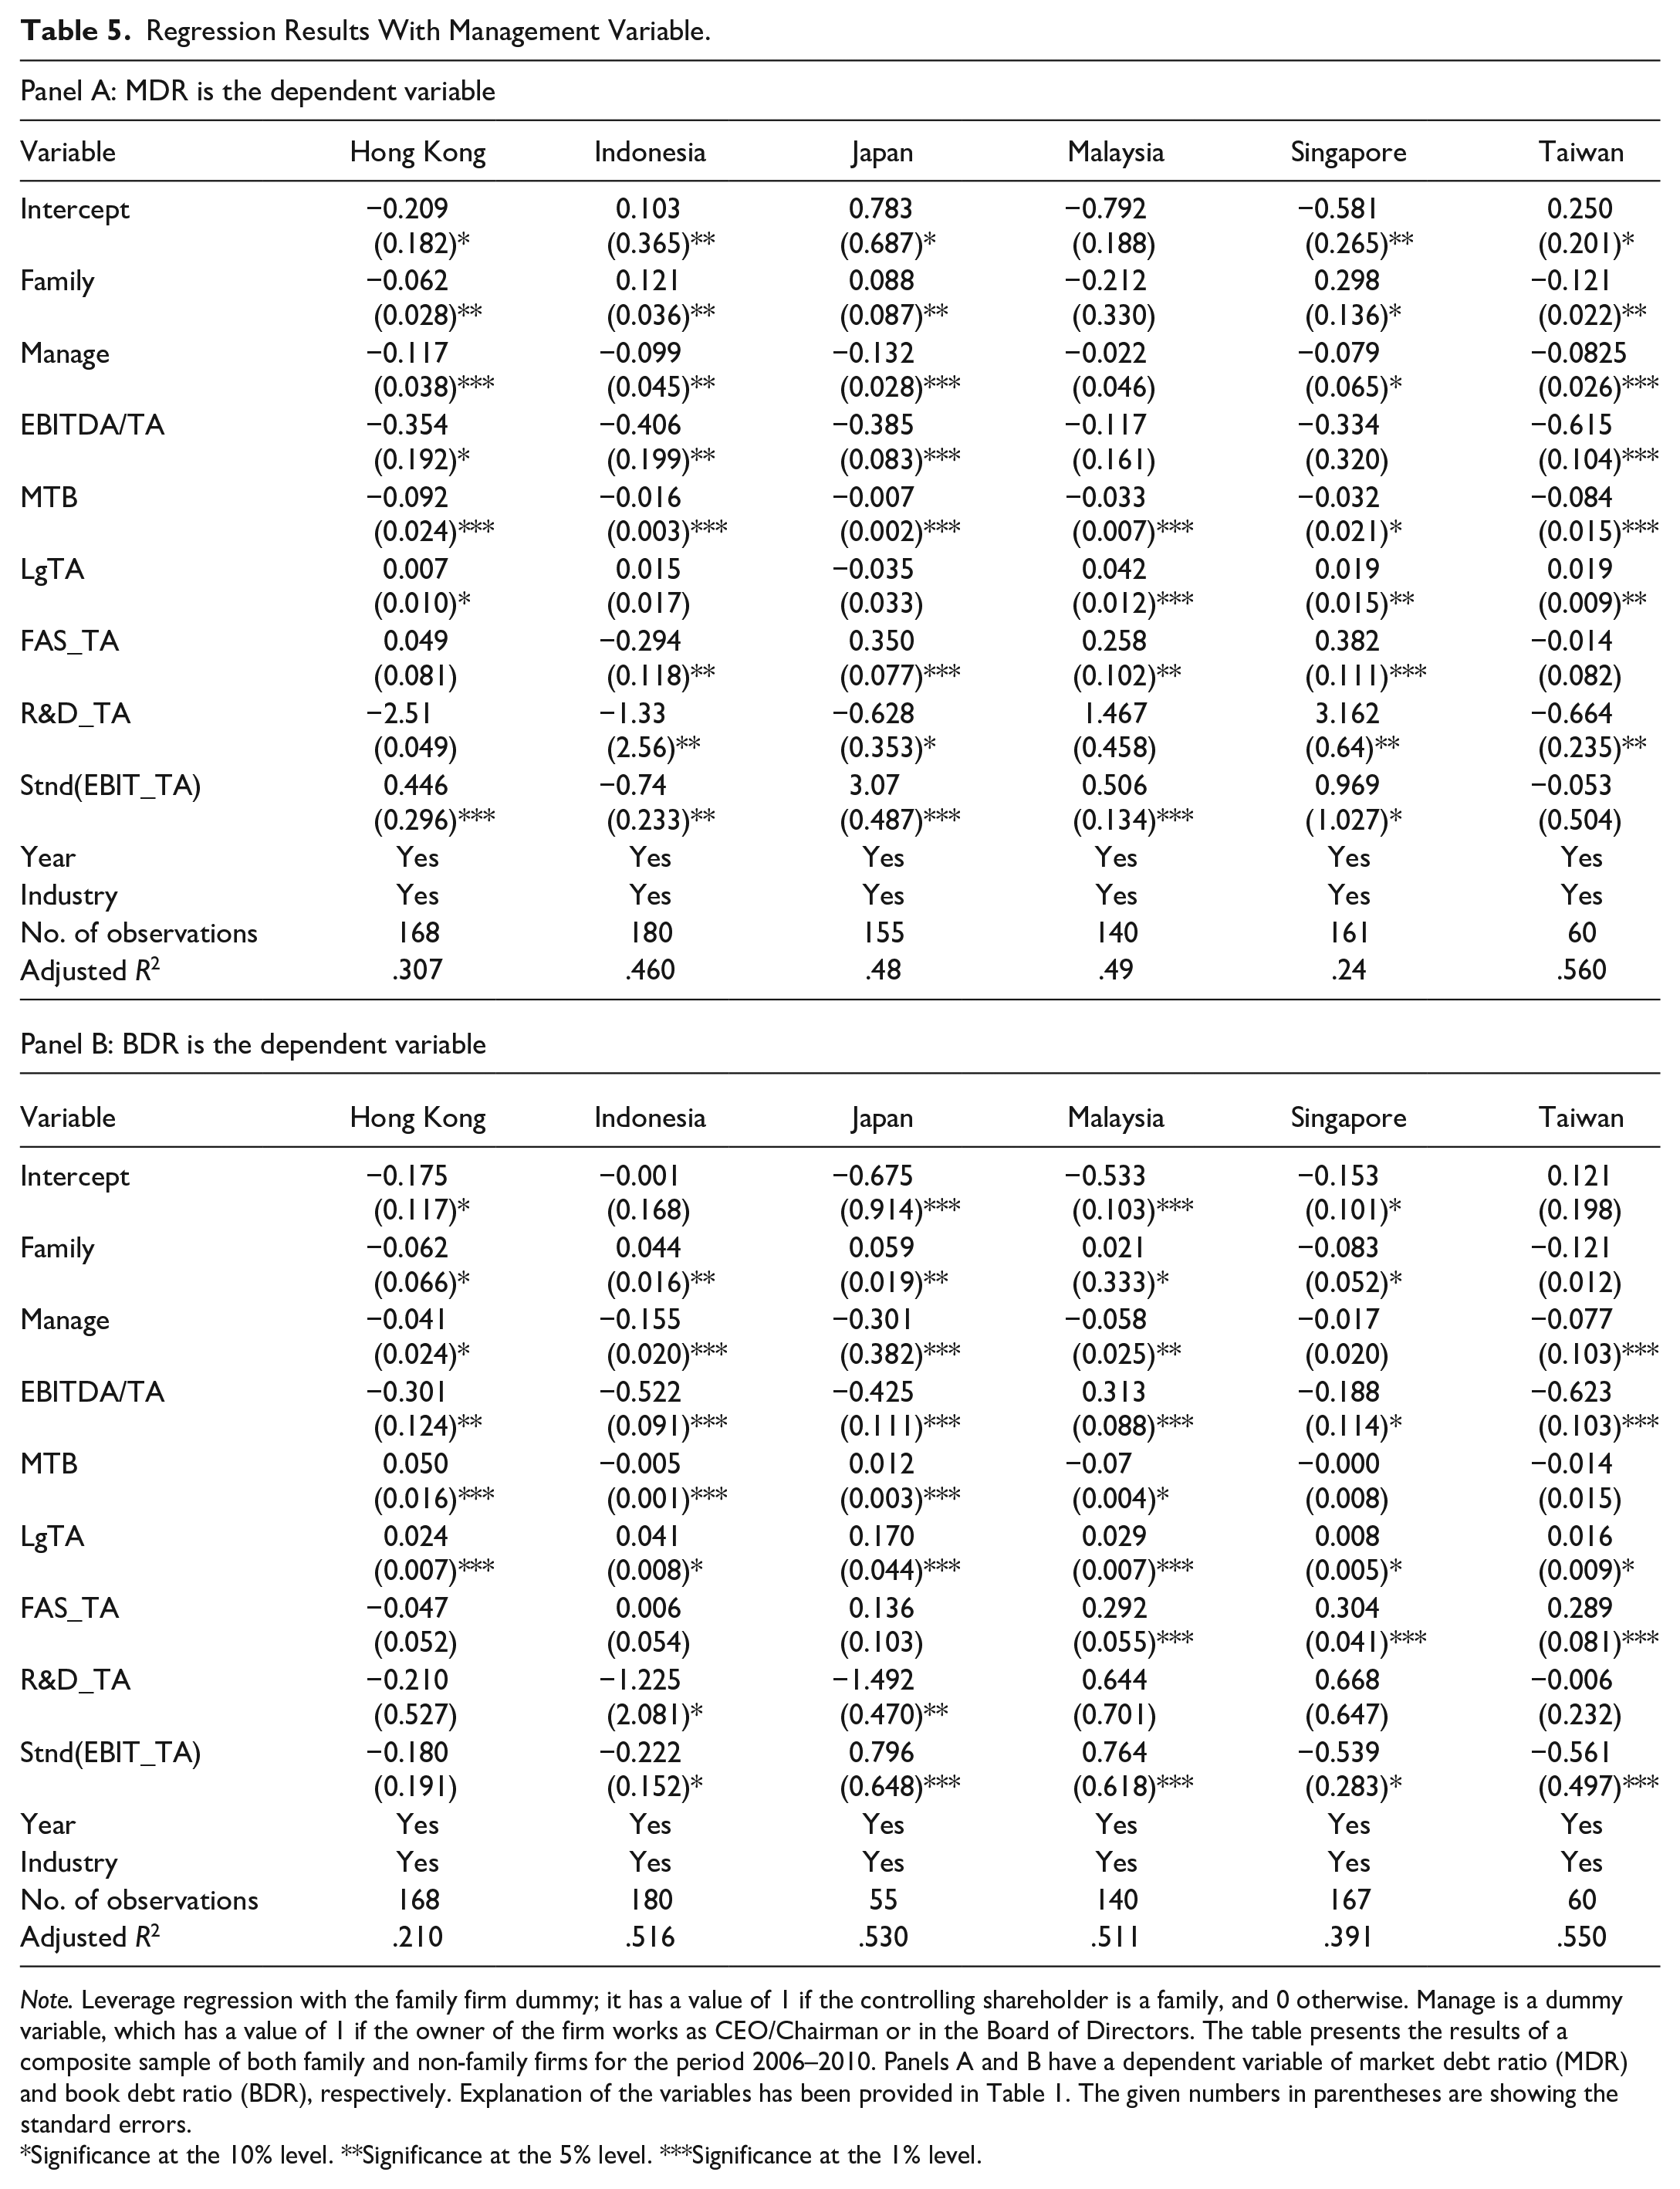
Note. Leverage regression with the family firm dummy; it has a value of 1 if the controlling shareholder is a family, and 0 otherwise. Manage is a dummy variable, which has a value of 1 if the owner of the firm works as CEO/Chairman or in the Board of Directors. The table presents the results of a composite sample of both family and non-family firms for the period 2006–2010. Panels A and B have a dependent variable of market debt ratio (MDR) and book debt ratio (BDR), respectively. Explanation of the variables has been provided in Table 1. The given numbers in parentheses are showing the standard errors.
Significance at the 10% level. **Significance at the 5% level. ***Significance at the 1% level.
Endogeneity
This part of the study focuses on the analysis of debt maturity. The study used the proportion of short-term debt to total debt and the long-term debt to total debt as an alternative dependent variable. Previous studies have recognized that short-term maturity debt can be used to discipline management, which ultimately reduces agency costs. As short-term maturity debt disciplines management by excessive monitoring through its debtors, firms with higher agency conflicts tend to use more short-term maturity debt to lessen the agency conflicts. Hence, this study assumed lesser agency problems in a family firm, which ultimately leads it to use lesser short-term maturity debt, especially when the founder acts as CEO/Chairman of the firm.
Endogeneity has been discussed as a vital issue in the corporate governance literature. Wintokia et al. (2012) argued that endogenous relations in firms not only affect future corporate value. The performance of the firms also affect future actions. Hence, ignoring this issue can lead to biased results in the leverage issues of corporate governance. Therefore, to control such endogeneity issue in debt maturity and leverage by following Doukas and Pantzalis (2003), this study used a 2SLS technique by using short-term debt and long-term debt in Panels A and B of Table 5, respectively.
Table 6 presents the analysis of the two-stage regression. The explanatory variable used in this section is debt maturity regression. In this part, the focus of the study is to analyze whether the coefficient of family firm proxy is positive or negative. It is found that in most of the situations, it did not show significance, which means that there is a slight difference in use between short- and long-term debt among family and non-family firms. In summary, 2SLS results in this section revealed that debt maturity is not affected by family firms. Hence, by including debt maturity as an alternate, the two types of firms, that is, family and non-family firms, are not significantly different in their use of the capital structure.
2SLS Procedure.
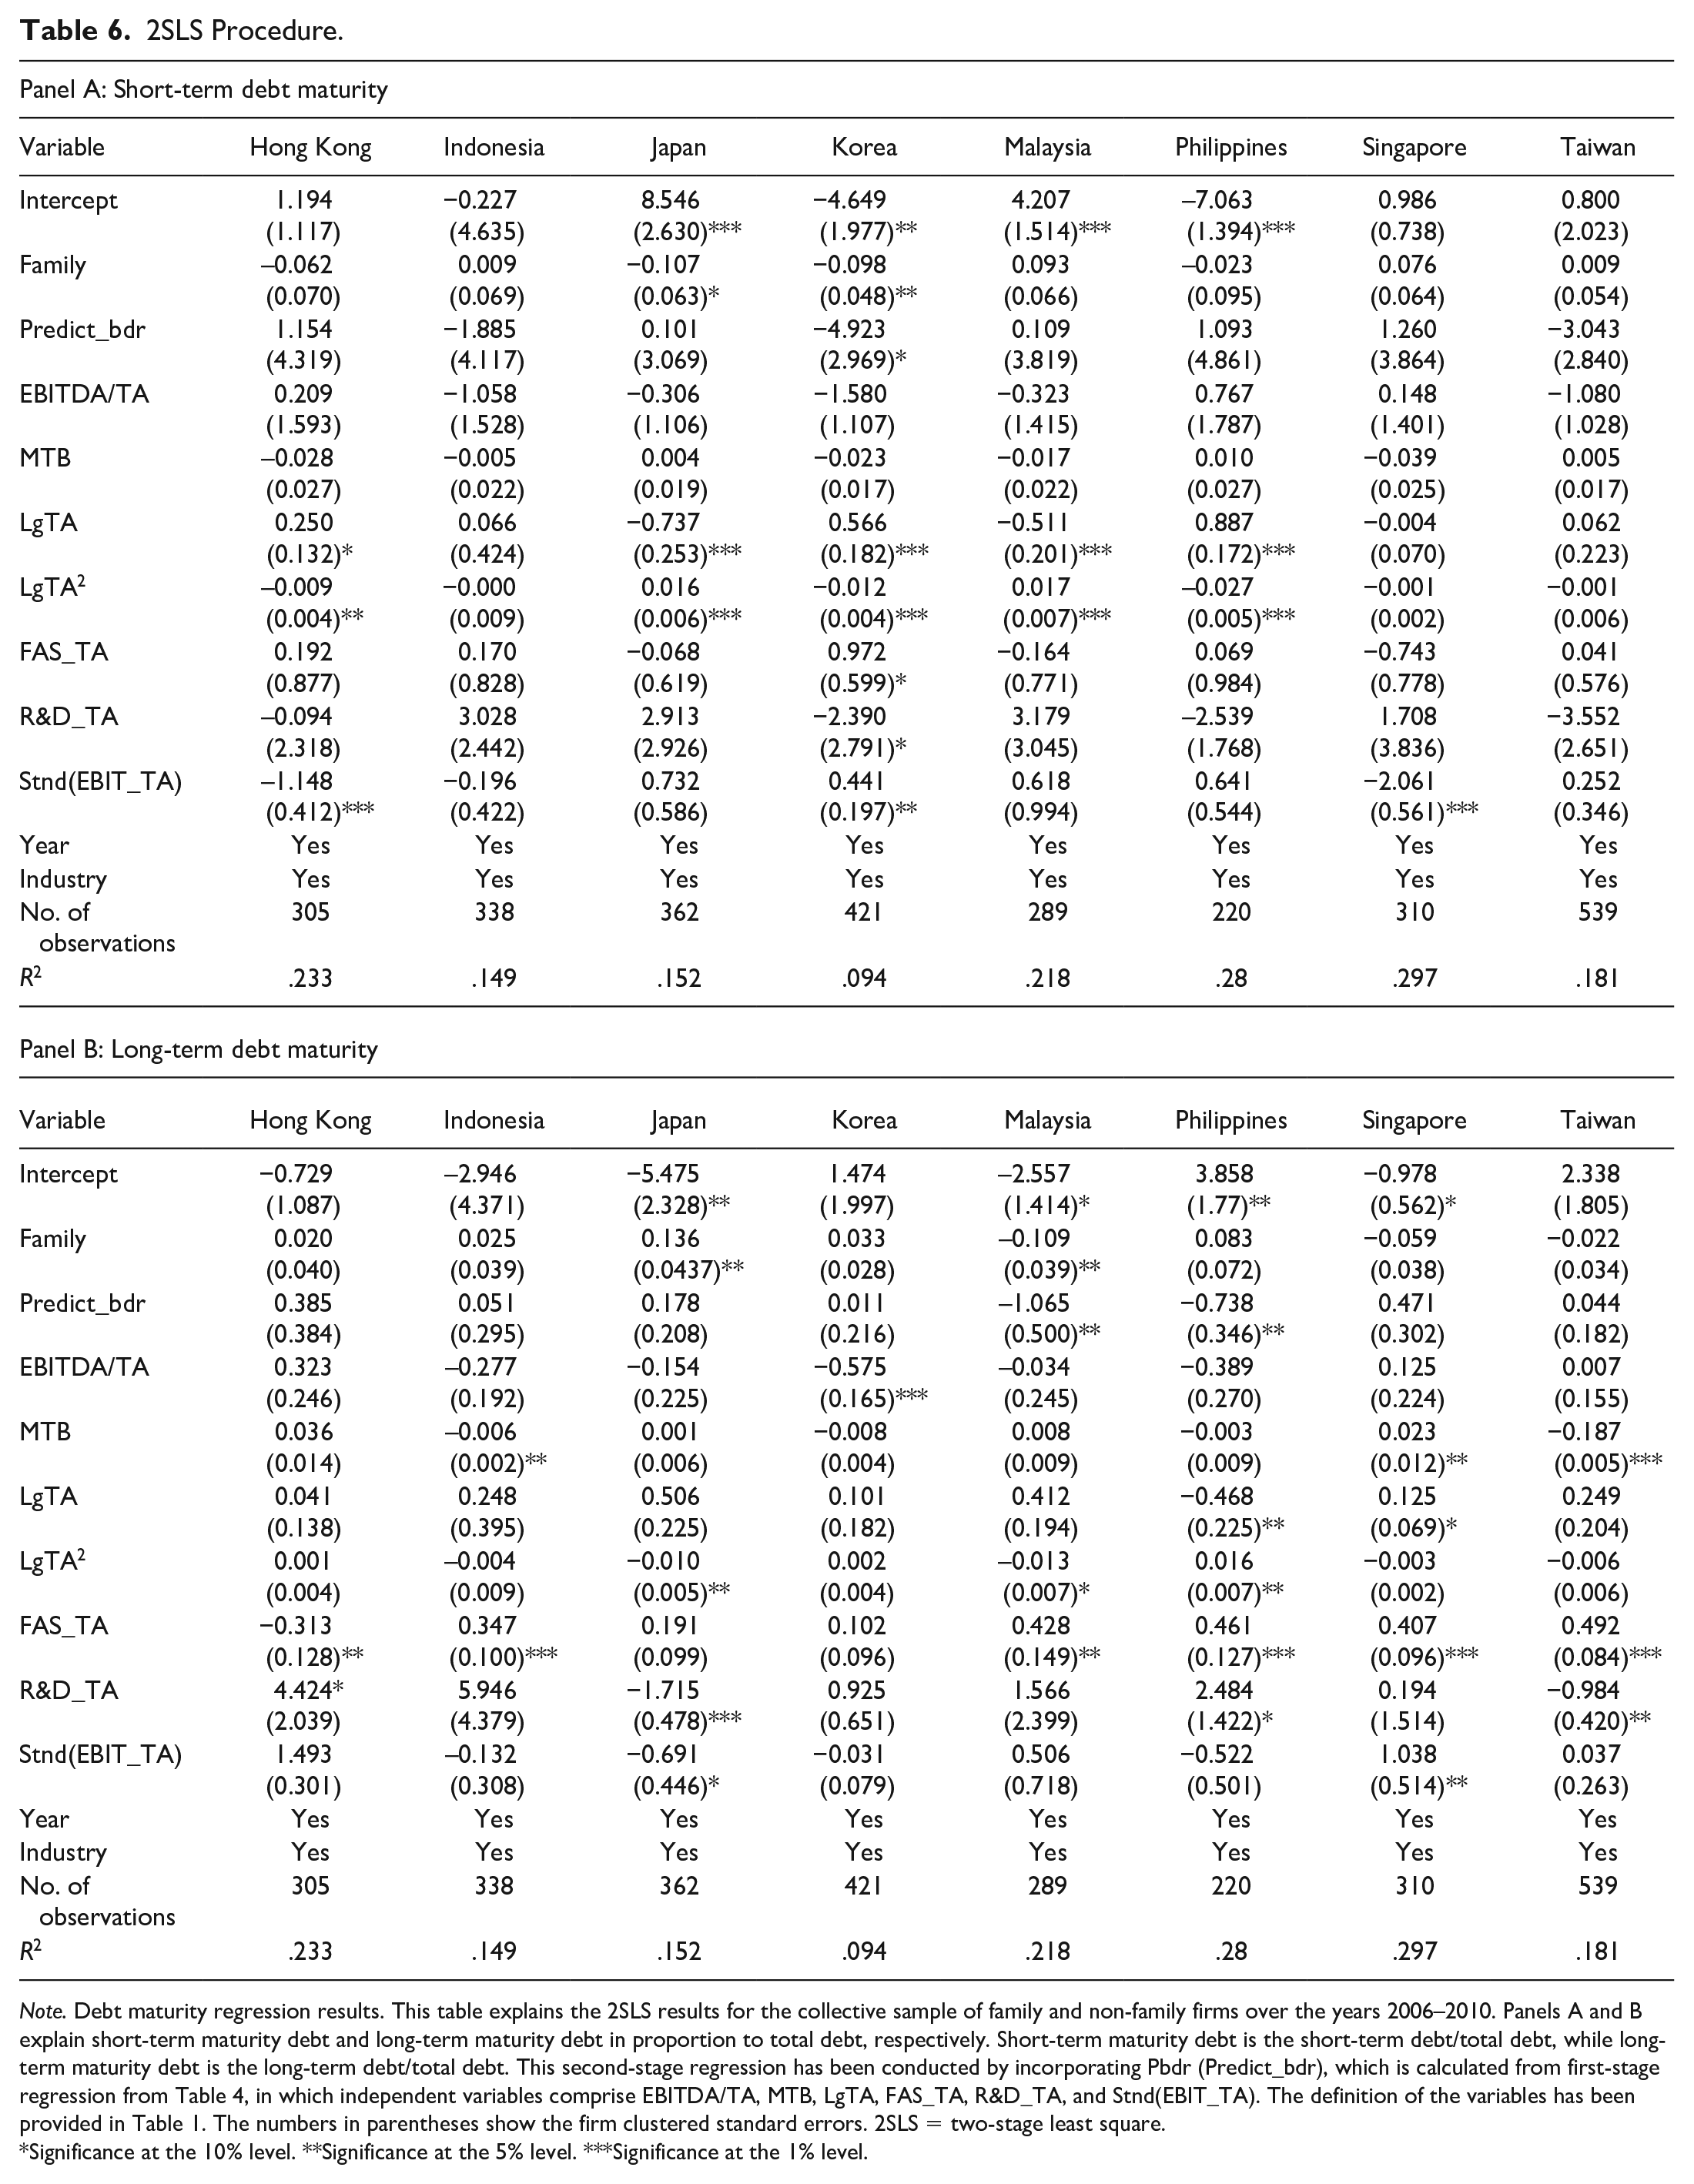
Note. Debt maturity regression results. This table explains the 2SLS results for the collective sample of family and non-family firms over the years 2006–2010. Panels A and B explain short-term maturity debt and long-term maturity debt in proportion to total debt, respectively. Short-term maturity debt is the short-term debt/total debt, while long-term maturity debt is the long-term debt/total debt. This second-stage regression has been conducted by incorporating Pbdr (Predict_bdr), which is calculated from first-stage regression from Table 4, in which independent variables comprise EBITDA/TA, MTB, LgTA, FAS_TA, R&D_TA, and Stnd(EBIT_TA). The definition of the variables has been provided in Table 1. The numbers in parentheses show the firm clustered standard errors. 2SLS = two-stage least square.
Significance at the 10% level. **Significance at the 5% level. ***Significance at the 1% level.
The Speed of Leverage Adjustment
In this part, the focus of this research is to analyze the second part of the study, wherein it investigates whether family firms regulate leverage faster than non-family firms do. The family firms perform better than the non-family firms (e.g., Anderson & Reeb, 2003 ; Muttakin et al., 2015; Poutziourisa et al., 2015; Saito, 2008), and their political connection, especially in developing East Asian Economies (e.g., Muttakin et al., 2015), allows them to use different sources of investment. Hence, they move their leverage adjustment more than non-family firms.
Table 8 explains the regression results on the speed of leverage adjustments. As presented in prior studies (e.g., Hovakimiana & Li, 2011; Park et al., 2013), this study used regression analysis by using lag leverage (both LGMDR and LGBDR) variables to estimate the speed of adjustment toward target leverage. An interaction effect between the lagged value of debt and the family firms dummy has been used to do a comparison among family firms and non-family firms. Panels A and B have been used for MDR and BDR, respectively.
Results in Panel A show that the family firm variable is significant except for the Philippines and Singapore, but the focus here is on an interaction effect of lagged leverage and family dummy. Panel A, which used MDR as a dependent variable, found that family firms in Malaysia and Japan act in a significantly different manner than their counterparts, but their negative sign shows that family firms in these countries adjust their leverage slower than non-family firms. Panel B used the BDR as a dependent variable. These results are somewhat different from the one in Panel A. Coefficient only for Indonesia is positive and significant, explaining that Indonesian family firms move toward target leverage more faster than the non-family firms, while Korea, Malaysia, Singapore, and Taiwan have significantly negative signs, which explain that in these countries, family firms move toward their leverage slower.
Overall, there is a mixed evidence that family firms adjust their leverage slowly than non-family firms. An interaction term between lagged leverage and proxy for family firms is significant in more cases only when the book value of debt is used as a measure of leverage. Previous studies argued that this process of analyzing the speed of adjustment maybe because of the abrupt decision of firms by their profits and losses. Previous studies also argued that leverage adjustment speed estimation may reflect mechanical means, but not the actual targeting measure. The study, therefore, followed Park et al. (2013) to determine whether family firms intentionally adjust their leverage less or more often than the non-family firms. In the next step, this study will analyze how frequently debt and equity are issued by family and non-family firms.
Security Issuance
To analyze security issuance activities for family and non-family firms, this study followed prior studies in explaining a debt or equity issuance (e.g., Leary & Roberts, 2010; Park et al., 2013). In this part, the threshold level is set at 5% of the books asset value at the beginning of the year. Although some of the previous researchers used higher level as well for a relatively large sample, this level is sensible.
Table 7 provides the frequency dispersal of debt and equity issuance for family and non-family firms. Panel A provides the distribution by year, while Panel B explains country-wise results. Year-wise distribution of the equity and debt issuance shows that it is not uniformly distributed, which explains that firms move toward debt or equity issuance according to the market condition, that is, market timing hypothesis (Baker & Wurgler, 2002), while we see that equity issuance of each year is much less than the debt issuance for that year, which confirms the pecking order hypothesis (Myers & Majluf, 1984).
Year-Wise Number and Percentage of Debt and Equity Issues and Non-Issues by Family and Non-Family Firms.

Here, the question is “Do family firms issue debt or equity more frequently?” The answer is no for Panel A, but country-wise distribution explains that family firms issue more debt than non-family firms, while equity issuance frequency does not show one single trend. Results show that debt and equity issuance is significantly higher in the year 2010 among sample years, with 50% and 56% of the sampled family and non-family firms’ issue debt, respectively. It may be because after the financial crisis of 2007–2009, the market condition was improving in that year. Among the sample countries except for Singapore, the debt issuance by family firms is higher than non-family firms. These observations do not provide any indication that family firms have better access to the external capital market. Hence, they raise their funding quite often than the non-family firms.
A related question here is “Do family firms issue securities more frequently than non-family firms when their leverage level departs from optimum?” If family firms have access to better external capital, they will issue debt (equities) more when their leverage (equity) level is lesser than their non-family counterparts. To analyze this question, following Park et al. (2013), a logit regression has been used, wherein the primary variable is a choice among the industry mean leverage, which serves as a proxy for target leverage and the firm’s actual leverage level at year beginning. To find whether family firms differ significantly if firms’ choice of security is affected by their leverage deficit, this study employed an interaction effect among family firms dummy and leverage deficit as an explanatory variable.
Table 8 shows the results of logit regression for issuing equity versus debt. Here, the dependent variable is constructed by assigning debt issuing firms’ years as 1, and the value of 0 is assigned to equity issuing firm–year. Here, years in which firm issued both debt and equity or none of them are eliminated. Results in Table 8 show that leverage deficit is only significant in the case of Taiwan, explaining that firms in Taiwan issue debt (vs. equity) more frequently when their leverage level is below the target. The interaction effect of leverage deficit and family dummy does not provide statistically significant results—only marginally significant in the case of Korea and the Philippines. Hence, we can say that in issuing debt (vs. equity), family firms are not much different from non-family firms.
Logit Regression Among the Choice of Issuing Debt Versus Equity.
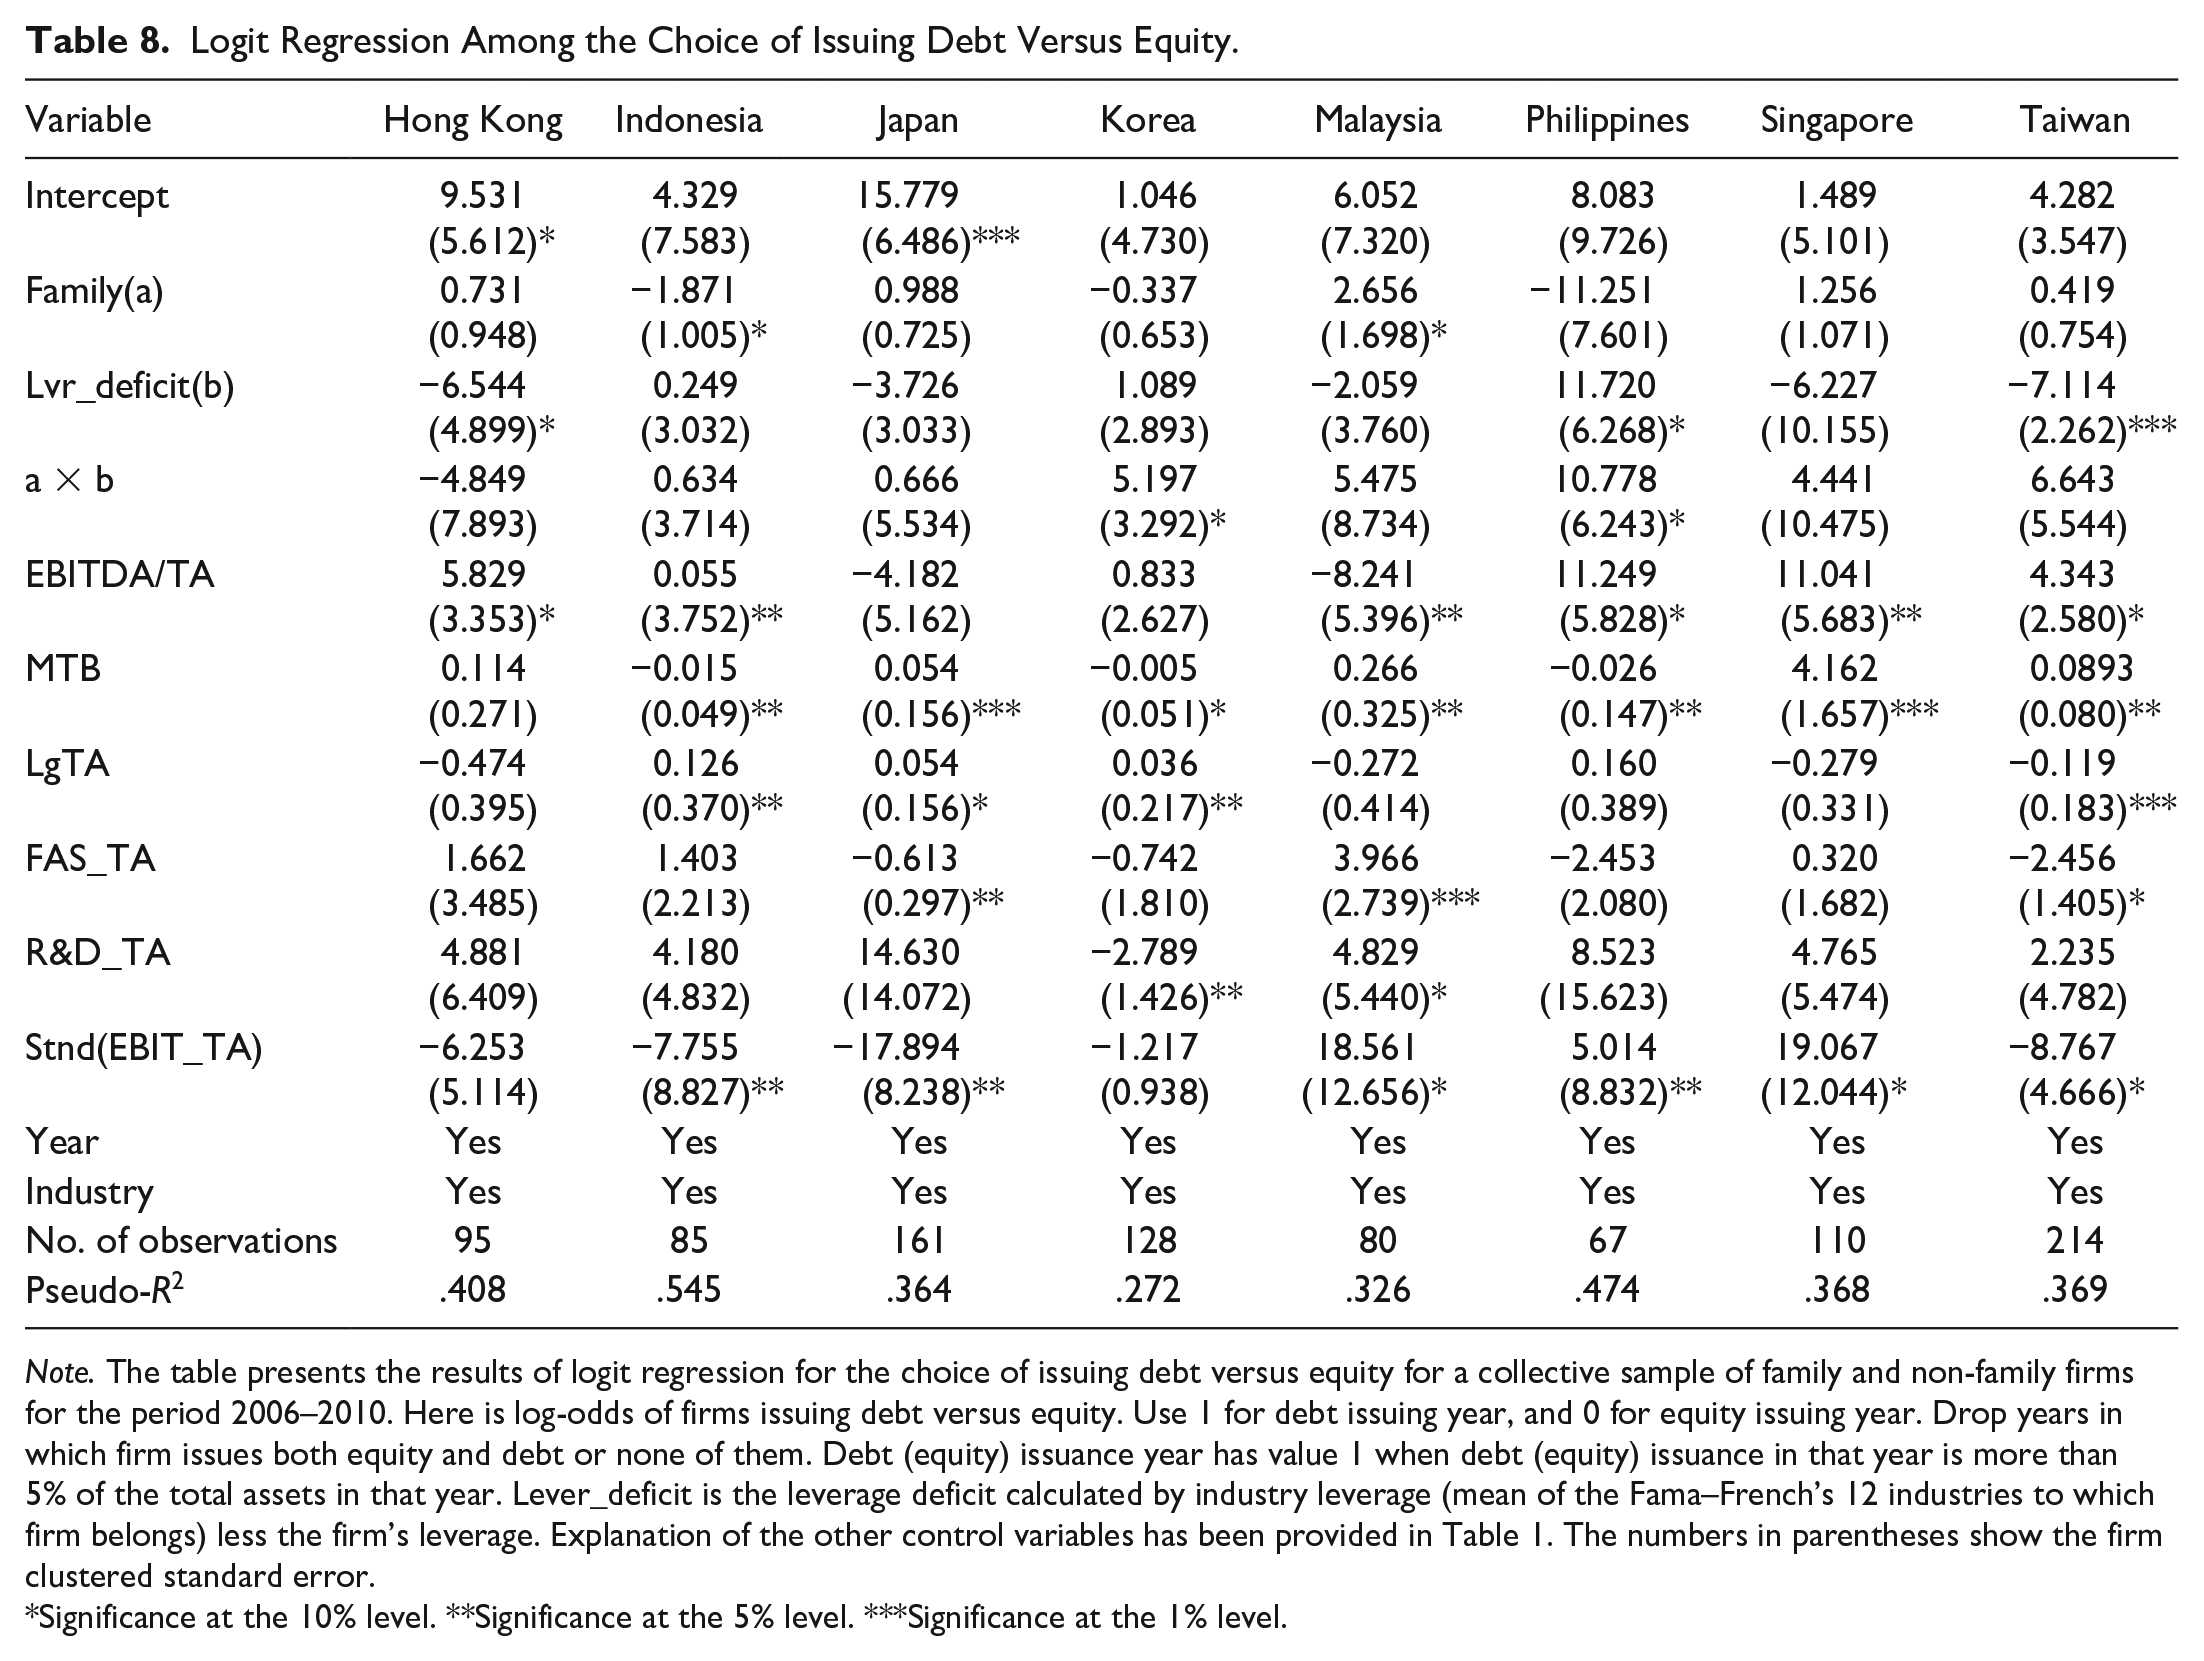
Note. The table presents the results of logit regression for the choice of issuing debt versus equity for a collective sample of family and non-family firms for the period 2006–2010. Here is log-odds of firms issuing debt versus equity. Use 1 for debt issuing year, and 0 for equity issuing year. Drop years in which firm issues both equity and debt or none of them. Debt (equity) issuance year has value 1 when debt (equity) issuance in that year is more than 5% of the total assets in that year. Lever_deficit is the leverage deficit calculated by industry leverage (mean of the Fama–French’s 12 industries to which firm belongs) less the firm’s leverage. Explanation of the other control variables has been provided in Table 1. The numbers in parentheses show the firm clustered standard error.
Significance at the 10% level. **Significance at the 5% level. ***Significance at the 1% level.
Results in Table 8 may not provide decisive proof due to lack of equity issuance observations in comparison with the total data set (Table 7). It is learnt that the equity issuance by both family and non-family firms is less frequent than debt issuance in the sample. In the sample, less than 10% of the sample firms issue equity, while debt issuance by firms is more than 30%.
Logit regression in Table 8 may not give a sufficient explanation of security issuance, and thus may distort the results of equity issuance decision. To address this issue, this study used another logit regression model. In this model, this study incorporated the issuing of debt versus not issuing debt. This does not include equity issuance in this test. To construct this dependent variable, study assigned the value of 1 to equity issuance, and 0 to no equity issuance firm–year. Table 9 provides the logit regression results of the comparative importance of leverage deficit in the choice between issuing debt versus not issuing debt. Here, the interaction term between leverage deficits with family dummy explains the significant difference between choice of issuing debt versus not issuing debt between family and non-family firms. With a coefficient of 4.05, Taiwan family firms issue more debt than the non-family firms, while Japanese family firms issue lesser debt than non-family firms at 5% and 10% significance levels, respectively. All other countries do not explain that family firms in those countries issue debt more frequently than non-family firms. Hence, it is concluded that there is little evidence that family firms issue more debt than non-family firms.
Logit Regression Among the Choice of Issuing Debt Versus Not Issuing Debt.
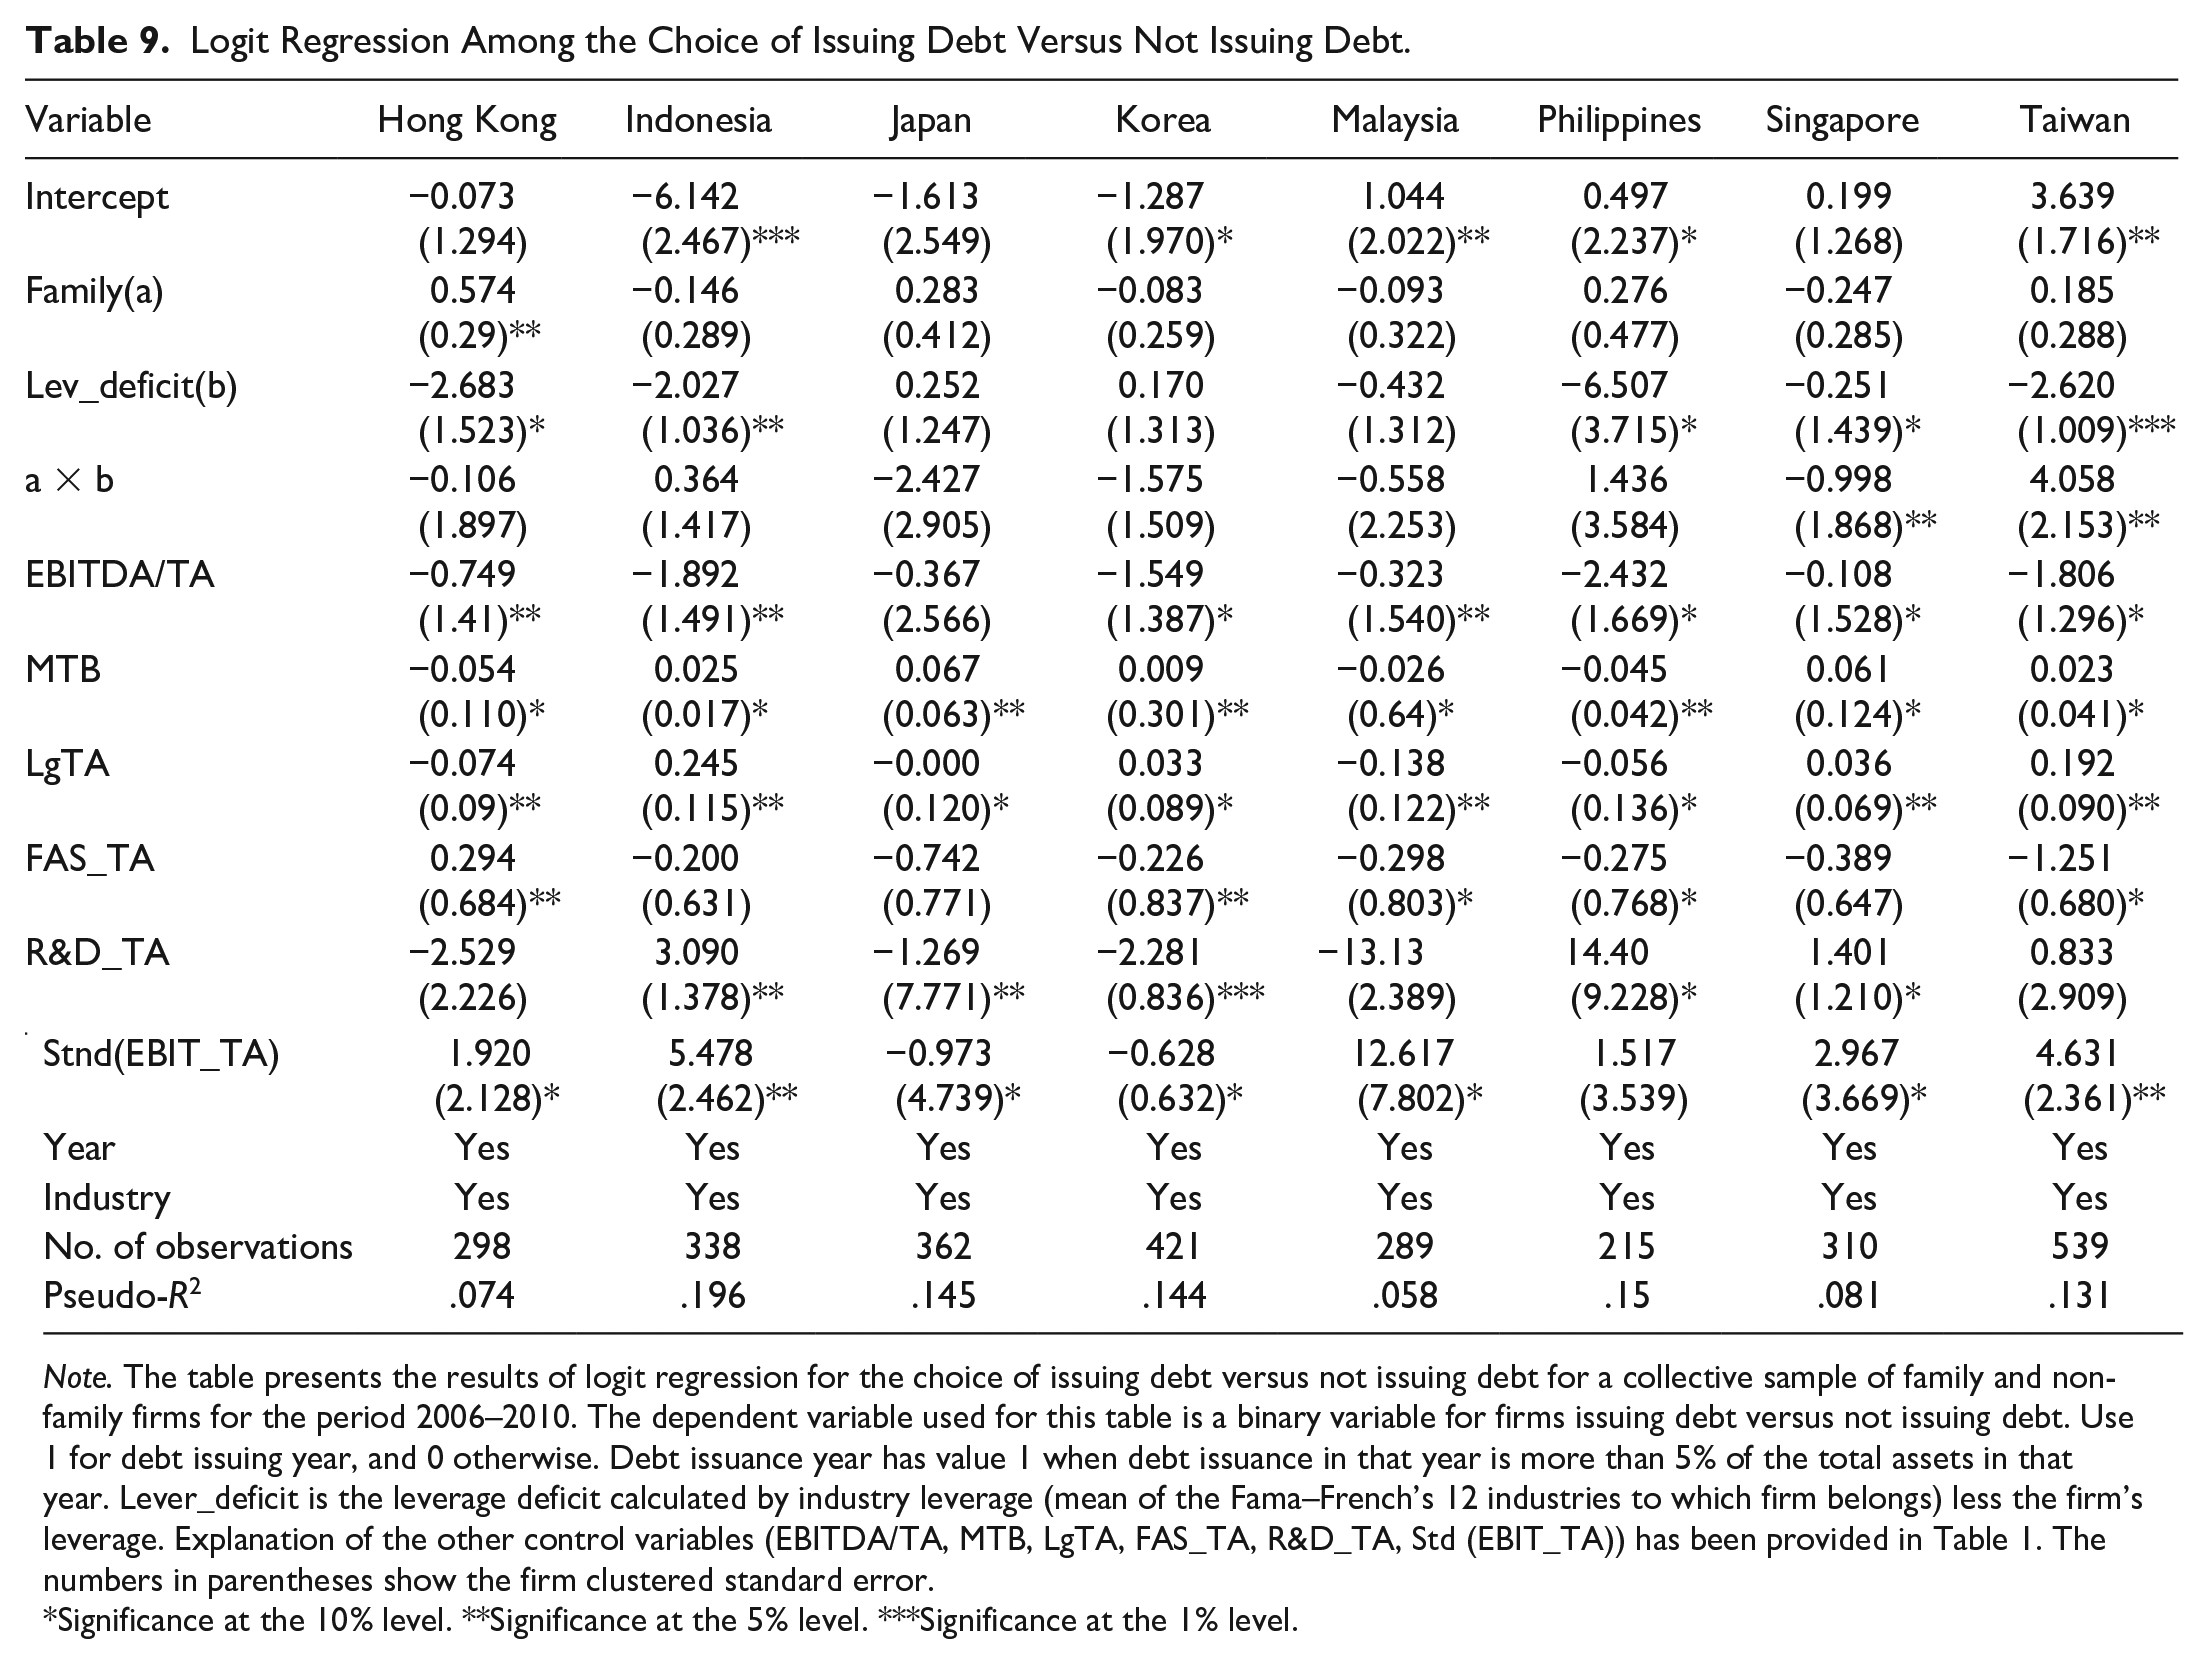
Note. The table presents the results of logit regression for the choice of issuing debt versus not issuing debt for a collective sample of family and non-family firms for the period 2006–2010. The dependent variable used for this table is a binary variable for firms issuing debt versus not issuing debt. Use 1 for debt issuing year, and 0 otherwise. Debt issuance year has value 1 when debt issuance in that year is more than 5% of the total assets in that year. Lever_deficit is the leverage deficit calculated by industry leverage (mean of the Fama–French’s 12 industries to which firm belongs) less the firm’s leverage. Explanation of the other control variables (EBITDA/TA, MTB, LgTA, FAS_TA, R&D_TA, Std (EBIT_TA)) has been provided in Table 1. The numbers in parentheses show the firm clustered standard error.
Significance at the 10% level. **Significance at the 5% level. ***Significance at the 1% level.
Robustness Tests
Previous studies on the leverage policies of family firms are single-country studies, such as Ampenberger et al. (2013), Anderson and Reeb (2003), Cucculellia and Micuccib (2008), and Mulyania et al. (2016), or they have used a single measure of leverage in their analysis. For robustness reasons, this study has used both market and book leverage ratios, and has included data from multiple countries to confirm that the results are not obtained from a single country. Furthermore, these results are confirmed by using controlling shareholders at the 20% threshold level as explained by the Carney and Child (2013). After adding more concentrated ownership at 20% threshold level in Table 10, the conclusion of the study for family and non-family firms for leverage level, adjustment of optimal leverage, and frequency of security issuance remains the same.
Regression Results.

Note. Leverage regression with the family firm dummy; it has a value of 1 if the controlling shareholder is a family, and 0 otherwise. The table presents the results of a collective sample of both family and non-family firms for the period 2006–2010. Panels A and B have a dependent variable of market debt ratio (MDR) and book debt ratio (BDR), respectively. Explanation of the variables has been given in Table 1. The given numbers in parentheses show the standard errors.
Significance at the 10% level. **Significance at the 5% level. ***Significance at the 1% level.
Hence, the study concluded that by increasing the ownership concentration from 10% threshold to 20% threshold besides using both book leverage and market leverage as leverage measure, the conclusion of the study remains the same.
Concluding Remarks
This study endeavored to analyze the leverage level and adjustment toward optimal leverage level in relation to firms’ ownership concentration (10% and 20% threshold level) by using data of eight East Asian Economies (Hong Kong, Indonesia, Japan, Korea, Malaysia, Philippines, Singapore, and Taiwan)—combined data of 690 family and non-family firms with 3,224 firm–year observations for the period from 2006 to 2010. The study has used OLS regression and logit regression for analyzing the data. Results of the study show a significant difference in the leverage level of family and non-family firms. Family firms are more leveraged when the owners are not part of management (CEO or Chairman). Higher debt could be used to lessen the agency cost and discipline the management, which ultimately brings family firms with high intangibility (more fixed assets), resulting in enhancing firm’s qualities. These qualities involve higher profitability, high market value, and high book value (Anderson & Reeb, 2003; Burkart et al., 2003). It is concluded that family firms have significant leverage level than non-family firms, but their direction is not same for different countries. To further explore the direction of relationship, the analysis of owner’s involvement to work as CEO/Chairman or member of Board of Directors of the company revealed that when owner of the family firm works as CEO/Chairman or member of Board of Directors, he or she tends to keep the leverage level lower with the intention to play safe and keep the company away from bankruptcy risk, which is in line with previous studies (Moh’d et al., 1998; Mulyania et al., 2016, among others). Although family firms have significant contribution in East Asian Economies, their capital structure and leverage policies are not much different than the non-family firms. Moreover, it is found that family firms are not much different from non-family firms in debt maturity structure, the speed of leverage adjustment, and their tendency to issue securities. There are certain limitations of the study. The data period is 2006–2010, which is a bit old due to non-availability of family and non-family firms’ data. Also, the focus of the study is only Asian countries, and it does not provide any comparison with any other region (Africa, Europe, etc.). Future research could focus on institutional variables and legal systems of the countries that could affect the leverage policies of the firms in each country.
Footnotes
Declaration of Conflicting Interests
The author(s) declared no potential conflicts of interest with respect to the research, authorship, and/or publication of this article.
Funding
The author(s) received no financial support for the research and/or authorship of this article.