
Abstract
Learning behavior refers to students’ preparedness to embrace various learning forms and techniques, encompassing skills, activities, creativity, and motivation. Positive learning behavior improves efficiency, discipline, and academic skills, while negative learning behavior results in a diminished grasp of the essence of learning and cultivates frustration during the learning journey. Thus, intervention conducted to observe changes in student learning behavior requires a valid learning behavior assessment tool. The multitude of factors directly influencing learning behavior necessitates researchers to identify the dominant factors affecting learning behavior. This study aims to analyze the validity and reliability of the Learning Behavior Questionnaire (LBQ). This research was conducted in two stages, namely developing a questionnaire and validity and reliability of the instrument. Samples were Banda Aceh junior high school students (
Plain Language Summary
Learning behavior instrument obtained three main factors that influence changes in student learning behavior: 1) student learning behavior in the classroom, 2) student learning motivation and 3) students’ social interactions outside the classroom. Learning behavior can be observed from these three factors; therefore, it is necessary to validate the learning behavior questionnaire so that it can be used to observe, identify, and evaluate the impact of changes in learning behavior in developing students’ attitudes in a more positive direction. The development of the questionnaire was conducted in two stages: Phase 1 involved developing the questionnaire by collecting statement items, and Phase 2 involved conducting validity and reliability tests. Identification of content domains of student learning behavior has been carried out through a literature review by synthesizing more than 22 scientific articles. The assessment instrument assessed in this study is the “Student Learning Behavior” questionnaire, divided into three categories: category A in the form of student learning behavior in the classroom consisting of 60 statement items, category B in the form of student learning motivation consisting of 30 statement items and categories. C is in the form of student learning behavior outside the classroom consisting of 25 statement items, totaling 115 statements. The results showed that the content validity of the learning behavior questionnaire was satisfactory, with an average value validity of Necessity of Items (CVR) =0.803, Relevancy of Items (S-CVI) = 0.824, and Clarity of Items (I-CVIs) =0.826. The EFA revealed the KMO of 0.805, 0.789, and 0.759, respectively. The final results of the CFA test resulted in 48 valid items and indicated a fit model.
Introduction
The rapid advancement of science and technology brings consequences for the demand to enhance work professionalism that aligns with industry development. Work professionalism refers to behaviors, attitudes, and work qualities that reflect high standards, ethics, and dedication to the job. Professional work relies on competence and skill development, a sense of responsibility, discipline, and a commitment to lifelong learning. Highly professional individuals are more likely to contribute positively to the community, workplace, and society. This makes professionalism a significant determinant for transforming behavior for the better. Student learning behavior is a critical aspect of behavior patterns that require careful observation and measurement (Chao et al., 2018; Politzer & McGroarty, 1985). Assessing learning behavior is the crucial first step to implementing effective interventions and identifying which learning behaviors are targeted and their levels of deficiency in order to remediate learning issues (Davidson, 2020). Social learning theory emphasizes that individual behavior is formed by imitating the behavior of other individuals in the environment (Bandura, 1977). Individuals observe people’s behavior in their surroundings as models to be imitated and incorporate that behavior into their actions. Students respond differently to ongoing learning activities (Mutiawati et al., 2022).
Learning behavior can be interpreted by the mental readiness of students in learning by showing intelligence, active and creative thinking, students’ love for ongoing learning, and having better psychological adjustments in and outside the classroom (Saxena, 2002). Student learning behavior in the classroom is influenced by motivation, reflection, learning satisfaction, and learning activities. Meanwhile, student learning behavior outside the classroom is influenced by technology, self-directed learning ability, learning resources, learning environment, and internal student conditions (Mutiawati et al., 2023). Therefore, student learning behavior largely refers to how students interact with their environment to acquire, process, and internalize new information and skills. Motivation, satisfaction, self-directed learning ability, reflection, social interaction, technology usage, and other internal student conditions can influence student learning behavior.
Learning behavior is a pattern of actions and responses developed over time, which tends to stabilize and become consistent (Wu et al., 2021). It shows resistance to change, meaning that learning behavior may persist once established even in the face of new information or experiences. Therefore, building good learning behavior can improve students’ learning efficiency and long-term learning effects (Goda et al., 2015). For junior high school students, good learning behavior is meaningful for developing sustainable scientific and academic competence. Learning behavior is a significant and frequently discussed topic in education. However, there is still no universally agreed upon definition of learning behavior. So, some studies define learning behavior as a reaction or student action in the overall learning process, including study habits, interest in learning, learning strategies, learning styles, self-efficacy, and learning orientation (Schweder & Raufelder, 2019). Learning behavior has been the focus of research for several scholars investigating the meanings, patterns, and factors that influence behavioral changes (Febrina & Ilyas, 2020; Geitz et al., 2016; Haghighi & Jusan, 2012; Jebaseelan, 2016; Magdalena, 2015; Mutiawati et al., 2022; Peng, 2012; Rahman et al., 2012; Schweder & Raufelder, 2019; Varachanon, 2015; C. C. Wang & Greenwood, 2015).
In this research, students exhibit learning behavior as a state of mental preparedness when embracing diverse learning approaches and methods. This includes theoretical and practical learning involving the application of skills, active participation, creativity, and a sustained motivation for learning. However, in practice, teachers face significant challenges and difficulties in stimulating student learning motivation and enhancing students’ self-directed learning behavior (X. Wang & Zhang, 2022). The development of education and science, communication media, and electronics, including the internet, as well as social and cultural developments, is the positive impact of a good education system. Hence, it is crucial to assess learning behavior from the beginning to implement improvements in education. The measurement of learning behaviors can be observed through the responses provided by students to learning situations that involve students, classmates, and teachers in learning activities (Chao et al., 2018; T. Wang & Xia, 2023).
Learning behavior questionnaires have been developed by several previous researchers, such as Roces Montero, who developed a learning behavior measurement scale that focuses on strategy and motivation. However, the scale has not been able to fully evaluate overall learning behavior, such as changes in learning attitudes (Montero et al., 2017). Cheng also developed and validated independent learning instruments in four factors, namely the process of planning and implementing learning, student motivation in Learning, student self-monitoring, and student interpersonal communication techniques during the teaching and learning process. However, these instruments ignored feedback from learning behavior, namely learning satisfaction (Cheng et al., 2014). Several other researchers have also developed learning behavior questionnaires, such as Robert L. Politzer, based on the scale and location of students, dividing student learning behavior into three categories, namely Part A focusing on classroom studies, Part B on individual studies, and Part C on interactions outside the classroom (Politzer & McGroarty, 1985). Furthermore, Yifan Wu also conducted an EFA from the learning behavior questionary for nursing students and divided learning behavior into several items, namely strategic, gesture, motivation, and satisfaction level (Wu et al., 2021). In his research, Farid stated that an easy step in measuring student learning behavior is to assess the learning process style by looking at (1) learning behavior in the classroom and (2) learning behavior must be measured through the Grasha-Riechmann interaction process in the form of six learning behaviors, namely: independent, avoidant, competitive, dependent, collaborative, and participatory learning styles (Farid et al., 2014).
Learning behavior, when examined from the literature, is included in affective characteristics. Effective refers to feelings, attitudes, or moods (McCoach et al., 2013). Therefore, although several previous researchers have developed the learning behavior questionnaire, however, the questionnaire is only used to measure certain directions, such as learning readiness and learning styles, so it is not suitable to be used to evaluate a series of student learning behaviors that are more spacious, composite and explorative in the teaching and learning activities. Student learning behavior in the classroom is influenced by motivation, reflection, learning satisfaction, and learning activities (Mutiawati et al., 2023).
Based on the description above, it is necessary to re-validate the learning behavior questionnaire with Subject-Matter Experts (SMEs) for junior high school students by considering the factors of student learning behavior in the classroom, student motivation, and student social interactions outside the classroom. The instrument is not just a series of items but must be able to provide logical arguments that the results obtained can be interpreted to help make decisions as desired by the measurer (Wilson & Hutchinson, 1991). Furthermore, these indicators can be used to see, identify, and evaluate the effect of changes in learning behavior in developing students’ attitudes in a more positive direction. The research question is whether the developed student learning behavior questionnaire meets the validation criteria. The purpose of this research is to design and validate a standardized and simple learning behavior questionnaire so that it can be used to evaluate and provide useful information for the adjustment of unwanted student learning behavior in education.
Methods
Questionnaire Development
This research was conducted in two stages: Phase 1, developing a questionnaire by collecting questionnaire statement items, and Phase 2, conducting validity and reliability tests. The instrument development stage is carried out in three steps: identifying the content domain, generating sample items, and compiling the instrument (Figure 1; Zamanzadeh et al., 2015).

The instrument development stage.
Identification of content domains of student learning behavior has been carried out through a literature review by synthesizing more than 22 scientific articles. The study results revealed that learning behavior could be influenced by 19 factors, which can be categorized into four groups: (i) Student learning behavior in the classroom; (ii) Student learning behavior outside the classroom; (iii) Student learning motivation; and (iv) Student learning behavior outcomes (Mutiawati et al., 2023). For this purpose, the researchers chose two pilot schools, SMP Insafuddin and MTs Al Manar. Semi-structured qualitative interviews were conducted to collect opinions on the learning behavior of nine students. Ethics approval has been approved by the Ethical Clearance Committee as it is ethically in accordance with the seven WHO 2011 standards with ethical exempted. The ethical review of this behavioral study was conducted after the researcher obtained the subject’s consent to participate and ensured that the research subjects would not experience any physical or mental distress (Appendix 1). The interviewed students were selected using the convenience sampling method from three classes (class VII, VIII, and IX). Three students were taken from each class, aged between 13 and 15. The interviews focused on student learning motivation, learning attitudes, learning strategy, learning methods, learning environment and level of satisfaction, changes in learning systems, relationships with parents, parenting patterns, and student social interactions outside of school. The interview guideline covered three aspects: (1) students’ cognition and views about the learning process, (2) experiences and changes experienced by students during learning, and (3) students’ social interactions in the family and community environment. The Interview time lasted around 20–30 min.
Albert Bandura’s social learning theory suggests that individuals interpret a model that is imitated and then processed cognitively into the desired attitude (Bandura, 1977). The cognitive structure includes knowledge, strategies, perceptions, responses, and attitudes (Wu et al., 2021). Someone’s attitude toward a certain object can affect the person’s behavior toward the object (Wanke, 2016). In this study, attitudes are defined using The Theory of Planned Behavior (TPB) by Ajzen, where attitude is a concise evaluation that represents a person’s psychological objects such as good or bad, dangerous or useful, friendly or unfriendly, and liked–disliked (Ajzen, 1991). The Motivation Questionnaire (MQ) measures the flexibility of individual intelligence (assessing whether individuals believe intelligence can be changed or improved), belief in intelligence, belief in one’s identity (personality), self-efficacy, and approach to achievement goals (Scherer et al., 2017).
Based on the TPB theory, a person’s attitude is formed from three important things that will shape a person’s behavior. The first, perceived behavioral attributes, deputize the confidence and sensation that people associate with a particular gesture object. The second, perceived social norms, deputize a privacy reaction to the social acceptance of the behavior. The third, perceived behavioral management, represents a person’s perception of the control he or she has over the conduct of behavior. It is this latter perception that may refer to external factors (e.g., resource availability, student’s social environment, and time) or internal factors (e.g., perceived ability to perform a behavior i.e., often defined by “Self-efficacy” based on the Bandura concept; Armitage & Conner, 2001). These three measures can affect a person’s intention to enforce certain behaviors in a person. So the stronger the intention, the greater the person’s desire to perform the behavior (Wijnen et al., 2021).
Furthermore, based on the metacognitive theory stated by Flavell, processing cognitive activities, such as self-regulation, can help students increase cognitive stimulation and learning motivation (Flavell, 1979). Thus, classroom learning is a student’s cognitive activity that plays an important role in determining student behavior and student activity. External factors in the form of the environment can greatly influence the motivation obtained through the level of individual satisfaction (Wu et al., 2021). When students’ cognitive structures develop better, their teaching and learning motivation toward related professional cognitive achievement will increase. In developing this questionnaire, we used indicators of learning behavior in the classroom, students’ learning motivation, and students’ social interactions outside the classroom (Figure 2).

Research theoretical framework.
AIKEN Method to Get Consensus on Items
The second stage of assessment involves the confirmation of items by a certain number of experts to ensure the validity of the content of the assessment instrument. The selection of domain experts is based on criteria such as expert knowledge, special training, or professional experience in the subject matter. It is recommended to involve at least three experts in determining content validity (Shrotryia & Dhanda, 2019). However, involving more than ten experts in the process is impossible because increasing the number of experts can reduce the possibility of agreement among experts (Polit & Beck, 2006). Therefore, the researcher invited five experts with more than 5 years of professional experience in Focus Group Discussion (FGD) activities. The experts consisted of one professor in the field of educational evaluation, two experts in the field of instrument evaluation and psychology, and three school teachers in the field of counseling guidance.
The assessment instrument assessed in this study is the “Student Learning Behavior” questionnaire, divided into three categories: category A in the form of student learning behavior in the classroom consisting of 60 statement items, category B in the form of student learning motivation consisting of 30 statement items and categories. C is in the form of student learning behavior outside the classroom consisting of 25 statement items, totaling 115 statements.
Data was collected using a Likert-type assessment scale validation sheet sent to the expert via the Google form. Each expert was sent a Google form link to respond to the 115 statement items. To get the results of construction validation, relevance, and clarity, a five-point scale is used for each test item (Pada et al., 2015). In order to determine the consistency between validators, the validation index is rated with the Aiken Index, with the formula
Setting and Sample
This research was conducted at three junior high schools in Banda Aceh City, Indonesia. The sample size in this study was determined following the sampling procedure for factor analysis. Factor analysis provides information about reliability, item quality, and construct validity. The minimum sample size should be 100 or at least 200 for accuracy reasons (Kline, 2016; Nevitt & Hancock, 2001). Hundleby and Nunnally (1968) recommended a minimum sample of 5 to 10 times the number of items to test the validity of the constructs of EFA and CFA. In line with this, Mayers stated that the appropriate sample size depends on the number of items available; 10 items required 200 samples, 25 items required 250 samples, 90 items required 400 samples, and so on (Meyers, 2006). In the pilot, the learning behavior instrument consisted of 67 items (27 statements about student learning behavior, 25 about student motivation, and 15 about students’ social interactions outside the classroom). Hence, in this study, the minimum sample required is 335.
The statistical population for this research is all students of SMP Negeri 6 Banda Aceh, students of SMP Insafuddin and Madrasah Tsanawiyah Almanar Banda Aceh, Indonesia, academic year 2020/2021. The total population is 1,025 students, based on statistics provided by the administration of the three schools. To improve the structure of the extracted factors, responses received came from 724 samples used for EFA analysis totaling 406 respondents, and CFA analysis totaling 318 respondents. The sample was divided into two parts, namely 406 students from SMP Negeri 6 Banda Aceh and SMP Negeri Insfauddin Banda Aceh and 318 students for the CFA test from Madrasah Tsanawiyah Almanar Banda Aceh. SMP Negeri 6 Banda Aceh has a total of 796 students, consisting of 396 male students and 400 female students. Next, SMP Insafuudin has 151 students, consisting of 89 male students and 62 female students. Meanwhile, Madrasah Tsanawiyah Almanar Banda Aceh has 78 students, with 30 female students and 48 male students. In addition, to ensure the adequacy of the sample size, the Bartlett Test and KMO Index were carried out, with a KMO coefficient = 0.803 which indicates an adequate and good sample size.
Data Collection
In this study, two sources of data were used: primary and secondary data. Primary data were collected from the questionnaire; secondary data was obtained from portals and other sites used in searching for theoretical and journal references. The basis for the preparation of the learning behavior questionnaire indicators is (1) reviewing a general demographic questionnaire about student learning behavior and (2) Initial indicators were adopted from the Grasha-Riechmann ( α = .89), the Motivational Assessment of the Learning Process (EMPA) questionnaire (α = .83, .93, and .93), the questionnaire developed by Politzer (α = .52, .61, and .63) and Learning Behavior Questionnaire to measure the learning behavior of Nursing students in China (α = .93), which have been verified and proven for reliability and validity.
Data collection was conducted by the survey method. The survey was conducted in three junior high schools in Banda Aceh, Indonesia: Public Junior High School 6, Insafuddin Junior High School, and Madrasah Tsanawiyah Almanar. Students filled out the questionnaire anonymously under guidance within 20 min, and only data from the complete responses were analyzed. The general purpose of the test is to understand the extent to which items from the scale can reflect the underlying construct. However, the response was not optimal because of the limited number of students attending the schools due to the COVID-19 pandemic. Thus, data collection was again carried out in three schools after the COVID-19 pandemic, where the learning process was already taking place offline. Thus, the total number of pilot questionnaires analyzed was 724 questionnaires.
Data Analysis
Data analysis was performed to examine the reliability and validity of the learning behavior questionnaire. It started by examining the amount of missing data (Post & Walma van der Molen, 2019) and calculating the standard deviation of the respondents on each item. Data were analyzed using SPSS V.20.0 and AMOS V.21.0. The correlation of each item with the total questionnaire items and the validity of the relationship with the criteria was undertaken by the Pearson correlation test. The sample adequacy test was measured using the Kaiser-Mayer-Olkin (KMO) measurement, Measure of Sampling Adequacy (MSA) test, and Uji Bartlet test of sphericity.
In compiling student learning behavior questionnaires, items are arranged based on indicators from each dimension, with total items 115 using a 5 Likert-scale (strongly disagree, disagree, sometimes, agree, and strongly agree). The questionnaire was validated by 10 experts in adolescent developmental psychology, counseling for high school students, and educational evaluation to assess the suitability of the content with the questionnaire indicators. Furthermore, the data was analyzed for content validity using the AIKEN method.
Next, the items were revised and examined for construct validity to test the validity of the internal structure of the indicators. Construct validity is critical when establishing functional relationships between unobservable variables, and factor analysis is a set of procedures designed to achieve various objectives (Hundleby & Nunnally, 1968). Construct validity was analyzed using exploratory factor analysis (EFA) and confirmatory factor analysis (CFA). Although both the EFA and CFA approaches seek to take into account the amount of variance in a set of observed variables with the general set of latent variables or factors, through EFA, researchers can find out the number of factors that must be maintained in the development of student learning behavior questionnaires (Hayton et al., 2004).
EFA has been done to determine the latent construct on a series of items in one variable and define the construct of a factor or dimension (Hu & Li, 2015). Factor analysis is a multivariate data reduction tool that produces correlated variables (Alkarkhi & Alqaraghuli, 2020). Successful analysis requires variables that are highly correlated, reliable, and determined by a large sample. The decision about the number of factors retained in the EFA analysis is crucial. Factor extraction is an activity to remove the variance of the common to set variables from the original matrix of association (Henson & Roberts, 2006). Therefore, in this study, the researchers extracted factors using the principal component analysis (PCA) method because, in developing the EFA analysis, it explores the direction of the items and has not seen identical items. PCA extract uses only the association matrix analyzed (Thompson & Daniel, 1996).
The factor rotation method uses Promax Kappa 4, assuming that the items in the instrument developed to have a strong correlation. The basic approach of Promax is to initiate an orthogonal rotation of the factor or component matrix by increasing the load to some strength to produce an ideal factor matrix. Promax is a new method for analytical rotation, where simple orthogonal structures are achieved through several rotation methods and then converted into inclined solutions (Hendrickson & White, 1964). Kappa is used as the power where the load is increased to determine the correlation between factors.
The number of factors is determined by the eigenvalue > 1 rule ( EV> 1) (Kaiser, 1960). The accuracy test of the method was carried out through the Root Mean Squared Error (RMSE) equation. The factor extraction steps in the PAF method are forming the covariance variance matrix, determining the inverse of the matrix, and determining the initial estimator to find the eigenvalues and eigenvectors and their communality values. The loading value of each item is cut off for items with low loading or used as a loading limit for the items analyzed. The recommended factor loading limit is less than 0.3 (Field, 2015).
The first step before conducting EFA is a data feasibility test to determine the correlation between independent variables, carried out through three tests: the KMO (Keyser Mayer Olkin) test, the MSA (Measure of Sampling Adequacy) test, and the Bartlet Test of Sphericity. Index of Factorial Simplicity KMO varies from 0 to 1, with the IFS level, that is, the value of KMO 0.50(unacceptable), in the < 0.5 (miserable), in the 0.60 (mediocre), in the 0.70 (middling), in the 0.80 (meritorious), and in the 0.90 (marvelous; Kaiser, 1974). A value of 0 indicates that the partial correlation is large relative to the number of correlations, indicating a diffusion in the correlation pattern (i.e., the factor analysis is inappropriate). A value close to 1 indicates a relatively compact correlation pattern, so factor analysis should produce reliable and distinct factors.
While the Bartlett Test of Sphericity aims to test the hypothesis that the simple correlation matrix is uncorrelated in the population, the criteria for the Bartlett Test of Sphericity is that data is said to be uncorrelated in the population if the value of χ2 count > χ2 table (Bartlett, 1950). In addition to the KMO test and Bartlett’s Test of Sphericity, the feasibility of the sample is also determined through the Measure of Sampling Adequacy test. The measure of Sampling Adequacy (MSA) is a very useful index for debugging non-conforming items before performing factor analysis solutions. In this case, the expected value for MSA is 0.50 (Cerny & Kaiser, 1977; Lorenzo-Seva & Ferrando, 2021).
Then, re-confirmation of concepts derived from references to indicators generated from the EFA test was conducted using CFA analysis is used because many factors in social and behavioral studies cannot be observed directly but are promising theoretical ideas of researchers, which is the basis of CFA (Hu & Li, 2015).
The fit index used in the CFA test is the most common model accuracy index using the chi-square value (χ2). It is expected that the chi-square value is not significant (p > .05); the good fit index value is expected to be≥ 0.90 (GFI values have a range of values between 0.00 (poor fit) until 1.00 (perfect fit); Comparative Fit Index >0.90, with the higher value, indicate better fit (>.95), Tucker-Lewis Index, higher value indicate better fit (>.95) (Hooper et al., 2008; Jöreskog & Sörbom, 1993; Wood, 2008). The expected value of Root Mean Square Error of Approximation (RMSEA) ≤ 0.05 indicates a close fit, whereas if the value is in the range 0.05 < RMSEA ≤ 0.08, the model can still be accepted as a fit model (good fit; Browne & Cudeck, 1992). The expected value of the Normed Fit Index (NFI) is ≥0.95; the Value AGFI (Adjusted Goodness of Fit) for model fit indication is ≥0.90 (Schumacker & Lomax, 2010).
Reliability was analyzed by Cronbach’s Alpha using the internal consistency method, with α≥ 0.9 meaning very good, .8
Results
Content Validation
In the FGD activity, the researchers asked the expert panel to provide their point of view on the items produced to construct the student learning behavior questionnaire. CVI is calculated for all individual items (I-CVI) and the Overall Scale (S-CVI). For the CVI, a panel of experts was asked to rate each scale item’s relevance to the underlying construct. Responses given by experts are given on a 5-point Likert scale. For each item, the I-CVI is calculated as the number of ranking experts divided by the total number of experts. It is recommended that the I-CVI should be 1.00 in the case of five or fewer experts, and in the case of six or more experts, I-CVI cannot be less than 0.78 (Shrotryia & Dhanda, 2019). Furthermore, the S-CVI is calculated to ensure the validity of the contents of the scale as a whole. This can be conceptualized in two events, namely by calculating S-CVI (universal Agreement) and S-CVI (Average). The minimum recommended S-CVI value must be 0.8 to reflect content validity (Polit & Beck, 2006; Shrotryia & Dhanda, 2019).
Based on the results of agreement on items and suggestions from experts after two consultations and integration and reference given by them, the learning behavior questionnaire part A related to student learning behavior in the classroom identified that 33 items (1, 2, 6, 7, 8, 14, 15, 16, 17, 20, 23, 25, 27, 28, 29, 32, 35, 37, 38, 41, 42, 45, 46, 47, 49, 50, 51, 52, 53, 54, 55, 56, and 59) were discarded and 27 items remained. Questionnaire Part B related to learning motivation identified that five items (1, 2, 16, 19, and 24) were discarded, and 25 remained. While questionnaire Section C identified that ten items (2, 4, 7, 8, 17, 18, 21, 22, 23, and 25) were discarded, and 15 items proceeded to phase two. Items retained because content validity Aiken Index value is greater than or equal to 0.79.
Based on the combination of the results of semi-structured interviews with six students of Junior high school Insafuddin, which was originally designed with 115 items of student learning behavior questionnaire statements. After the questionnaire was revised based on the results of feedback from six students of Junior high school Insafuddin, then a relevance analysis of the content of the items was assessed by six experts to produce a coefficient of V ≥0.79 (Aiken, 1985). The invited experts consisted of professors in the field of educational evaluation, experts in the field of instrument evaluation and psychology, and junior high school teachers in the field of counseling guidance. From the test results, the average values of Co(V), R(V), and Cl(V) were 0.80, 0.82, and 0.82. The final content of the test results obtained a new questionnaire containing 65 items. Each item has a Construction Validity (Co(V)), Relevance Validity (R(V)), and Clarity Validity (Cl(V)) level above 0.79 (Table 1).
Results of Aiken’s Analysis of Learning Behavior Questionnaire Scales A, B, and C.

*Konten validity Aiken ≥ 0.79.
Item Analysis
The consistency of each item of the learning behavior questionnaire was assessed using the Cronbach Alpha score. The Pearson Correlation Coefficient was used to test the relationship between the score of each item with the total score. The assessment provisions of the item will be deleted if the correlation coefficient is small (r≤ 0.13) or not significant (p > 0.05). According to the analysis results, the data for three items in part A (items 8, 14, and 20) must be discarded because they are invalid. The three items are confusing, namely (when the teacher explains the lesson in class, I only study the important material, I find it difficult to focus on learning during class sessions, and an important part of learning in class is learning to get along with others. Furthermore, one item in part B (i.e., item 1 of the statement “when the teacher asks me in class, I am afraid my classmates laugh at me because I don’t know the answer”) should also be discarded because it is invalid. While in part C, all items are declared valid and can be used. As a result, 64 items were refined and analyzed further. The results can be seen in Table 2.
Results of Validation Test of Learning Behavior Questionnaire Sub-Scale A, B, and C.

Note. r table = .129.
p < .05.
Construct Validity
Construct validity testing examines whether the instrument developed can be translated or adapted to a different country or culture. Construct validity testing was done through EFA and CFA.
Exploratory Factor Analysis (EFA)
EFA was conducted on 63 items from three parts of the learning behavior questionnaire. The test was separated into three parts: Scale A (24 items on the learning behavior in the classroom, Scale B (24 items on learning motivation), and Scale C (15 items on student social interaction outside the classroom).
Scale A analysis showed that the Kaiser-Meyer-Olkin Measure of Sampling Adequacy was 0.803 (meritorious), and the Bartlett of Sphericity test was 2,591.286 (p = .00), meaning that the sample sufficiently represented the population. Thus, the factor analysis can be continued because they met the first requirement. The next requirement was MSA ≥ 0.50 from SPSS 20.0 by looking at the anti-image matrix to determine whether variables are suitable for factor analysis (see Table 3).
Extraction Value and Pattern Matrix A Sub-Scale Item of the Learning Behavior Questionnaire in the Classroom.

The EFA test using SPSS 20 indicated 18 indicators with an MSA ≥ 0.50. The Total Variance Explained showed seven components with eigenvalues > 1: learning strategy, group study, perseverance, love of learning, Independent learning, study competition, and sitting position. The sitting position dimension has lower Initial Eigenvalues than other dimensions and only has one item, so the indicator is excluded from further analysis.
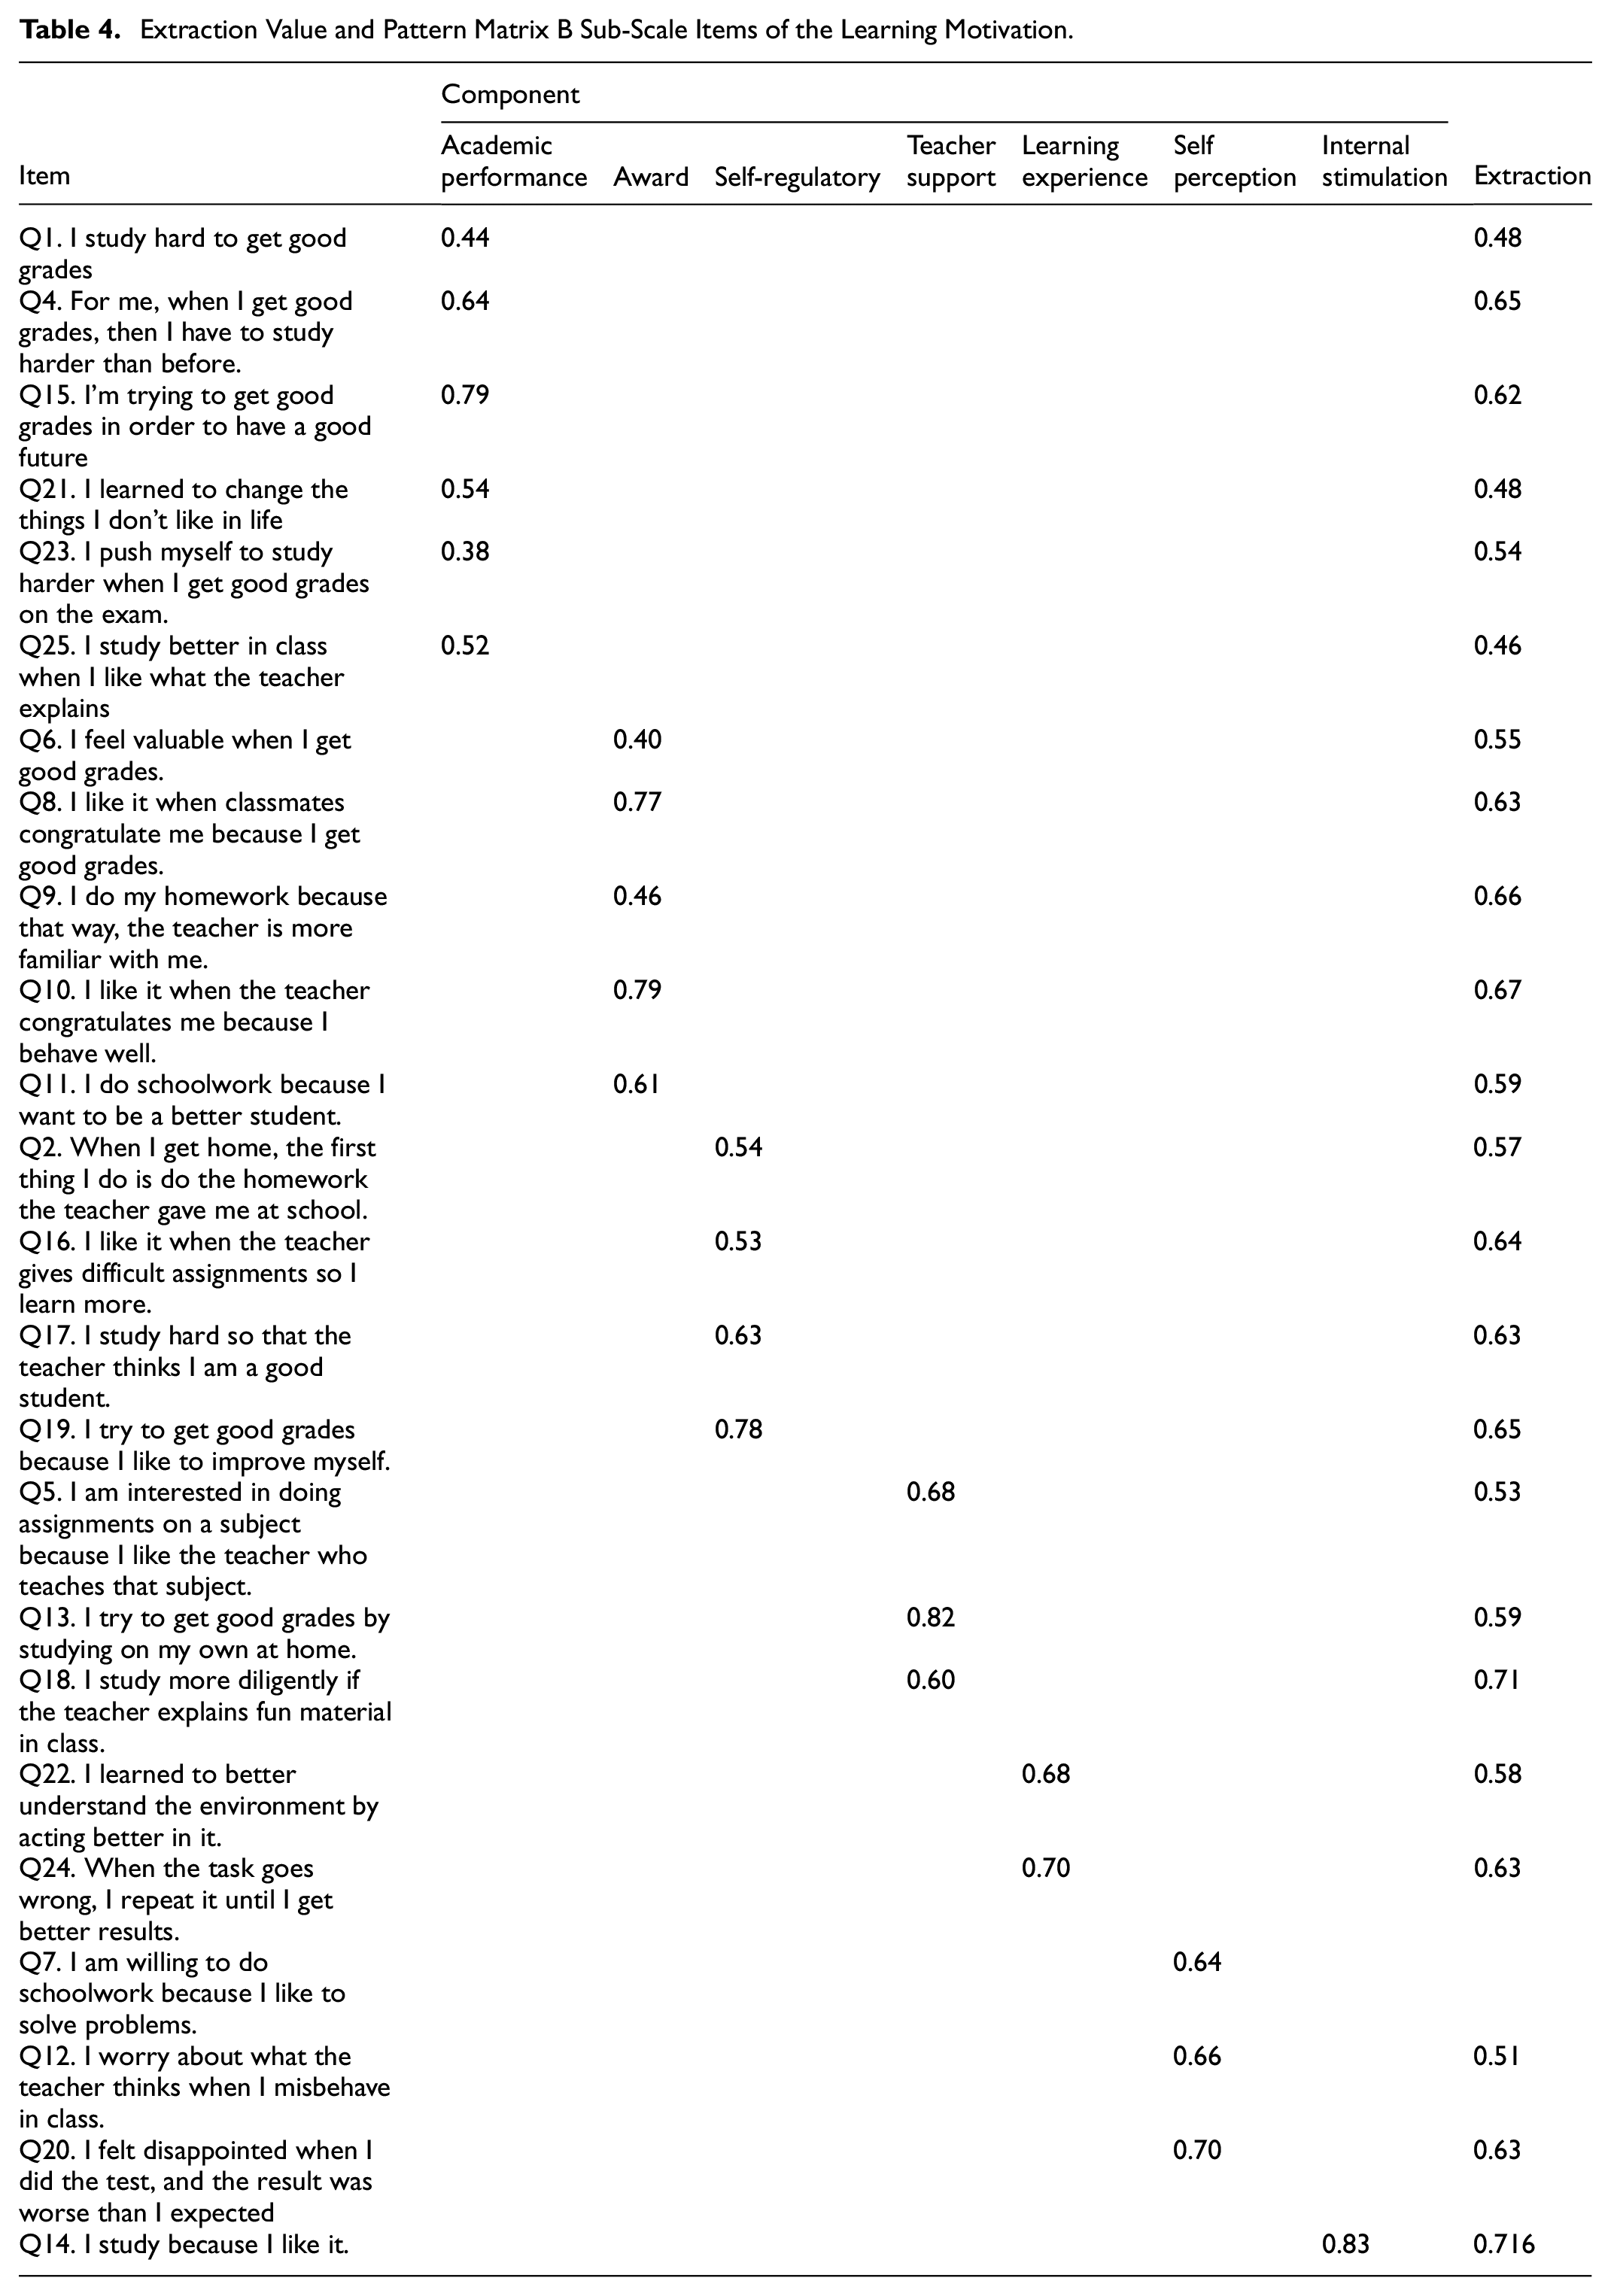
The results of the part B test, the final version of the questionnaire evaluated using EFA, showed the KMO measure of 0.78 (average) and the Bartlett of Sphericity test of 2,893.231 (p = .00). The sample sufficiently represented the population, so we proceeded with the factor analysis. The results of the B scale analysis found 23 items with an MSA of 0.50 and could be reduced to seven components. The EFA on the B scale of learning motivation resulted in 19 items, with an MSA ≥ 0.50, formed into seven components with the eigenvalue > 1: academic performance, awards, self-regulatory, teacher support, learning experience, and self-perception (see Table 4).
Extraction Value and Pattern Matrix B Sub-Scale Items of the Learning Motivation.
Furthermore, the EFA of part C revealed that item Q8 (parents limit all my actions in a good way) did not meet the statistical test criteria and was excluded from further analysis because it has a factor loading of less than 0.5. The KMO measure was 0.61 (mediocre), and the Bartlett of Sphericity test was 895.684 (p = .00); thus, the analysis could proceed. Based on the total variance explained, it can be concluded that the 15 items can be reduced to seven factors (see Table 5).
Extraction Value and Pattern Matrix C Sub-Scale Items of Students’ Social Interactions Outside the Classroom.

The EFA of the C scale is based on initial eigenvalues, forming six loading factors consisting of 14 items. There are six components with eigenvalues > 1: independent learning, appreciation, parental involvement, family support, The role of parents, and positive relationship. The test results concluded that the KMO measures for the A, B, and C scales were 0.80, 0.78, and 0.61, respectively, and all p-values were ≤ .05. The final results of the construct validity test with EFA analysis obtained 48 items (17 items of scale A, 19 items of scale B, and 12 items of scale C) satisfying the statistical test criteria with communality requirements greater than .5.
Confirmatory Factor Analysis (CFA)
The CFA was carried out to test the accuracy of the model with the existing data, namely to see the relationship between the items from the EFA and the construct being measured. In the EFA, an item with a factor loading above 0.4 was declared valid. Thus, of the 24 items on the A scale of learning behavior in the classroom, 17 were valid for CFA analysis, and seven items with a factor loading < 0.4 were excluded from further analysis. The CFA was conducted for seven components: learning strategy, study in groups, perseverance, love of learning, independent learning, and study competition. The results of the CFA showed that the model fit indices of the proposed learning behavior questionnaire were as follows: RMSEA = 0.062; GFI = 0.922; CFI = 0.953; NFI = 0.919; and TLI = 0.939, indicating a fit model (see Figure 3).

Results of CFA Questionnaire Testing Part A Learning Behavior in the Classroom.
The EFA of the B scale resulted in the learning motivation questionnaire being divided into seven components. One component with low factor loading was excluded from the CFA follow-up test. In addition, the EFA revealed that the equivalent value of component seven was the lowest among other components, so it was also excluded from the CFA. Hence, the CFA test was carried out on six components (19 items).
Figure 4 shows that the learning motivation questionnaire measurement model proposed is a fit model, with RMSEA = 0.037; GFI = 0.940; CFI = 0.971; NFI = 0.911; and TLI = 0.964. On the C scale of the student social interaction questionnaire outside the classroom, six components are formed: (1) independent learning (4 items); (2) appreciation (3 items); (3) parental involvement (2 items); (4) family support (3 items); (5) The role of parents (1 item), and (6) positive relationship (1 item). The test results obtained the value of RMSEA = 0.035; GFI = 0.967; CFI = 0.987; and TLI = 0.983 (see Figure 5).

Results of the CFA Testing Scale B Questionnaire Student Learning Motivation.

Results of CFA Testing on the C scale of the Student Social Interaction Questionnaire outside the Classroom.
The CFA results, with a total of 318 students, showed that the goodness of fit (GOF) of the model was acceptable. The learning behavior scale model consists of three parts: the A scale with six components (17 items), the B scale with six components (19 items), and the C scale with four components (12 items), which are acceptable. The analysis results show that each dimension can distinguish between one dimension and another. Based on the EFA and CFA results, it can be concluded that the learning behavior scale has met the psychometric criteria and is declared valid to be used as a tool for measuring the learning behavior of junior high school students.
Once the learning behavior questionnaire satisfied the validity test, the researchers proceeded to test the reliability of the questionnaire by Cronbach’s Alpha using the internal consistency method. The Cronbach’s Alpha for A Scale is .851 (good internal consistency), meaning that 17 items for the component “Students’ learning behavior in the classroom” are reliable. The Cronbach’s Alpha of scale B is .723, meaning that the internal consistency of 19 items for the learning motivation component is in the acceptable category. Furthermore, Cronbach’s Alpha C scale is .664, which is in the moderate reliability category, but the questionnaire can be said to be reliable.
Discussion
The integrity of student learning behavior can determine the depth of student ability development because learning behavior is integral to encouraging student learning. Learning behavior is the mental readiness of students to learn (Saxena, 2002). Learning behavior can be observed through the responses shown by students in learning situations and reactions to academic assignments (Chao et al., 2018). Measurement of student learning behavior can be done by a comprehensive evaluation tool. Learning behavior can also be measured using the term learning style (Farid et al., 2014). Therefore, this research was conducted to develop a student learning behavior questionnaire. The questionnaire preparation initially referred to the suggestions and opinions of junior high school students and experts in their fields. At the same time, considering the differences in ideology, culture, character, and learning methods that apply at junior high schools in Banda Aceh, Indonesia gradually revised the topics and items from the questionnaires developed by previous researchers.
The validity test of the learning behavior questionnaire resulted in the final version consisting of 48 question items from three sub-scales: A scale of learning behavior in the classroom, B scale of student learning motivation, and C scale of students’ social interactions outside the classroom. The classroom learning behavior questionnaire has six components: learning strategy, study in groups, perseverance, love of learning, independent learning, and study competition. This finding provides a new indicator different from Grasha-Risechmann’s research classifying the indicators questionnaire of learning behavior in the classroom with six indicators: independent, avoidant, competitive, dependent, collaborative, and participatory learning styles (Grasha & Riechmann, 1989).
Learning behavior is an effective effort toward learning, problem-solving, strategy, flexibility, persistence, attention, reflectivity, and response to novelty and mistakes (Yen et al., 2004). Classroom learning behavior must be accompanied by perseverance, response to direction and attention, and student interaction to learn (Farid et al., 2014; Smith, 2015). Thus, to measure student learning behavior in the classroom, apart from the indicators found in Grasha-Risechmann’s research, two other important components influencing student learning behavior were also found: the perseverance component and the love of learning component. Students’ love for learning can generate internal motivation to maintain curiosity and learn new things taught in the classroom. Love of learning is a complex need regarding the relationship between teachers, students, and subject matter (Dale & Frye, 2009). The subject matter presented by the teacher will be meaningful to students if students love the materials. Thus, changes in student learning behavior in the classroom can occur, with students being more diligent in learning both in groups and through independent learning.
The student motivation questionnaire on the B scale refers to students’ strong psychological tendencies toward learning activities. So, learning motivation is the biggest force to influence learning behavior. Several factors influence student learning behavior, such as teacher participation, parental influence, school quality, and student motivation (Jebaseelan, 2016). Rahman’s research found that student learning motivation consists of three main components: entry mastery, learning opportunity, and student motivation (Rahman et al., 2012). Student motivation can be obtained through external stimulation in the form of potential stimuli obtained by students from the environment (Wu et al., 2021). Strong learning motivation can be accompanied by a positive learning attitude to stimulate positive learning behavior (Chong et al., 2016).
Therefore, exploration related to learning motivation becomes the second focus of this research. This study found that the B scale of the student learning motivation questionnaire consists of six components: academic performance, awards, self-regulatory, teacher support, learning experience, and self-perception. Previous research found that learning motivation can be obtained from internal stimuli, praise, rewards or punishments, student experiences, teacher and peer support, and self-perception (Singh et al., 2022). However, academic performance and student self-regulation are important components influencing learning motivation, which is rarely highlighted. Self-regulation leads to more effective goal pursuit toward understanding intrapersonal processes in achieving future goals (Fitzsimons & Finkel, 2010). Self-regulation is closely related to emotions in children (Eisenberg & Sulik, 2012). Therefore, it is paramount to include a self-regulation component in measuring changes in student learning motivation. In addition, the study results also show that the academic performance component is the dominant factor affecting student learning motivation, with the eigenvalue of 5,445 or 22,689% of aspects of student learning motivation being influenced by these components. Students’ academic success can be obtained from positive interactions between peers outside the classroom (Callahan, 2008)
The last scale of the learning behavior questionnaire analyzed for validity was the C scale of the student social interaction questionnaire outside the classroom, the basic unit influencing student learning behavior tendencies. Cognitive learning theory states that the key to learning lies in forming students’ psychological structures through original cognitive structures and external stimulation (Wu et al., 2021). There is a close relationship between student learning behavior and students’ social interactions outside the classroom (Cocieru et al., 2020).
Social interaction and academic ability among students form a good learning experience among students. Furthermore, independent learning behavior encourages students to learn outside the classroom through pedagogical activities that can connect learning in the classroom with learning center resources (Hsieh & Hsieh, 2019). Therefore, to measure students’ social interactions outside the classroom, the researchers divided them into four components: independent learning, appreciation, parental involvement, and family support. Previous studies found that student learning behavior could be influenced by parental investment (Jebaseelan, 2016). However, there is no complete mention of the parental investment in question. The research findings revealed that partially parental investment affects students’ social interaction behavior outside the classroom, parental involvement, the role of parents, and family support.
The research findings indicate that the questionnaire is valid and reliable. A learning behavior questionnaire is a tool that can be used to assess the learning behavior of junior high school students. The advantage of this questionnaire is that its development pattern is based on empirical data and existing literature, and the assessment of its construct validity is carried out through EFA and CFA. One of the limitations of this study is that it implicates the close relationship of junior high school students to one another, which might result in similar responses to items from the learning behavior questionnaire. Therefore, psychometric evaluation of the developed questionnaire is recommended in different cultural and customary contexts. Further research can be carried out to evaluate the tool in the context of students at different levels considering that the application of student learning behavior can be influenced by culture and student characteristics. In addition, the questionnaire developed was not based on the student’s gender, so when applied to other students, a thorough adaptation needed to be determined further.
Conclusions
Learning behavior is a form of mental readiness students have in theoretical and practical learning through skills, activeness, creativity, and learning motivation developed stably inside and outside the classroom. The final results of testing the validity of the learning behavior instrument obtained three main factors that influence changes in student learning behavior: (1) student learning behavior in the classroom consists of six components, namely learning strategies, group learning, perseverance, love of learning, independent learning and learning competitions, (2) student learning motivation consisting of six components: academic achievement, appreciation, self-regulation, teacher support, learning experience, and self-perception, and (3) students’ social interactions outside the classroom consisting of four components: independent learning, appreciation, parental involvement, and family support. The learning strategy is the dominant factor influencing student learning behavior in the classroom, academic performance is the dominant factor influencing student learning motivation, and independent learning is the most dominant factor influencing student social interaction outside the classroom. The validity and reliability tests indicate that the developed learning behavior questionnaire can be used to evaluate the learning behavior of junior high school students.
Footnotes
Appendix 1
Data Sharing Statement
The datasets used and/or analyzed during the current study available from the corresponding author on reasonable request.
Funding
The author(s) disclosed receipt of the following financial support for the research, authorship, and/or publication of this article: The authors would like to thank the Directorate of Research and Community Service, the Directorate General of Research and Development Strengthening, the Ministry of Research and Technology/National Research and Innovation Agency for funding research activities in accordance with the Research Contract for Fiscal Year 2021 Number: 154/SP2H/LT/DPRM/ 2021 March 18, 2021.
Declaration of Conflicting Interests
The author(s) declared no potential conflicts of interest with respect to the research, authorship, and/or publication of this article.
Data Availability Statement
The data underlying the findings in this study are available from the lead author upon reasonable request.
Public Interest Statement
This study highlights the importance of measuring student learning behavior as a foundation for future educational policy and reform. Understanding how students behave in learning environments-both academically and socially-provides valuable insights for educators, school administrators, and policymakers. By validating a reliable measurement tool, this research supports early identification of behavioral patterns that influence academic success, allowing for more targeted and effective interventions.