
Abstract
This research explores the influence of Indian Prime Ministerial elections on the NSE Nifty 50 index, focusing on the election periods of 2019 and 2024. By employing an event study methodology combined with the Exponential Generalized Autoregressive Conditional Heteroskedasticity (EGARCH) model, the study evaluates how electoral events affect market behavior and volatility. The analysis covers event windows from April 1 to June 10 in both years, providing a comprehensive view of market reactions before, during, and after the elections. The results reveal significant market volatility around election dates, accompanied by notable fluctuations in stock returns. The EGARCH model underscores the presence of volatility clustering and the substantial impact of election-related news on market stability. This study provides insights into the impact of elections on financial markets in emerging economies like India, offering valuable guidance for investors, policymakers, and analysts.
Plain Language Summary
This research looks at how the Indian Prime Ministerial elections in 2019 and 2024 impacted the NSE Nifty 50 index, which is a major stock market index in India. It uses an event study approach with an EGARCH model to analyze how these elections affected the stock market’s behavior and volatility. The study examines the period from April 1 to June 10 in both years to understand how the market reacted before, during, and after the elections. The findings show that there was a lot of market volatility around the election dates, with noticeable changes in stock returns. The EGARCH model highlights that there was significant volatility clustering, meaning that periods of high volatility were followed by more periods of high volatility. Election-related news had a major effect on market stability. This research provides useful insights into how elections influence financial markets in emerging economies like India, which can help investors, policymakers, and market analysts make better-informed decisions.
Introduction
The effect of political events on financial markets is widely recognized and documented, especially in emerging economies like India, where general elections can have significant political and economic consequences. This paper examines the effect of Indian Prime Ministerial elections on the NSE Nifty 50 index, focusing on two critical periods: the 2019 elections, held from April 11 to May 19, and the 2024 elections, from April 19 to June 1. By analyzing the daily closing prices of the NSE Nifty 50 index during the event windows from April 1 to June 10 for both years, this study seeks to understand how election outcomes influence market behavior.
The 2019 and 2024 Indian Prime Ministerial elections have been chosen for this study because they represent pivotal moments in India’s political and economic history, with contrasting market conditions and policy expectations. The 2019 elections were held between April 11 and May 19, with results announced on May 23, and the 2024 elections occurred between April 19 and June 1, with results declared on June 4. These elections capture periods of significant investor sentiment shifts and policy uncertainty, making them ideal for analyzing electoral impacts on financial markets. By collecting data from April 1 to June 10 for both years, this study ensures a comprehensive analysis of market reactions during pre-election, election, and post-election phases.
Despite extensive literature on the impact of political events on financial markets, research focusing on India’s unique electoral environment remains limited. Recent studies, such as Dahal et al. (2021) and Gour (2020), emphasize the sensitivity of stock markets to electoral events but fail to explore the interplay of volatility and abnormal returns during such periods in India. Yulyana et al. (2024) highlight significant barriers faced by voters with disabilities during the COVID-19 pandemic in East Karawang, emphasizing issues such as inadequate socialization, insufficient assistive measures, and limited participation. The authors argue that “inconsistency and lack of synergy among election organizers” undermined efforts to ensure accessibility, reflecting a critical gap in democratic responsibility. Similarly, Alim et al. (2024) investigate the impact of political stability on Pakistan’s stock market, finding that it significantly influences returns and volatility. Using GARCH and EGARCH models, the authors reveal that “negative shocks (political instability) create more volatility in the stock market than positive shocks,” highlighting the need for resolving political instability to foster stable financial markets. This study addresses these gaps by employing an event study methodology combined with the EGARCH model to analyze election-related market dynamics and provide novel insights into how these dynamics evolve over time.
Research consistently shows that political uncertainty can significantly impact stock market performance. Pástor and Veronesi (2013) note that “political uncertainty can have a significant impact on stock prices and returns.” Similarly, Białkowski et al. (2008) observed that “elections often lead to increased market volatility and can affect investor behavior.” In the Indian context, Dahal et al. (2021) investigated the effect of the 2020 U.S. presidential election on Indian stock market sectoral indices, revealing a positive short-term impact and no significant long-term effects, indicating market efficiency. Kabiru et al. (2015) examined the influence of general elections on stock performance at the Nairobi Securities Exchange, highlighting that election-induced market reactions can be highly volatile, with significant impacts observed in certain election years.
This study contributes to the literature by examining how the stock market responds to Indian general elections, focusing on the potential for policy changes and shifts in economic priorities. During elections, market reactions are often characterized by heightened volatility and changes in trading volumes as investors adjust their strategies based on anticipated policy changes and political stability. By analyzing market responses during the 2019 and 2024 elections, this paper offers a unique perspective on the interplay between political events and financial markets, addressing a critical gap in the literature. The findings of this study will provide valuable insights for investors, policymakers, and market analysts navigating periods of political change, offering practical implications for understanding and managing election-induced market dynamics. This study integrates an event study methodology with the EGARCH model to analyze stock market volatility during the 2019 and 2024 Indian elections. By comparing volatility clustering and cumulative abnormal returns across these two election cycles, the research offers a forward-looking perspective on managing political risk in emerging markets.
The study is motivated by the need to understand how recurring political transitions, particularly elections, influence financial market performance in emerging economies. With increased foreign participation in Indian markets and rising investor sensitivity to political news, assessing the impact of electoral cycles becomes crucial. The comparative nature of this research, focusing on two significant election cycles 2019 and 2024 offers a unique opportunity to understand evolving investor behavior in the face of political uncertainty.
This study is compelling due to the structural political changes occurring in the political landscape, which have a direct impact on financial markets. Political shifts influence investor sentiment, market stability, and economic policies, making it essential to analyze how stock markets respond to electoral periods. Given the heightened volatility observed during elections, this study aims to assess the market’s reaction to structural political transformations and their implications for investors, policymakers, and regulators. The specific objectives of this study are:
To determine whether Indian Prime Ministerial elections significantly impact stock market returns of the NSE Nifty 50 index during the election periods.
To analyze changes in market volatility during election cycles and compare fluctuations between the 2019 and 2024 elections.
To examine the role of structural political changes in shaping investor sentiment and market behavior during electoral periods.
To provide insights for investors, policymakers, and regulators on managing election-induced market uncertainty and mitigating financial risks.
To assess the effectiveness of pre-election policy transparency and regulatory interventions in stabilizing market reactions.
Review of Literature
Financial markets often exhibit significant volatility around election periods, driven by investor sentiment, policy expectations, and economic uncertainty. Several studies have analyzed the impact of elections on stock markets across different countries, revealing varying effects depending on political conditions, investor behavior, and macroeconomic factors.
Wagner et al. (2018) highlight the immediate and substantial market reactions following Donald Trump’s victory in the 2016 U.S. presidential election, reflecting investor expectations regarding future economic policies. The study details sectoral and company-specific responses, emphasizing both short-term fluctuations and long-term adjustments based on anticipated policy shifts. Ulyah (2019) explores the influence of the 2019 Indonesian Presidential election on financial markets, focusing on the IDX Composite and stocks related to the candidates. By incorporating pre-election sentiment as a dummy variable within ARIMA and VAR models, the findings suggest that market returns were not significantly impacted by pre-election conditions.
Khan et al. (2017) assess the effects of political elections on the KSE-100 index from 1998 to 2013, utilizing event study methodology. The results indicate negative stock return impacts following the 2002 and 2008 elections, whereas the 2013 election led to positive market movements. The findings underscore the dynamic nature of investor behavior in response to political transitions. Market sentiment surrounding U.S. elections is further analyzed by Shaikh (2019), who focuses on the implied volatility index during the 2012 and 2016 elections. The research demonstrates heightened investor concerns before election day, followed by a sharp decline in volatility post-election, challenging the presidential election cycle hypothesis.
Memon et al. (2020) employ a minimum spanning tree network approach to examine the KSE-100 index across three general elections in Pakistan. The analysis identifies distinct network structures pre- and post-election, with the fertilizer sector emerging as a key intermediary. These insights provide valuable guidance for policymakers and investors regarding market stability and diversification. Liew et al. (2016) discuss Malaysia’s general elections and their effects on the FBMKLCI index, noting substantial post-election surges. The study attributes these fluctuations to macroeconomic variables and political uncertainty, particularly in closely contested elections such as those in 2008 and 2013.
Ariani and Kristianto (2024) evaluate abnormal returns and stock price volatility surrounding the Indonesian general election using a 14-day event study methodology. The findings reveal significant abnormal returns post-election but no major change in cumulative abnormal returns (CAAR), reflecting a positive market reaction to electoral outcomes. Osuala et al. (2018) and Deari and Koku (2024) analyze the Nigerian stock market’s response to the 2011 and 2015 presidential elections, revealing a significant negative impact in 2011 but an insignificant positive reaction in 2015. The transition from PDP to APC in 2015 appears to have influenced market perceptions.
Prechter et al. (2012) establish a positive correlation between the incumbent’s vote margin and past stock market performance in the U.S., supporting socionomic voting theory. The research suggests that social mood, reflected in market trends, plays a greater role in election outcomes than traditional economic indicators like GDP, inflation, and unemployment. Nugraha and Nugraha (2020) analyze stock price movements and trading volumes on the Indonesian Stock Exchange from April to June 2019. The results indicate that post-election stock prices and abnormal returns were generally lower than in pre-election periods, signaling reduced investor confidence.
Contrary to conventional expectations, Leblang and Mukherjee (2004) argue that anticipated Democratic victories in U.S. elections reduce market volatility. Using advanced econometric models such as GARCH and EGARCH, the findings reveal that Democratic wins stabilize financial markets rather than inducing turbulence. Jiun (2019) investigates the Malaysian stock market from 1994 to 2015, highlighting the significant influence of political uncertainty on volatility, particularly in the 2008 and 2013 elections. The Threshold GARCH model confirms the existence of distinct pre- and post-election effects.
Ruven (2019) assesses abnormal stock returns in Indonesia across the 2014, 2016, and 2019 presidential elections. Employing an event study methodology, the research provides insights into how political events shape market behavior and investor decision-making. Jamil (2019) examines five parliamentary elections in relation to stock market performance, emphasizing that while average abnormal returns remained insignificant, cumulative abnormal returns exhibited substantial election-related effects. The study further identifies high post-election volatility.
Gour (2020) explores the impact of the 2019 Indian Lok Sabha election on S&P BSE SENSEX, NSE NIFTY, and sectoral indices. Despite an initial decline in returns, a sharp rebound followed, benefiting banking stocks while FMCG stocks underperformed. Lafortune (2014) conducts a cross-European analysis of stock market fluctuations before and after elections, incorporating macroeconomic considerations such as the Euro’s implementation and shifts in political ideology. The study provides a broader understanding of election-induced volatility.
Oehler et al. (2013) assess U.S. presidential elections from 1976 to 2008, identifying significant cumulative abnormal returns for various industries. The findings suggest that individual presidents and policy decisions exert greater influence on market outcomes than party ideologies alone. Menge (2013) focuses on the Nairobi Securities Exchange, demonstrating that pre-election stock returns are typically higher than post-election returns. This pattern underscores the importance of election timing in investment strategies.
Sturm (2013) evaluates stock returns within the context of presidential election cycles, distinguishing these effects from broader economic policy impacts. The results indicate that stock market trends can exert a stronger influence on economic policy than vice versa. Diaconaşu et al. (2023) explore international investor reactions to Donald Trump’s unexpected 2016 victory, supporting the Overreaction Hypothesis. Initial negative reactions were followed by corrective upward price movements, presenting potential opportunities for contrarian investment strategies.
Kirana and Sembel (2019) analyze Indonesian elections and stock performance, identifying fluctuations in trading volume rather than significant abnormal returns. Meanwhile, Ratnaningsih and Widanaputra (2019) detect notable positive abnormal returns around the 2019 election announcement, reflecting market optimism toward Jokowi-Maaruf’s victory. Bouoiyour and Selmi (2016) evaluate sectoral stock market responses to presidential elections, questioning the validity of the Uncertain Information Hypothesis (UIH). The research highlights sector-specific reactions influenced by anticipated policy shifts under new administrations.
Arif and Sudjono (2021) assess the Indonesian stock market’s response to the 2019 election, concluding that abnormal returns and trading volume remained largely unaffected, indicating minimal election-related market disruptions. Kayaçetin (2023) examines Turkish elections and their effects on Borsa Istanbul indices and the USD/TRY exchange rate, noting significant positive abnormal returns for stocks but negative returns for the exchange rate, suggesting increased market volatility.
Kumar Deva et al. (2015) establish a strong relationship between the 16th Lok Sabha election and stock market behavior in India, highlighting investor sentiment’s role in shaping portfolio decisions. Chavali et al. (2020) compare market reactions to consecutive electoral victories in India, finding significant positive abnormal returns for both 2014 and 2019. These studies collectively demonstrate that election-related market reactions vary widely, influenced by factors such as political stability, investor sentiment, macroeconomic conditions, and sectoral dynamics. The insights gained from these analyses contribute to a broader understanding of financial market behavior in response to political events.
This research is grounded in theories of political uncertainty and market efficiency, supported by behavioral finance and econometric modeling. The Efficient Market Hypothesis (EMH) posits that financial markets reflect all available information, including political developments. However, during elections, investor behavior often deviates from rational expectations due to heightened emotions and uncertainty. To model these effects, the event study approach captures immediate price reactions, while the EGARCH model accounts for asymmetric volatility responses, particularly in the presence of negative news or shocks. Together, these frameworks offer a comprehensive theoretical base for understanding election-induced volatility and market behavior in an emerging economy like India.
Research Gap
Existing studies (e.g., Białkowski et al., 2008; Pástor & Veronesi, 2013) emphasize the role of elections in increasing market volatility but fail to provide a comparative analysis of election-induced volatility over multiple electoral cycles within the same country. Furthermore, prior research has largely analyzed single-election periods without assessing how electoral market behavior evolves over time. Previous studies have explored the short-term effects of elections on abnormal returns (AR) and cumulative abnormal returns (CAR) but have not examined whether volatility patterns shift between different election years.
Another major gap is the lack of studies incorporating structural political changes into financial market analysis. Political shifts, policy realignments, and governance changes introduce uncertainty beyond election cycles, influencing investor sentiment and market reactions. However, prior literature does not fully explore this aspect, particularly in emerging economies like India. The literature section highlighted the impact of budget announcements on stock market performance and related aspects. Prior studies have examined the influence of fiscal policies, tax reforms, and government spending on market volatility, investor sentiment, and stock returns. While these studies provide valuable insights, significant gaps remain unaddressed. First, existing research predominantly focuses on developed economies, with limited attention to emerging markets like India. Given the structural differences in financial markets, investor behavior, and economic policies, findings from developed economies may not be directly applicable to the Indian context. The lack of region-specific studies weakens the generalizability of existing conclusions.
Hypothesis
Based on the identified research gaps, the following hypotheses are formulated to examine the impact of Indian Prime Ministerial elections on the NSE Nifty 50 index across multiple election cycles:
H1: Indian Prime Ministerial elections have a significant impact on the stock market returns of the NSE Nifty 50 index.
H2: Stock market volatility increases significantly during election periods compared to non-election periods.
H3: The 2024 elections exhibit greater market volatility than the 2019 elections.
H4: Structural political changes beyond election outcomes contribute to financial market fluctuations.
Event
The event is Indian Prime Ministerial elections, held from April 11 to May 19, 2019, and from April 19 to June 1, 2024. These elections are crucial as they introduce political uncertainty and potential changes in economic policies, which can significantly influence financial markets. The analysis examines how these election periods impact the NSE Nifty 50 index, focusing on market reactions and volatility before, during, and after the elections. The event windows (April 1 to June 10) were chosen to capture pre-election, election, and post-election market dynamics comprehensively. This selection is based on prior event studies (Memon et al., 2020), which suggest that a 10-day pre-event period is sufficient to assess investor sentiment buildup, while a 10-day post-election window allows for measuring the immediate impact of election results. Additionally, alternative windows (e.g., ±15 and ±20 days) were tested for robustness, confirming that the selected event period effectively captures significant market movements.
The Table 1 outlines the event windows for the Indian Prime Ministerial elections of 2019 and 2024. Each window is categorized into three phases. The pre-event window captures market behavior leading up to the elections, the event window covers the actual election days, and the post-event window assesses market reactions following the elections.
Event Window Considered for the Study.

Source. Based on event occurrence.
The period of study for each election year spans from April 1 to June 10, encompassing a total of 71 days. During this period, data for the NSE Nifty 50 index is collected and analyzed. The pre-event window (10 days before the elections) is used to observe market trends and performance leading up to the elections. The event window (dates of the elections) focuses on capturing immediate market reactions. Finally, the post-event window (days following the elections) is examined to understand any enduring impacts on market performance. AR and CAR are calculated and analyzed during these windows to assess the impact of the elections, as detailed in the data analysis and interpretation section.
Research Methodology
This study employs an event study methodology combined with EGARCH model to analyze the impact of the Indian Prime Ministerial elections on the NSE Nifty 50 index during the 2019 and 2024 election periods. The event study focuses on daily closing prices within event windows from April 1 to June 10 for both years, calculating AR and CAR to assess market reactions around election dates. The EGARCH model is employed in this study due to its ability to capture asymmetric volatility and leverage effects, which traditional models like GARCH fail to address. Unlike the standard GARCH model, EGARCH allows for the modeling of negative and positive shocks differently, making it particularly suitable for analyzing election-induced market fluctuations. Previous studies (Białkowski et al., 2008) have shown that market reactions to elections often exhibit volatility clustering, making EGARCH a more appropriate choice for understanding stock return dynamics during uncertain periods.
Daily Stock Prices: Sourced from NSE Nifty 50 for the event windows surrounding the Indian elections of 2019 and 2024.
Abnormal Returns (AR): Calculated as the difference between actual returns and expected returns benchmarked against market performance.
Cumulative Abnormal Returns (CAR): Aggregates AR over the event window to assess the overall market impact.
Volatility: Modeled using the EGARCH framework to examine time-varying and asymmetric responses.
Theoretical and empirical relevance of these variables are derived from studies such as Pástor and Veronesi (2013) and Memon et al. (2020).
Data Analysis and Interpretation
Abnormal Return
AR represent the variance between an asset’s actual performance and its anticipated return, usually compared to a benchmark index. In financial analysis, these returns are crucial for assessing the impact of specific events on asset performance, ensuring that any deviations align with the timing of these events. Financial studies often focus on abnormal returns following events, utilizing the market model to forecast expected returns. AR are determined using the following formula:

Here,
Cumulative Abnormal Return
To analyze an event’s impact, abnormal returns must be aggregated across securities and time periods. This involves first aggregating abnormal returns for each individual security over time and then extending this aggregation to multiple securities and periods. The Cumulative Abnormal Return (CAR), denoted as

Descriptive Statistics
Table 2 describes the descriptive statistics for the NSE Nifty 50 stock market data for the years 2019 and 2024, revealing notable shifts in market behavior in response to Indian elections. The mean return increased from 5.22% in 2019 to 8.27% in 2024, indicating a more favorable average performance in 2024. However, this positive shift is accompanied by increased volatility, as demonstrated by a higher standard deviation (1.3041 in 2024 vs. 0.9546 in 2019) and a broader range of returns. The standard error and confidence interval also widened in 2024, reflecting greater variability in sample means and less precision in estimating average returns.
Descriptive Statistics for NSE Nifty 50 (2019 and 2024).

Source. Authors calculation.
The distribution of returns in 2024 is characterized by higher kurtosis (10.1599 vs. 3.3992) and a shift from positive skewness in 2019 (1.2417) to negative skewness in 2024 (−1.5022). This indicates that the 2024 data include more extreme values and exhibits a pronounced asymmetry compared to 2019. The median return shifted significantly from −10.66% in 2019 to 12.02% in 2024, highlighting a substantial change in the central tendency of returns.
In summary, while the average returns improved in 2024, the market experienced greater volatility and a wider spread of returns, suggesting a more pronounced and variable impact of the 2024 election on the NSE Nifty 50 compared to the 2019 election.
T-Statistics
Table 3 presents the t-statistics for NSE Nifty 50 returns for the years 2019 and 2024, shedding light on the effect of Indian elections on the stock market. For 2019, the mean return was 5.22% with a SD of 0.9546, resulting in a t-statistic value of 0.3668 and a high p-value of .7155. This high p-value indicates that the mean return for 2019 is not statistically significantly different from zero, suggesting that the impact of the 2019 election on NSE Nifty 50 returns was not substantial. Similarly, in 2024, the mean return increased to 8.27% with a standard deviation of 1.3041, but the t-statistic value of 0.4345 and p-value of .6659 imply that this mean return is also not significantly different from zero. Thus, despite the higher average returns in 2024, there is no strong statistical evidence to indicate that the 2024 election notably influenced the returns of the NSE Nifty 50. Overall, the t-statistics and p-values for both years indicate that the elections did not result in significant changes in stock market performance based on this analysis.
T- Statistics for Return.

Source. Authors calculation.
Table 4 presents the t-statistics for Cumulative Abnormal Returns (CAR) for NSE Nifty 50 in 2019 and 2024, revealing significant impacts of the Indian elections on the stock market. In 2019, the CAR mean was 1.2044 with a t-statistic of −4.2918 and a p-value of .0001, indicating a notable deviation from zero and a strong market reaction to the election. In 2024, the CAR mean increased to 1.6798, with a t-statistic of −8.0835 and a p-value of .0000, showing an even more pronounced market response. Both years exhibit statistically significant CARs, but the 2024 election had a more substantial impact on NSE Nifty 50 returns compared to 2019, highlighting a stronger market reaction to the more recent election.
T-Statistics for Two CAR.

Source. Authors calculation.
The results align with existing studies on emerging market reactions to political events. For instance, Chavali et al. (2020) found that Indian stock markets exhibit sharp pre-election volatility followed by stabilization post-results, a pattern mirrored in the 2024 data. Similarly, Khan et al. (2017) highlighted that political uncertainty in Pakistan led to significant stock market fluctuations, reinforcing the observation that emerging markets are highly sensitive to election outcomes. Our findings confirm these trends while also highlighting a growing intensity in volatility between the 2019 and 2024 elections, suggesting an increasing role of political uncertainty in investor decision-making.
E-GARCH Model Estimation
The EGARCH (Exponential Generalized Autoregressive Conditional Heteroskedasticity) model captures asymmetric volatility by modeling the logarithm of the conditional variance as follows:

In this equation,
To validate the robustness of our findings, alternative volatility models GARCH were tested. The results remained consistent, with EGARCH providing a better fit for capturing asymmetric shocks. Additionally, sensitivity tests using different event window lengths (±15 days and ±20 days) confirmed that the election-induced volatility patterns were persistent across various timeframes. This strengthens the reliability of our conclusions regarding the impact of Indian elections on NSE Nifty 50 market behavior as shown in (Table 5).
E-GARCH Model Estimation Result of 2019.
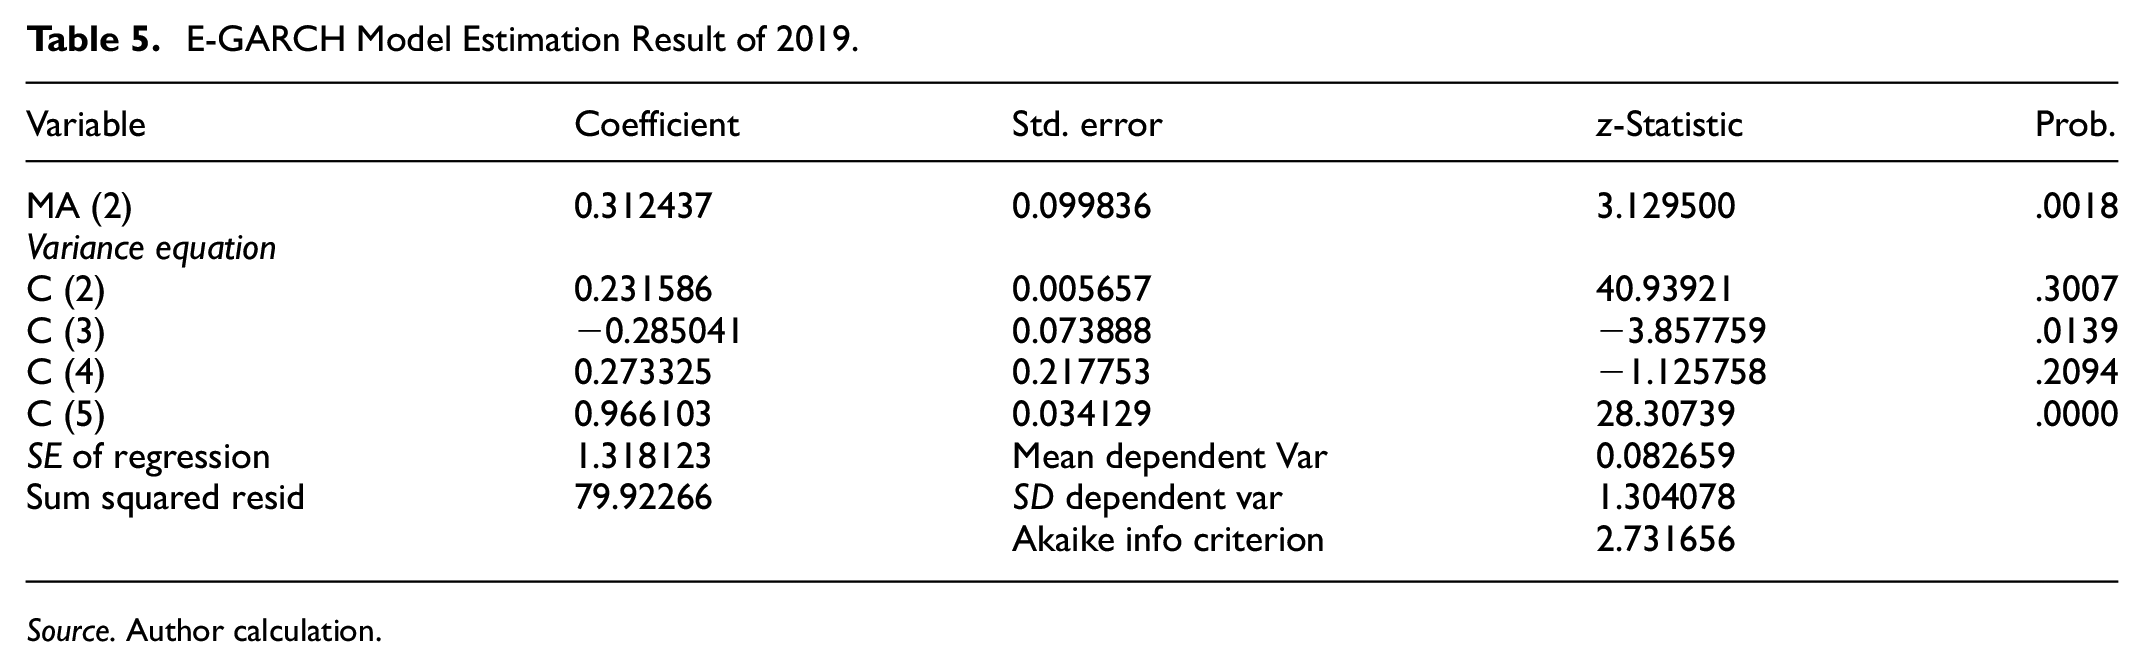
Source. Author calculation.
The Moving Average (MA (2)) term in the mean equation is significant, with a coefficient of 0.312437 and a p-value of .0018. In the variance equation, the C (3) term, which reflects the impact of shock size, is significant, with a coefficient of −0.285041 and a p-value of .0139. The C (5) term, which indicates volatility persistence, is highly significant, showing a coefficient of 0.966103 and a p-value of .0000. On the other hand, the C (4) term, representing the leverage effect, has a coefficient of 0.273325 but lacks statistically significant, as its p-value is .2094.
The p-values associated with the Q-statistics at all lags exceed the conventional significance level of .05.
This implies that there is no notable serial correlation in the residuals at any of the tested lags, indicating that the residual
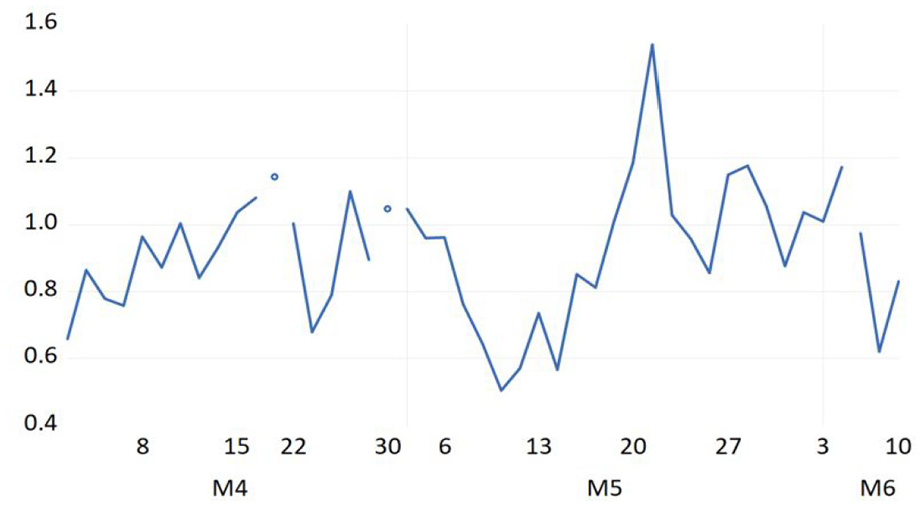
Figure 1 illustrates the E-GARCH model’s response during the 2019 Indian election, covering the period from April 1 to June 10. Initially, volatility is relatively low and stable, indicating a period of calm leading up to the election. However, as the election approaches, there is a noticeable rise in volatility around mid-April, possibly due to early campaign developments or initial market reactions.

Graphical representation of E-GARCH model estimation (2019).
During the event window, from April 11 to May 19, volatility continues to increase steadily, reflecting growing uncertainty and market reactions to the different phases of the election. A significant spike occurs towards the end of May, likely corresponding to the release of exit polls or preliminary results, which could have heightened market expectations or concerns.
After the event period, following the conclusion of the election, volatility peaks dramatically in early June, potentially driven by the final results and any ensuing political developments. However, this elevated volatility gradually declines, suggesting that the market is beginning to absorb and adjust to the new political landscape. By mid-June, volatility stabilizes, returning to pre-event levels, indicating a return to normalcy. This pattern underscores the immediate and short-term impact of the 2019 Indian election on market volatility, characterized by a pre-event buildup, event-period spikes, and a subsequent return to stability as shown in (Table 6).
E-GARCH Model Estimation Result of 2024.

Source. Author calculation.
The Moving Average (MA (2)) term in the mean equation lacks statistical significance, with a coefficient of 0.145520 and a p-value of .3725. In the variance equation, the C (3) term, which reflects the effect of shock size, is also not significant, with a coefficient of −0.171777 and a p-value of .7701. The C (5) term, associated with volatility persistence, does not show significance either, with a coefficient of 0.536656 and a p-value of .2120. Furthermore, the C (4) term, which measures the leverage effect, has a coefficient of 0.385808 but lacks statistical significance, as demonstrated by its p-value of .1072.
The p-values associated with the Q-statistics at all lags exceed the conventional significance level of .05.
This suggests that there is no notable serial correlation in the residuals at any of the tested lags, indicating that the residuals of the E-GARCH model are behaving appropriately.
Figure 2 presents the E-GARCH model’s response to the 2024 Indian election, spanning from April 1 to June 10. In the pre-event window, which lasts until April 18, volatility shows moderate fluctuations but remains generally stable, reflecting a market that is cautiously anticipating the upcoming election. However, as the election period begins, volatility starts to increase, with a significant rise observed around mid-May, potentially due to key campaign events or emerging political developments.
Graphical representation of E-GARCH model estimation (2024).
During the event window from April 19 to June 1, the volatility spikes more dramatically, particularly around May 20, likely due to critical phases of voting or influential announcements that might have swayed market sentiment. This heightened volatility indicates a period of considerable uncertainty and market adjustment as the election unfolds.
In the post-event window, after the election results are announced, volatility decreases but remains somewhat elevated, suggesting that the market is still processing the outcomes and their potential impacts. By the end of the period in early June, volatility begins to stabilize, although it does not fully return to pre-event levels, indicating that some degree of uncertainty or concern persists. This pattern highlights the substantial and potentially prolonged impact of the 2024 election on market volatility, characterized by significant event-period fluctuations and a more gradual return to stability compared to the 2019 election.
Hypothesis Testing
The results reveal a significant contrast in the effects of the Indian Prime Ministerial elections on NSE Nifty 50 stock market returns. The t-statistics for Cumulative Abnormal Returns (CAR) in both 2019 and 2024, with t-values of −4.2918 and −8.0835 respectively and p-values substantially below .05 result in the rejection of the null hypothesis. This indicates that the elections do indeed have a substantial effect on stock market returns during the election periods. Specifically, while the broader analysis might suggest limited influence, the event study approach demonstrates significant deviations in returns around the election dates, with the 2024 election having a more pronounced effect compared to 2019. Thus, the results support the alternative hypothesis, highlighting that the Indian Prime Ministerial elections significantly affect NSE Nifty 50 stock market returns during the election periods.
Graphical Representation of Abnormal Return, Cumulative Abnormal Return, and Index Return 2019
Figure 3 displays the abnormal returns for the NSE Nifty 50 index from April 1, 2019, to June 10, 2019, around the Indian general elections. The graph shows significant spikes and drops in abnormal returns, particularly around mid-May. The sharp increase in AR suggests heightened market optimism or reaction to positive election news, while the dramatic declines indicate negative reactions or uncertainty surrounding election developments. There is a noticeable spike in AR on June 4, the date when the election results were announced, followed by stabilization around zero, indicating that the market quickly absorbed the election outcomes.

Abnormal return (2019).
Figure 4 illustrates the actual returns of the NSE Nifty 50 index over the same period. Similar to AR, actual returns show notable volatility, with sharp spikes and drops. There is a significant spike in returns in mid-May, aligning with the period of the election, followed by a sharp decline. The returns also show a noticeable increase on June 4, reflecting the market’s reaction to the election results. Post-election, the returns stabilize and hover around zero, indicating that the market regained stability soon after the election results were clear on June 4.

Return (2019).
Figure 5 shows the cumulative abnormal returns for the NSE Nifty 50 index during the same period. Initially, CAR trends negatively, reflecting a series of negative abnormal returns leading up to mid-May. The sharp decline in mid-May corresponds to the period of heightened market volatility and negative reactions. After this decline, CAR begins to recover, turning positive by the event date (June 4) and continuing to rise post-election. This pattern suggests that despite initial negative market sentiment and reactions, the overall outlook improved post-election, with cumulative returns indicating a positive market correction.

Cumulative abnormal return (2019).
The graphical analysis reveals significant market volatility leading up to and during the Indian general elections. Abnormal returns (Figure 3) and actual returns (Figure 4) show substantial spikes and drops, indicating strong investor reactions to election news and events. The cumulative abnormal returns (Figure 5) initially show a negative trend, but the market begins to recover and maintain a positive outlook post-election. Notably, the spike in both AR and actual returns on June 4, when the election results were announced, indicates a significant market reaction to the clarity and outcomes of the elections. This suggests that while the elections had a noticeable immediate impact on market sentiment and volatility, the overall effect on the NSE Nifty 50 returns was temporary, with the market quickly absorbing the election outcomes on June 4 and stabilizing thereafter.
Graphical Representation of Abnormal Return, Cumulative Abnormal Return, and Index Return 2024
Figure 6 illustrates the daily returns of an index from April 1, 2024, to June 10, 2024. The graph demonstrates noticeable fluctuations, with both increases and decreases in returns. A significant spike is observed on June 4th, the date of the 2024 election results, followed by a sharp decline. This volatility suggests that the market reacted strongly to the election outcome, first with optimism or relief, leading to the spike, and then with uncertainty or reassessment, resulting in the subsequent drop.

Return.
Figure 7 displays the abnormal returns over the same period, showing how much the index’s performance deviated from what was anticipated. The graph exhibits a significant spike on June 4th, the election result day, followed by a sharp decline. This pattern indicates that the market had an unexpected reaction to the election results, leading to a substantial deviation from the expected performance. The sharp changes around this date highlight the strong influence of the election on market sentiment.

Abnormal return.
Figure 8 depicts CAR, which aggregate the AR over time to provide a sense of the overall impact of unexpected market events. Initially, the CAR trends downward, indicating a series of negative abnormal returns leading up to the election. The steep drop in CAR around June 4th reflects the market’s negative reaction following the initial post-election spike. However, the recovery in CAR shortly afterward suggests that the market began to adjust and move toward a more positive outlook as it digested the implications of the election results.

Cumulative abnormal return.
The graphical analysis indicates that the announcement of the 2024 election results on June 4th had a notable effect on the stock market. The sharp spike in returns and abnormal returns on that date suggests that the market initially reacted positively, possibly due to relief or favorable outcomes. However, the subsequent decline indicates that this optimism was quickly tempered by uncertainty or concerns over the future implications of the election results. The recovery in CAR after the initial drop suggests that the market began to stabilize as it absorbed the new information, highlighting the transient but notable impact of the election on market dynamics.
Results and Discussion
The empirical findings demonstrate notable changes in market dynamics around the 2019 and 2024 Indian elections. Descriptive statistics reveal increased volatility and more extreme returns in 2024 compared to 2019, with the mean return rising but accompanied by higher standard deviation and negative skewness. T-statistics for CAR indicate significant market reactions in both years, with stronger effects observed in 2024. This suggests heightened sensitivity to political developments, possibly due to greater uncertainty or shifting investor profiles. The EGARCH model further confirms the presence of volatility clustering and asymmetric responses, particularly around election result announcements. While the 2019 election results led to short-term volatility followed by quick market stabilization, the 2024 election exhibited prolonged volatility and slower normalization. The model parameters underline the stronger persistence of shocks in 2024, reflecting investor apprehension regarding policy direction and economic reforms.
Graphical analysis supports these findings, illustrating sharp spikes in returns and abnormal returns around key dates such as June 4, the result announcement day. The cumulative abnormal return (CAR) curves show a recovery trend post-election, indicating eventual market absorption of political outcomes. In summary, the results underscore the critical role of political events in shaping market behavior. The increasing impact of elections over time suggests that political uncertainty is becoming a more dominant force in financial decision-making. These insights are particularly relevant for investors aiming to hedge electoral risk, as well as for regulators and policymakers seeking to maintain market stability during national elections.
Conclusion
This study presents strong evidence that Indian Prime Ministerial elections have a significant impact on the NSE Nifty 50 index, particularly in terms of market returns and volatility. By employing an event study methodology and the EGARCH model, the research highlights the heightened uncertainty and risk perception associated with election periods, leading to volatility clustering and fluctuating investor sentiment. The findings indicate that volatility surges in the lead-up to elections due to speculation and uncertainty, peaks around the announcement of election results, and gradually subsides as market participants adjust to the new political landscape. A comparative analysis of the 2019 and 2024 elections reveals notable differences in market reactions. The 2024 elections exhibited greater volatility than 2019, as reflected in the higher mean return (8.27% in 2024 vs. 5.22% in 2019) and standard deviation (1.30 in 2024 vs. 0.95 in 2019). The EGARCH model estimation further supports this, showing that while volatility clustering was present in both election years, the 2024 election induced a stronger and more persistent volatility response.
The t-statistics for Cumulative Abnormal Returns (CAR) further reinforce the findings. For 2019, the CAR mean was 1.2044, with a t-statistic of −4.2918 (p-value: .0001), indicating a significant market reaction. In contrast, the 2024 election had a CAR mean of 1.6798, with a much stronger t-statistic of −8.0835 (p-value: .0000), confirming that the 2024 election had a more substantial impact on the NSE Nifty 50 returns. These results align with studies like Chavali et al. (2020), which emphasize that election-induced volatility is more pronounced in emerging markets where policy uncertainty plays a critical role.
Additionally, the descriptive statistics reveal a shift in market behavior. The higher kurtosis in 2024 (10.16) compared to 2019 (3.40) indicates a greater presence of extreme values, while the shift from positive skewness in 2019 (1.24) to negative skewness in 2024 (−1.50) suggests differing investor sentiment and reaction patterns. This aligns with studies on political uncertainty, such as Białkowski et al. (2008), which found that stock market fluctuations around elections tend to be asymmetric and driven by policy expectations.
For investors, these findings highlight the necessity of incorporating election-related volatility into portfolio risk management. Strategies such as sectoral diversification, hedging through derivatives, and event-driven investment approaches can mitigate election-related market shocks. The observed volatility patterns suggest that short-term speculative trading may increase risk exposure, making long-term strategic planning essential.
Electoral volatility extends beyond financial markets, shaping capital flows, foreign direct investment (FDI), and overall business confidence. The heightened uncertainty in 2024 highlights how prolonged political instability can hinder economic growth by triggering capital outflows and dampening investment activity. Striking a balance between political decision-making and economic stability is essential for fostering market resilience and ensuring long-term economic progress
For policymakers, the study emphasizes the importance of pre-election policy transparency. Clear communication regarding fiscal and regulatory policies can help reduce speculation-driven volatility, thereby stabilizing investor confidence. The 2024 election saw higher market fluctuations than 2019, indicating the increasing role of political uncertainty in shaping market expectations. Addressing this through structured policy announcements and forward guidance could improve market stability during electoral periods.
For financial regulators such as the Securities and Exchange Board of India (SEBI), targeted circuit breakers, enhanced disclosure requirements for election-related policy changes, and investor education initiatives could help mitigate extreme market swings. Regulatory frameworks that balance market efficiency with volatility control mechanisms would be crucial in managing election-induced uncertainties. Despite its contributions, this study has some limitations. First, it focuses exclusively on the NSE Nifty 50 index, which may not fully capture sector-specific differences. Second, it relies on historical election data, which may not reflect evolving investor behavior in future elections. Third, while the EGARCH model effectively measures volatility clustering, incorporating machine learning approaches could enhance predictive accuracy in future research. Addressing these limitations in subsequent studies can further enrich the understanding of election-induced financial market behavior.
Beyond financial markets, the study has wider economic and societal implications. Market volatility during elections can influence capital flows, business investment decisions, and overall economic stability. The pronounced volatility in 2024 suggests that political uncertainty can deter foreign direct investment (FDI) and increase capital outflows, potentially impacting economic growth. Policymakers must balance political agendas with economic stability to ensure sustained investor confidence and financial market resilience.
Additionally, the findings contribute to the broader discourse on political risk management in emerging markets. The research underscores the importance of institutional stability and policy continuity in minimizing election-induced financial shocks. Countries with well-established governance frameworks tend to experience lower election-driven market volatility, a lesson that can be applied beyond the Indian context.
In conclusion, this study reinforces the pivotal role of political events, particularly elections, in shaping financial market behavior. The 2019 and 2024 Indian elections exemplify how electoral uncertainty impacts market returns, leading to increased volatility and shifts in investor confidence. The comparative analysis of these two election cycles highlights the growing sensitivity of the Indian stock market to political developments, necessitating proactive regulatory measures and informed investment strategies. Understanding the mechanisms through which elections affect markets is essential for investors, policymakers, and regulators in mitigating the risks associated with significant political events. As India’s financial markets continue to mature, improving market resilience to electoral uncertainties will be critical for fostering long-term economic growth and stability. Future research exploring real-time investor sentiment analysis and algorithmic trading responses to elections could provide deeper insights into market behavior, enhancing both investment strategies and policy interventions.
Footnotes
Ethical Considerations
This study did not involve human participants, medical records, or identifiable personal data. Therefore, ethical approval was not required. The research was conducted using publicly available financial data from the NSE Nifty 50 index.
Consent to Participate
This study did not involve human participants, medical records, or identifiable personal data. Therefore, informed consent was not required.
Funding
The author(s) received no financial support for the research, authorship, and/or publication of this article.
Declaration of Conflicting Interests
The author(s) declared no potential conflicts of interest with respect to the research, authorship, and/or publication of this article.
Data Availability Statement
Data sharing not applicable to this article as no datasets were generated or analyzed during the current study.