
Abstract
This study clarifies the causal relationship between capital structure and performance, and examines the moderating role of firm size in this relationship. In addition, the research also investigates whether there are differences in performance and capital structure between foreign-invested firms and domestic firms. Data were collected from financial statements and other statements of 116 feed producers in Vietnam for the period from 2010 to 2022. The GMM dynamic regression method is employed to test proposed hypotheses. The results reveal that there is a causal relationship existence between capital structure and performance. In details, capital structure has a negative impact on performance, and vice versa. Size of firm contributes to making this relationship stronger. Foreign-invested firm with a lower debt ratio than local firms, but doing business more efficiency than local firms.
Introduction
Theory and practice have confirmed that determinants influencing firm performance in which capital structure is an important factor (Salim & Yadav, 2012). Firm performance is influenced by financial decisions where capital structure is one of the key decisions of financial management, it refers to the way in which a firm finances its assets and investments.
The theory of Modigliani and Miller (1958; M&M), the trade-off theory developed by Kraus and Litzenberger (1973), agency theory by Jensen and Meckling (1976) and the pecking order theory proposed by Myers and Majluf (1984) all explain that capital structure has an impact on firm value. When a firm chooses a reasonable capital structure that can reduce the average cost of capital, it will be able to choose good investment opportunities, thereby increasing the profitability of the firm and increasing the firm value.
The findings from empirical research on capital structure and performance are not diverse. Some studies found a positive relationship (Gill et al., 2011; Jensen, 1986), while other studies found a negative relationship (Boachie & Mensah, 2022; Boshnak, 2023; Hasan et al., 2014; D. Nguyen, 2020; H. T. Nguyen & Nguyen, 2020), even no relationship between capital structure and firm performance (Rajhans, 2013). The disagreement in the findings is due to institutional differences between countries (Ahrens et al., 2011), gaps in estimation methods (Bhagat & Bolton, 2009), or due to contextual characteristics, environment, industry factors.
Under the agency theory, the larger the firm size, the less information asymmetry, the more effective the manager’s decisions to use financial leverage, thereby increasing the performance. A few recent studies interested in the regulation of firm size on the impact of financial leverage on performance such as the study by Meshack et al. (2022). Santosa (2020) argues that firm size plays a role in increasing the impact of financial leverage on performance, whereas the study of Wayongah and Mule (2019) weakens the impact of financial leverage on performance. These studies look at the regulatory role of scale in a unidirectional direction of impact and the results are inconsistent. Therefore, the objective of this research, in addition to providing empirical evidence on the two-way impact relationship between capital structure and performance, also provides empirical evidence on the regulatory role of firm size on the relationship between capital structure and performance in both directions on the sample of feed processing firms in the context of Vietnam.
Thus, there is an association between capital structure and performance, but the above studies are mostly explaining the one-way relationship of capital structure to performance or performance to capital structure. Scale plays a role in regulating the impact of capital structure on the firm performance. But the above studies also look at the regulatory role of scale in the direction of impact and the results are inconsistent. So a series of questions are raised, that is, (1) Is there a reciprocal relationship between the capital structure and the performance of feed production firms in Vietnam? (2) How will the capital structure impact the performance of feed production firms in Vietnam? (3) Is the impact of performance on the capital structure the same in different capital structures? (4) How does scale play a role in regulating the relationship between capital structure and performance of feed production firms in Vietnam? (5) and is there a difference in performance and capital structure between foreign-invested firms and local firms?
The empirical findings also reveal that the disagreement in the studies on the impact dimension of capital structure and performance is due to institutional differences between countries (Ahrens et al., 2011), gaps in estimation methods (Bhagat & Bolton, 2009), or due to context characteristics, environment, industry factors. This research focuses on Vietnamese feed production firms in an important sector in Vietnam’s agricultural value chain that currently has limited similar research. According to statistics, the global feed market size reached $482.1 billion in 2021, expected to reach $599.4 billion in 2027, with a growth rate of 3.5% in the period 2022 to 2027. In Vietnam, the feed processing industry is one of the most important and potential economic sectors, which has been promulgated by the Prime Minister in Decision No. 1625/QD-TTg dated December 15, 2023 approving the Scheme on Development of the Feed Processing Industry to 2030. This decision emphasizes the goals of promoting the application of high technology and advanced technology in the processing of agricultural, industrial, food processing by-products to make animal feed in the direction of industrialization; increasing the production of industrial animal feed to 24 to 25 million tons by 2025 and 30 to 32 million tons by 2030, meeting at least 70% of the total demand for refined animal feed; and expanding a part of agricultural land to produce feed materials in the direction of industrialization to meet domestic demand and limit imports. With the important role of the feed production industry as a bridge to ensure food security, national food has prompted us to investigate the relationship between capital structure and performance in the context of feed production firms in Vietnam. With the desire that the study be a database for these firm executives to make appropriate financial decisions to increase the firm performance.
The structure of the study is presented as follows: “Core theories and literature review” section review literature and theoretical framework. Section “ Research methodology” presents the data collection and techniques employed. Results and discussion is presented in “Results and discussion” section; and some conclusions are presented in last section.
Core Theories and Literature Review
Core Theories
Most theories of capital structure are built on the foundation of Modigliani and Miller’s (1958) M&M theory, which refutes the assumption that there are no taxes, no bankruptcy costs, and that capital markets are the perfection of M&M theory. Because the reality of business activities of firms is more or less regulated by the macro environment and the influence of the micro environment, the assumptions that M&M theory makes will create space for later studies of capital structure in the volatile business environment. Theories reveal that the decision on capital structure is one of the important decisions of the manager who runs the business. This decision is not only confirmed in theory but also proven in practice, a wrong decision about the capital structure can impact the cost of capital, risk and performance of a business. While Modigliani and Miller’s (1958) theory is no longer suitable to thoroughly explain the influence of funding decisions on firm value in the context of a volatile business environment, the trade-off theory developed by Kraus and Litzenberger (1973), Jensen and Meckling’s (1976) agency theory, Myers and Majluf’s (1984) pecking order theory is much mentioned to explain the relationship between capital structure and firm value.
The trade-off theory states that firms need to consider it in order to be able to determine the optimal capital structure on the basis of the trade-off between the benefits of tax from debt and financial risk. Determining the optimal capital structure will help maximize the value of the business. This is also the limitation of this theory, it will be difficult for firms to set up a capital structure so that the firm value is the highest. Because a normal capital structure always includes loans and equity, and the market is always fluctuating, investors always demand the highest possible rate of return, so managers will find it difficult to quantify the benefits and costs from borrowing, not only that they always try to harmonize all the interests of the parties.
In contrast, the pecking order theory of Myers and Majluf (1984) explains the information disparity between external investors, who desperately need the real information about the business, who are less known, and may even be concealed by business managers as the cause of the hierarchy in the financing behavior of enterprises. Because they do not grasp the important and necessary information, investors often require a high rate of return when the firm raises capital through securities issuance, so the firm will choose internal financing first (using retained earnings), debt financing is second and only issue new common shares when there is no other option. Thus, according to the pecking order theory, the more profitable firms will use financial leverage at a lower level.
According to Jensen and Meckling (1976), the conflict of interest between shareholders and managers led to the agency theory. Due to asymmetric information issues, the separation of ownership and management rights may incur representative costs including: monitoring costs, binding costs and loss of benefits costs plus financial distress costs arising from debt risk, these costs increase beyond the benefit threshold from the tax shield, when the value of the debtor will begin to decrease gradually. Accordingly, the theory also illustrates that the firm performance is more or less affected by representative costs and financial difficulties.
In short, though the theories of capital structure are based on different assumptions, the scope of research in terms of time and circumstances is different, the common goal of the theories is to clarify the relationship between capital structure and firm value. Empirical studies over the past decades have tested the theory of capital structure in practice. There are many studies that find an inverse relationship between capital structure and performance (Boshnak, 2023; Hasan et al., 2014; H. T. Nguyen & Nguyen, 2020). This result seems to support the pecking order theory, as it argues that firms prefer internal funding to external funding. Highly profitable, efficient firms will gradually reduce the level of debt. There are also empirical studies that support the views of trade-off theory, agency theory when finding the same relationship between capital structure and firm performance such as studies conducted by Jensen (1986), Gill et al. (2011), Salim and Yadav (2012), Santosa (2020). The findings of theories and empirical investigations often explain the relationship between capital structure and firm performance as a one-way, how leverage affects firm performance, or how performance determines the choice of capital structure. The issue is that previous studies and the theory of capital structure seem to be less likely to consider the opposite causal effect. A one-way approach may have several shortcomings, so the studies that found a two-way causal relationship between capital structure and performance, such as Berger and Di Patti (2006), Margaritis and Psillaki (2007, 2010).
Literature Review
Relation Between Leverage and Firm Performance
In the study of the impact of debt on the performance of banks in the US, Berger and Di Patti (2006) suggest a new research direction to test agency theory by using performance to measure firm performance. The findings indicate that the degree of leverage in the same direction is statistically significant for performance across most data series. A decrease in the equity ratio by 1% (i.e., an increase in the debt ratio) results in a 6% increase in profit performance. Even at very high leverage levels, the symmetrical and impactful effect of debt levels on performance persists. They argue that high debt ratios can reduce costs payable to managers and promote managerial behavior in a way that benefits shareholders, thereby increasing firm value. When using return on equity (ROE) as the proxy of and using OLS regression, again the findings are consistent with agency theory. The ratio of equity divided by total assets (ECAP) decreased by 1% (i.e., the ratio of debt increased) at the sample average value, ROE increased by about 6% compared to the average ROE of 12.1%. The results from examining the reverse causality from performance to capital structure show that, for both performance measures, the ECAP/EFF is positive for all values of the EFF up to about 0.40 and then negative, that is, performance has a non-linear relationship to capital structure.
Margaritis and Psillaki (2007) use a sample of 12.240 firms in New Zealand to examine the relationship between performance and leverage in two directions of (i) the effect of leverage on performance, and (ii) the opposite causal relationship. Their findings are evidence supporting the theoretical predictions of the agency theory of Jensen and Meckling (1976). Leverage and squares both have a significant effect on performance, the coefficient of leverage bearing a positive sign and that of the negative-sign lever squares proves that there is a non-linear U-form inverse relationship between leverage and performance. Performance also has a positive impact on leverage at low and medium levels of borrowing, and when borrowing is high, performance tends to have a negative impact on leverage.
Margaritis and Psillaki (2010) collect a sample of manufacturing firms in France to test the relationship between capital structure, ownership structure and firm performance. They employ data envelope analysis (DEA) to build a measure of firm performance by distance from marginal value. The dependent variable in the model is the efficiency measured by data envelopment analysis (DEA). The independent variable representing the capital structure also only uses the total debt/total assets indicator. Through percentile regression, the results indicate that leverage has a significant, positive impact on performance. In the opposite direction, determinants influencing leverage, performance have a positive and significant impact on leverage for different capital structures and on all sample firms.
Margaritis and Psillaki (2007, 2010) investigate the relationship between the capital structure and the firm performance, although not giving a threshold ratio of debt, also proved that the direction of the impact of the performance on the leverage of the firm is non-linear, that is, the direction of the impact of the performance on the leverage will change from positive to negative when the debt is high.
Ly (2021) analyzes the determinants influencing the firm performance in Vietnam. Through the 3-stage least squares (3SLS) method, the performance model results in a non-linear (inverted U-shaped) relationship between financial leverage and performance. That is, using financial leverage will help firms increase performance, the higher the debt ratio, the more the increase in firm performance, but when the debt ratio is too high, the benefits from the tax shield will not be enough to compensate for the cost of using capital, which will cause the firm efficiency to decrease. This study is newer than the study of Margaritis and Psillaki (2007) that has found the debt ratio threshold. The debt ratio threshold at 57.28% makes the maximum performance, while the debt ratio threshold at 24.40% makes the maximum ROA, when the debt level exceeds the above threshold, the firm performance decreases. So we propose the hypothesis as:
H1: There exists a causal relationship between capital structure and performance.
H1a: Capital structure adversely affects the performance of feed production firms in Vietnam.
H1b: Performance has a negative impact on the capital structure of feed production firms in Vietnam.
Capital Structure and Firm Performance With Regulatory as a Variable
The firm size partly reflects the position of the firm in the market. In Vietnam, firms are classified into large, medium, small and micro firms, one of the criteria for classifying firms as above is based on the size of capital, revenue and number of employees. In the face of opportunities and challenges, large firms often capture and respond better than small and medium firms. With access to capital markets and loans, large firms have better and easier access than small and medium firms. For this reason, the firm size is used as a moderator of the relationship between the capital structure and the firm performance.
Wayongah and Mule (2019) investigate a regulatory impact of firm size on the relationship between financial leverage and financial performance of listed non-financial firms in the context of Kenya. The effect of leverage on financial performance as measured by ROE or as measured by Tobin’s Q is both positive. The regulatory variable (firm size × financial leverage) has a negative impact factor of 1%, which indicates that scale weakens the impact of financial leverage on financial performance.
Santosa (2020) looks into the regulatory role of firm size on the financial characteristics and value of Islamic firms in the Indonesian stock market. The findings reveal that financial leverage has a statistically significant impact on firm value, without the regulation of firm size, the impact coefficient of leverage on firm value is positive 3.2663 at a significant level of 1%, but when there is a regulation of scale, there is an increased impact of leverage on firm value. Meshack et al. (2022) also conclude a statistically significant positive impact of leverage on financial performance (measured by Tobin’s Q). In addition, firm size as measured by total revenue has a positive regulatory impact on the relationship between leverage and financial performance.
In the context of Vietnam, the study by Le and Pham (2022) on a sample of 515 listed firms in Vietnam, the results of financial leverage (FL) have a negative impact on financial performance measured by Tobin’Q. Similar to the above studies, this study also detects that financial leverage has an adverse impact on the financial performance of non-financial enterprises and this impact becomes stronger when there is regulation of firm size.
Theories and empirical studies show the different dimension of impact between capital structure and performance as well as the regulatory impact of firm size on this relationship. A common point of the studies is that they all consider the relationship between capital structure and performance in a single direction (except for the research of Berger and Di Patti [2006], Margaritis and Psillaki [2007, 2010] and the research of Ly [2021]) and accordingly the regulatory role of the scale is also in a one-way direction. In this study, we inherit the studies of Berger and Di Patti (2006), Margaritis and Psillaki (2007, 2010) and expand upon the introduction of the variable of firm size regulation in both dimensions of impact, in order to provide more empirical evidence on this causal relationship as well as the regulatory role of firm size to that causal relationship. Therefore, we design hypotheses as below:
H2a: The firm size has a positive impact on the performance of feed production firms in Vietnam
H2b: The firm scale has the same impact on the capital structure of feed production firms in Vietnam
H2c: Regulatory firm scale increases the relationship between capital structure and performance of feed production firms in Vietnam
In addition, this research also investigate whether there are differences in firm performance and capital structure between foreign-invested firms and local firms. Therefore, the hypothesis proposed for the firm type (GROUP):
Foreign-invested firms often have advantages in capital, executive management capacity, technology from which performance may be higher than that of local firms (Kumar, 2016). Foreign-invested firms are often large-scale firms with better financial autonomy, so the level of debt will be lower than that of local firms.
H3a: The type of FDI firms is more efficient than local feed production firms
H3b: The type of FDI firms has a lower debt ratio than local feed production firms
Research Methodology
This study is conducted to investigate the causal relationship between capital structure and performance of feed production firms in Vietnam. Data were collected from the firm survey report conducted by General Statistics Office of Vietnam for the period 2010 to 2022, for all firms doing business in Vietnam with many items including financial and non-financial items. Then we only chose firms working in the field of animal feeding production. In consequence, the multiyear dataset for the period from 2010 to 2022 with 116 firms produced animal feed regardless of size and form of ownership were chosen. In the time series, we have 1,508 observations including 1,066 observations from local firms, and 442 observations from FDI firms.
Research Model
To examine the causal relationship between capital structure and performance of feed production firms in Vietnam, we propose a model consisting of two equations as follows:
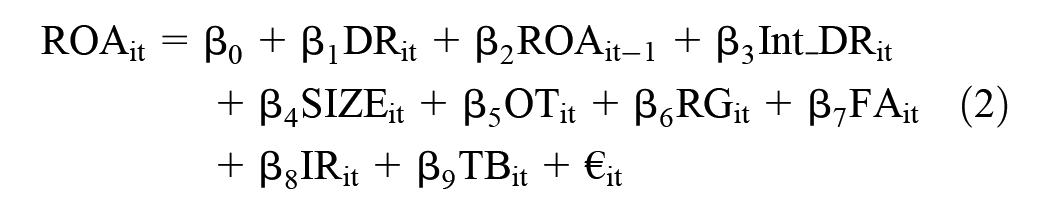
Measuring the Impact of Capital Structure on Performance
Models (1), (2), (3) and (4) are proposed to examine the impact of capital structure on the performance of feed production firms in Vietnam:

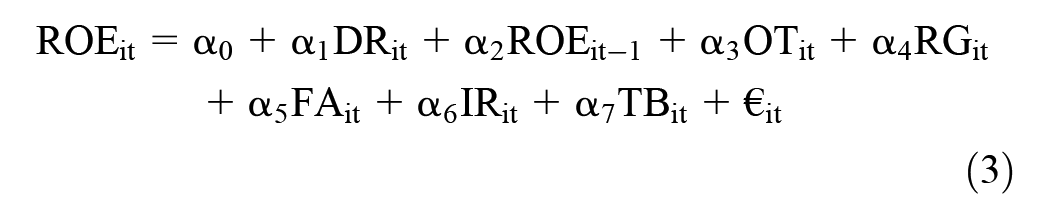

Measuring the Impact of Performance on Capital Structure
Models (5), (6), (7) and (8) are proposed to examine the impact of operational efficiency on the capital structure of feed production firms in Vietnam:


Variables Measurements
The Dependent Variable Is Also an Independent Variable
ROA, ROE, DR both act as dependent variables and act as independent variables for research models.
ROAit, ROEit reflect the performance of the feed production enterprise i in year t (in the study is from 2010 to 2022). Performance is measured through two quantitative indicators ROA and ROE, the calculated data is taken from the accounting books of these types of enterprises through the report of the General Statistics Office of Vietnam over the years.
DRit is the capital structure calculated as the average total liabilities divided by the average total assets. DRit reflects the debt ratio of the feed production enterprise i in year t (in the study is from 2010 to 2022).
Lag Variables
ROAit−1, ROEit−1 in the model are the lag variables of the performance variable, DRit−`1 in the model is the lag variable of the DR variable from the previous period to the current period of β1, α1, δ1 and µ1 of (0,1) representing the level of inertia. At that time, the performance and debt ratio will converge to the average value in the long term and β1, α1, δ1, µ1 also show the adjustment rate of performance, debt ratio in equilibrium value, if this value is close to 0, it means that the adjustment is fast. Taking the lagging value of the debt ratio variable can help control the probability of a two-way relationship between capital structure and performance (Bandyopadhyay & Barua, 2016).
Moderator Variables
Firm size is the variable used to regulate the relationship between capital structure and firm performance. The Int_DR variable in the model is the variable that regulates the relationship of the capital structure to the performance determined by DR × SIZE, the Int_ROE variable is determined by ROE × SIZE, and the Int_ROA variable is determined by ROA x SIZE in the model is the variable that modulates the relationship of performance to capital structure.
Control Variables
– OTit is an activity time variable that represents the age that the firm has up to the time of research. This variable represents the age of the feed producer i in year t (in the study from 2010 to 2022) and has the unit of year, determined by the year of the study minus the year of listing.
– RGit is a variable that shows the growth rate of the feed production firm i in year t (in the study is from 2010 to 2022). This variable is measured by the growth rate of revenue in year i compared to year i−1.
– FAit is the variable of the proportion of fixed assets determined by the average fixed assets/average total assets of the feed production firm i in the tth year (in the study is from 2010 to 2022).
- IRit is the proportion of inventory determined by the average inventory/average total assets of the feed production firm i in the year (in the study is from 2010 to 2022).
- TBit is a variant that shows the classification of feed production firms i in year t (in the study is from 2010 to 2022). The dummy variable takes a value of 0 if it is a local firm, the dummy variable takes a value of 1 if it is a foreign-invested firm. The purpose of considering whether there are differences between these two types of firms in terms of debt use as well as firm performance.
– β0, α0, δ0 and µ0 are constants; βi, αi, δi and µi (i receive values from 1 to n) are regression coefficients corresponding to independent variables, lag, modulation and control variables in the model; €it is a random error.
That scale of variables in the model is presented in Table 1.
Variable Measurement.

Source. Authors’ compilation.
Results and Discussion
Descriptive Statistical Analysis
Table 2 reveals that the average ROA is 3.85%, of which the average ROA of FDI firms is 9.8% higher than that of local firms at 1.39%. The average ROE of 7.68%, of which the average ROE of FDI firms is 19.23%, is much higher than the average ROE of local firms at 2.89%. This proves that FDI firms operate much more efficiently than local firms in the period 2010 to 2022.
Descriptive Statistics.

Source. Compilations by the authors.
The average debt ratio of is 51.82%, of which local firms have an average debt ratio of 53.43% higher than FDI firms at 47.93%. This debt ratio shows that quite a lot of feed production firms have a higher debt ratio in their capital structure, the high use of debt can significantly affect their performance when they face business risks.
Other determinants such as operating time, inventory ratio, local firms have a longer operating time than FDI firms and the inventory ratio is also higher than FDI firms. The growth rate of revenue, the average proportion of fixed assets, and the scale of FDI firms is higher than that of local firms.
Correlation Analysis
The correlation coefficient matrix reflects the correlation between the independent variables with the dependent variable and between the independent variables with each other. Table 3 illustrates that most of the coefficients of the correlations are quite low. Capital structure (DR) is negatively correlated with both ROA and ROE; Size is positively correlated with both ROA, ROE and DR; IR and FA are negatively correlated with ROA and ROE, but for DR, IR is positively correlated with the same direction and FA is negatively correlated. Besides, there are other correlations shown in Table 3. In addition, the correlation coefficient of the independent variables, the control variable with the dependent variable is <0.3, which illustrates that their correlation is average and weak.
Correlation Matrix.
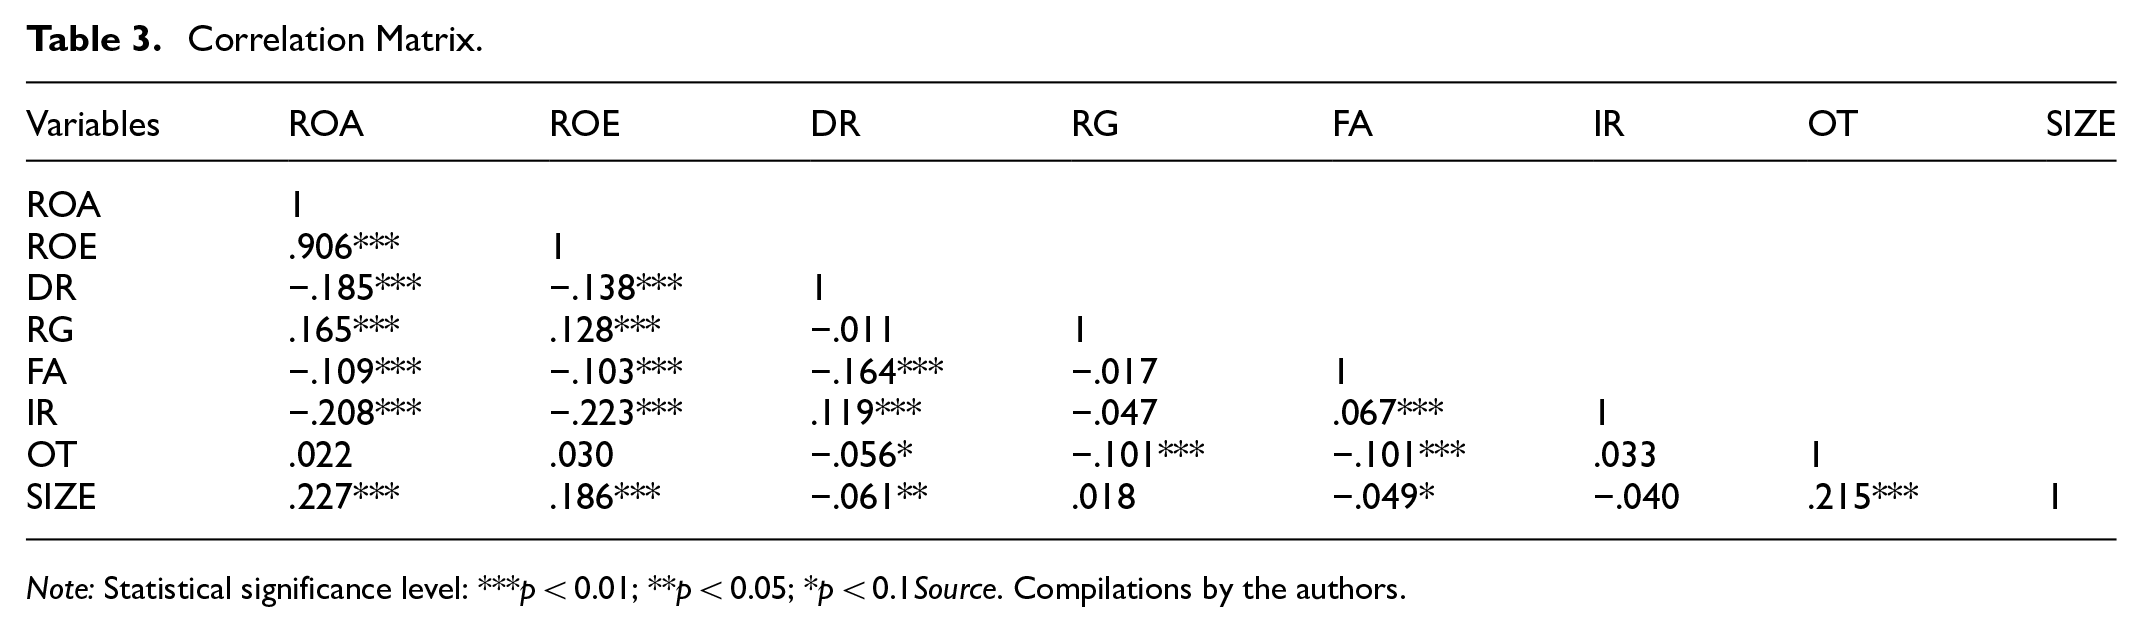
Note: Statistical significance level: ***p < 0.01; **p < 0.05; *p < 0.1 Source. Compilations by the authors.
Regression of GMM Dynamic Panel Data
Measuring the impact of capital structure on performance
In Table 4, the models (1), (2), (3) and (4) proposed above will be used to test the impact of capital structure on the performance of feed production firms in Vietnam for the multiyear dataset from 2010 to 2022.
The Impact of Capital Structure (DR) on ROA, ROE.

Source. Compilations by the authors.
Note. Statistical significance level: ***p < .01; **p < .05; *p < .1.
The AR test (1) on first-order chain correlation difference, P. value (Ar1)<0.05 proves that the difference has a first-order correlation. Arellano-Bond test of autocorrelation through AR(2). The results demonstrate that the model does not have secondary autocorrelation because the p-value of AR(2) is > .05. The p-value of the Wald test <0.05 proves the existence of the model. At the same time, the significance of the tests on the stability of the model, the validity of the instrument variables through the test Sargan and test Hansen all have a p-value > .05. This means that the model is unrestricted and that the use of instrumental variables in the model is appropriate. Thus, the above test results reveal that four models built ensure stability and good measurement.
Capital Structure (DR)
Table 4 shows that the capital structure has the opposite effect on ROA at the significance level of 1%, the opposite to ROE at the significance level of 5%. In the context of other constant factors, when the capital structure increases or decreases by 1 unit, the ROA will reduce or increase by 0.047 units, ROE will decrease or increase by 0.075 units. In particular, when there is regulatory participation of the enterprise scale, the magnitude of the impact factor of the capital structure on ROA increases from 0.047 to 0.187 units, the magnitude of the impact factor of the capital structure on ROE increases from 0.075 to 0.536 units. This means that the firm size has a regulatory role that adds to the impact of the capital structure on the firm performance.
Theoretically, the study does not follow M&M theory, the theory of trade-offs, which states that the value of the firm using financial leverage is greater than the value of the firm not using financial leverage. According to the agency theory, due to the conflict of interest between shareholders and managers, the representative cost of equity is incurred, the conflict between shareholders and creditors is incurred and the representative cost of debt is incurred. This theory asserts that managers of highly indebted firms are under pressure to generate enough cash flow to pay interest by investing in highly profitable projects. This mechanism leads to an increase in the firm value.
Instead, this result supports the hierarchical theory of order. According to this theory, firms follow a specific order to finance their projects. Internal financing means that the use of retained earnings is preferred over external financing, in external financing debt financing is preferred over issuance of common equity. A firm only issues shares when it cannot borrow more debt at a cost lower than the cost of raising equity capital.
Practically, the study’s findings are similar to the findings in the studies of Hasan et al. (2014), Vătavu (2015), D. Nguyen (2020), H. T. Nguyen and Nguyen (2020), Le and Pham (2022), Islam and Iqbal (2022), Kokeyeva et al. (2022), Boshnak (2023) and support the H1a hypothesis. When firms increase the debt ratio, the cost of debt will increase, which will have a negative impact on the income of the firm, thereby reducing profits.
Moderating of Firm Size
Data in Table 4 reveal that scale has no impact on firm performance, supporting the findings of Gill et al. (2011), Vu et al. (2020). Unlike Santosa (2020), N. M. Nguyen and Tran (2020), Islam and Iqbal (2022); Meshack et al. (2022), firm size has a significant positive impact on firm value. Research by Le and Pham (2022) suggests that scale has the opposite effect to performance. The results do not support the H2a hypothesis of the impact and show that scale does not directly affect the growth process, generating profits but has a regulatory role that adds to the impact of capital structure on performance. This is shown by the impact coefficient of the positive modifier Int_DR, and has p-value <.05.
Without considering the regulatory role of firm size, capital structure negatively impacts ROA and ROE, when other factors remain constant, if the debt ratio is reduced to 1 unit, it will increase ROA by 0.0475 units, ROE by 0.0479 units. When there is regulatory participation of the firm scale, the debt ratio will still decrease by the same amount as before, but the ROA will now increase by a larger amount than before the introduction of the regulatory variable into the model of 0.1873 units, while the ROE will now also increase by a larger amount than before the introduction of the regulatory variable into the model of 0.5360 units. This result agrees with the studies of Santosa (2020), Islam and Iqbal (2022), Meshack et al. (2022), Le and Pham (2022) and contribute to supporting the agency theory, supporting the hypothesis H4c. However, the study by Wayongah and Mule (2019) shows that contrary to the above conclusions, the regression coefficient of the interaction variable (firm size × financial leverage) is negative and statistically significant, demonstrating that the scale of regulation reduces the impact of financial leverage on ROE and Tobin’s Q.
Type of Business (TB)
The firm type has a statistically significant impact on performance in the direction that local firms have a lower rate of return on assets and a lower rate of return on equity than FDI firms. Specifically, local firms have a lower ROE than FDI firms of 6,265%; have a lower ROA than FDI firms of 3,064%. Thus, the results agree with Kumar’s (2016) study, which suggest that foreign-invested firms operate more efficiently than local firms. Charoenrat et al. (2013) also said that foreign-invested firms with large capital sources can easily upgrade technology and access to foreign markets to create a foundation to enhance efficiency. This result supports the hypothesis H3a.
Lag Variable
Performance of the previous period has an impact on current performance, it suggests that past performance helps capture the unobserved impacts of the past when considering the relationship between capital structure and firm performance. This means that the regression coefficient of the 1-year lag variable of ROA is statistically significant at 1%, these coefficients are all positive in the models.
Operation Time (OT)
Operating time has no statistical impact on performance. The results are similar to those of Vu et al. (2020), showing that the operating time does not affect the performance of firms and does not support the hypothesis.
Revenue Growth (RG)
The estimated coefficient of the growth rate is positive and statistically significant at 1% in all four models, which illustrates that firms with higher growth opportunities can improve performance. This result is consistent with the findings of Abor (2005), Zeitun and Tian (2007), Margaritis and Psillaki (2010), Salim and Yadav (2012), Islam and Iqbal (2022). Boshnak’s (2023) research also detects the growth rate has a positive impact on the firm performance in terms of ROA and ROE, with no impact on Tobin’s Q. or Gill et al. (2011) find no relationship between growth rate and firm performance.
Fixed Asset Ratio (FA)
The proportion of fixed assets has an adverse impact on performance but is not statistically significant. For the feed production industry, investing too much in fixed assets will slow down the capital recovery process, thus affecting the capital use process of the enterprise, in the short term, there may be a shortage of capital, leading to a loss of investment opportunities, affecting the performance of the enterprise. This result does not support our hypothesis.
Inventory Ratio (IR)
The proportion of counteracting inventories was statistically significant for performance measured by ROE but had no impact on ROA. Research by Le (2021) also agrees that firms have a large value of unfinished products, causing capital to be stagnant, causing financial risks, so the efficiency of capital use is low, reducing the firm performance. D. Nguyen (2020) supports the view that inventory structure adversely impacts ROA and ROE with a significant level of 1%, firms need to reduce inventory to improve firm performance. This result supports part of our hypothesis.
Measuring the Impact of Firm Performance on Capital Structure
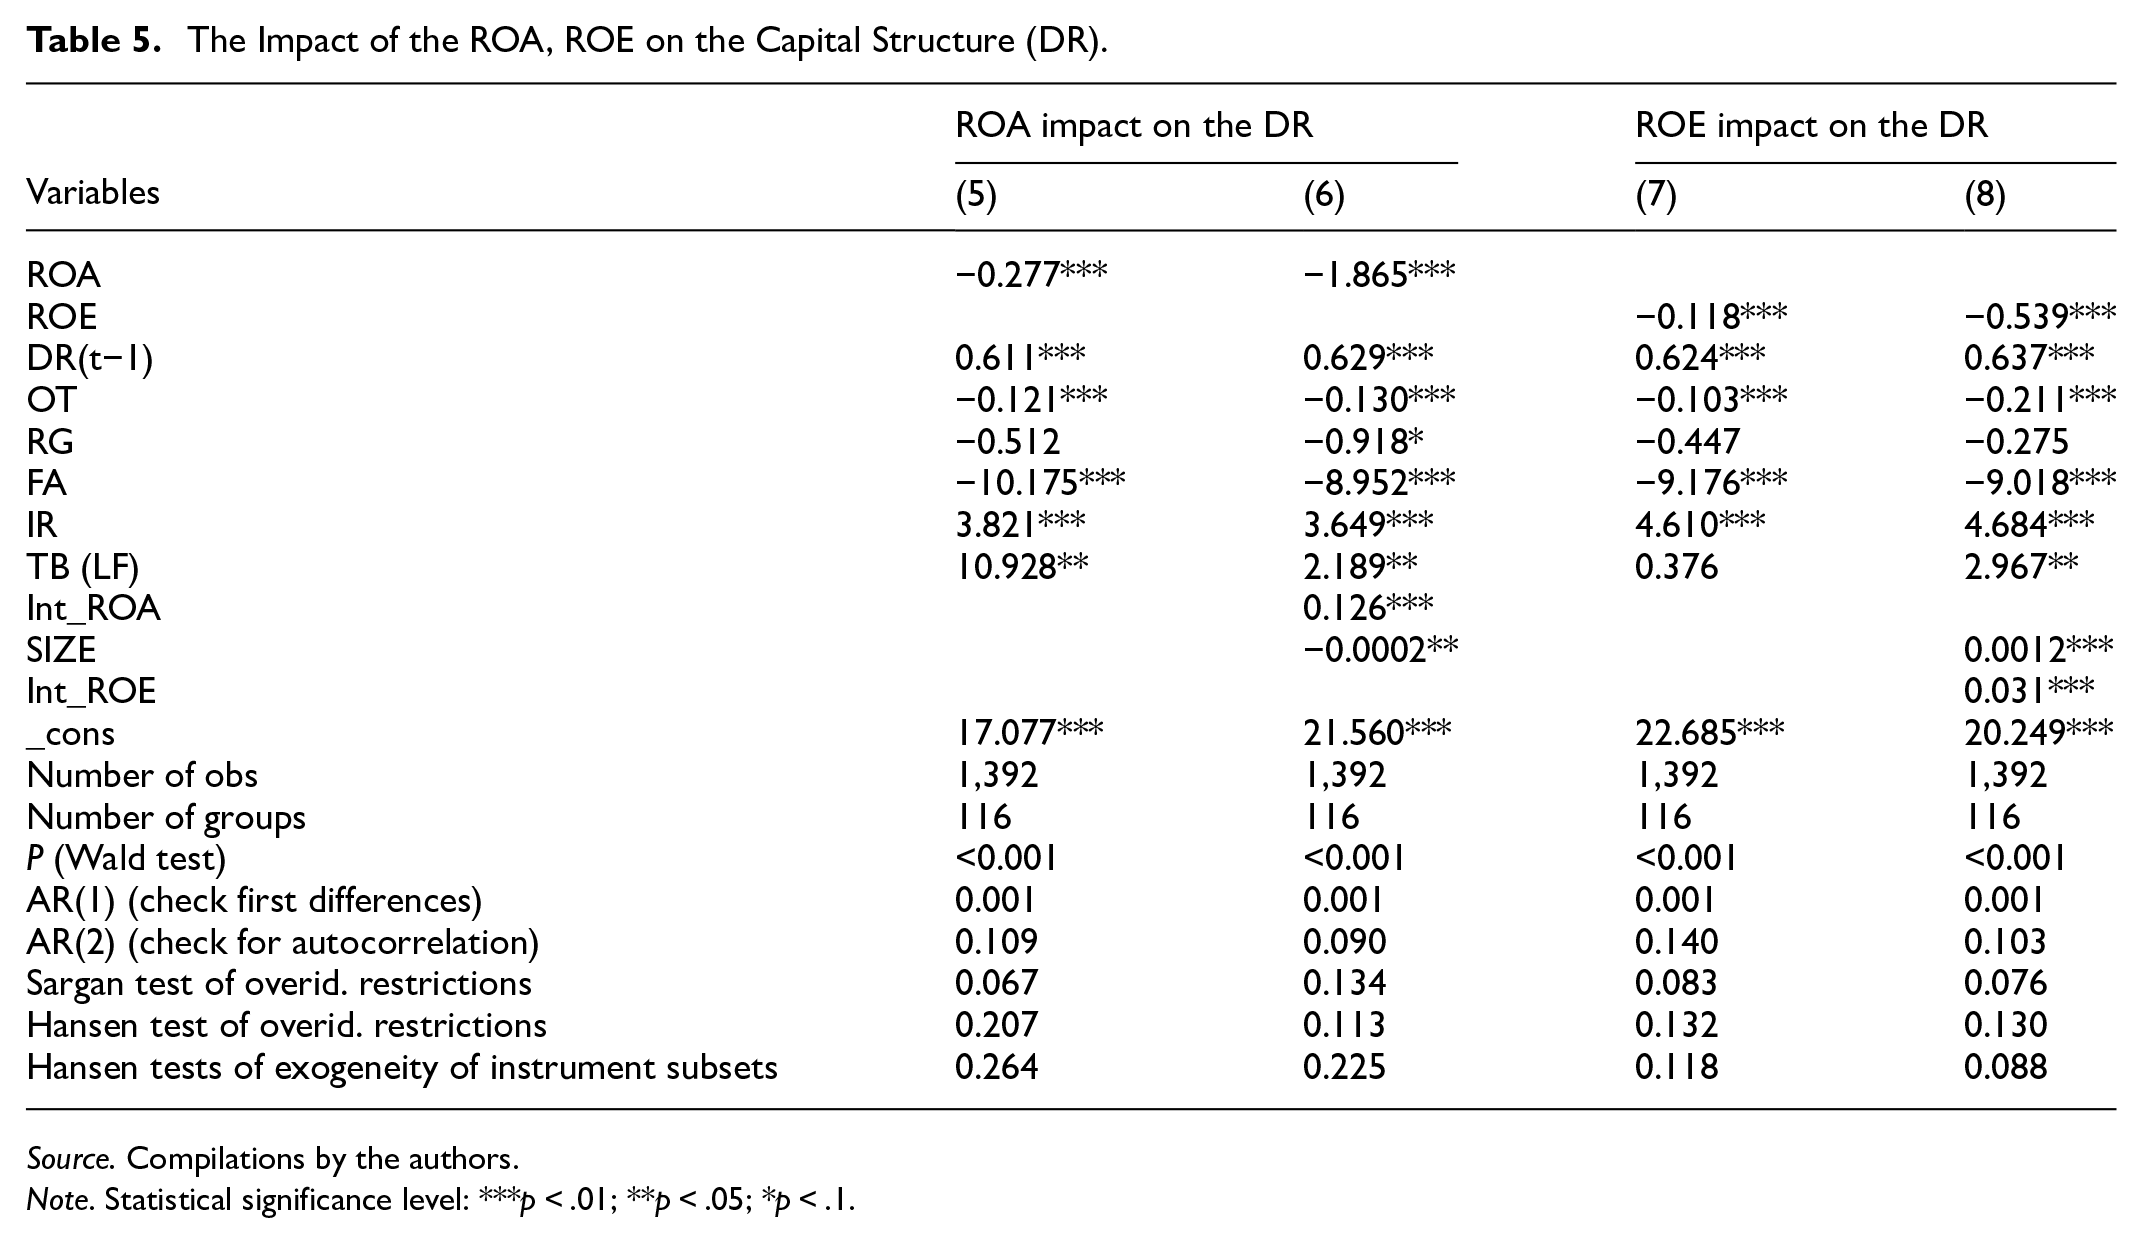
In Table 5, Models (5), (6), (7) and (8) proposed above are used to test the impact of firm performance on capital structure of feed production firms in Vietnam in the period 2010 to 2022 and at the same time test two hypotheses of the efficiency – risk hypothesis and the value – concession hypothesis of Berger and Di Patti (2006).
The Impact of the ROA, ROE on the Capital Structure (DR).
Source. Compilations by the authors.
Note. Statistical significance level: ***p < .01; **p < .05; *p < .1.
The AR test (1) on first-order chain correlation difference, P. value (Ar1) < 0.05 proves that the difference has a first-order correlation. Arellano-Bond test of autocorrelation through AR(2). The results show that the model does not have secondary autocorrelation because the p-value of AR(2) is > .05. The p-value of the Wald test <0.05 proves the existence of the model. At the same time, the significance of the tests on the stability of the model, the validity of the instrument variables through the test Sargan and test Hansen all have a p-value > .05. This means that the model is unrestricted and that the use of instrumental variables in the model is appropriate. Thus, the above test results reveal that the 4 models ensure stability and good measurement.
Firm Performance (Proxied by ROA and ROE)
In the context of other factors unchanged, firm performance adversely influences the capital structure at a significant level of 1%. When the firm performance measured by ROA and ROE increases or decreases by 1 unit, the debt ratio in the capital structure decreases or increases by 0.277 units and 0.118 units, respectively. When there is regulation of firm size, although the firm performance measured by ROA and ROE also increases or decreases by 1 unit as before, at this time the debt ratio in the capital structure will decrease or increase by a larger amount when there is no regulatory variable in the model, respectively, it will decrease or increase by 1.865 units and 0.539 units.
Theoretically, this detection is contrary to the efficiency-risk hypothesis but supports the value-franchise hypothesis of Berger and Di Patti (2006) as well as the pecking order theory of Myers and Majluf (1984). These two hypotheses provide conflicting predictions as to how performance will impact firms’ choice of capital structure. The efficiency-risk hypothesis holds that more efficient firms will choose higher leverage ratios because higher efficiency is expected to reduce the cost of bankruptcy and financial distress. However, even high-performing firms face the trade-off between the benefits of heavy borrowing and the cost of financial distress when they realize they have borrowed too much. Therefore, stating the opposite of the efficiency – risk hypothesis is the value – franchise hypothesis. The value-franchise hypothesis holds that the more efficient firms tend to choose a capital structure with lower debt ratios. Because when the business is operating effectively, profits will increase, instead of being reduced due to the use of money to pay interest, businesses will choose a capital structure tilted toward equity (using retained earnings) to reduce debt.
As a result, more profitable firms will be more likely to finance growth, scaling their firm with their retained earnings. While low-margin firms will use more debt to finance their firms and investments.
In terms of empirical research, our findings agree with the findings of N. M. Nguyen and Tran (2020), Chandra (2015), Hossain and Ali (2012), Ahmed and Bhuyan (2020) and the H1b hypothesis is accepted.
Moderating of Firm Size
Table 5 presents that the scale has a negative impact at the 5% significance level on the capital structure in the model (6) but has a similar impact at the 1% significance level on the capital structure in the model (8). The scale of adverse effects on capital structure is said to support the pecking order theory with the view that large-scale firms often use the equity structure (using retained earnings) rather than using external debt. This result is also found in the studies of Rajan and Zingales (1995), Berger and Di Patti (2006), Margaritis and Psillaki (2007).
The same scale of impact on capital structure supports the trade-off theory that large firms often use more debt due to the risk of bankruptcy as well as the low cost of borrowing of these firms thanks to the advantages of scale. This result is also similar to the views of N. M. Nguyen and Tran (2020), Chandra (2015). However, the results only partially support the H2b hypothesis.
Thus, in the model of performance affecting the capital structure, the firm size not only directly influences the capital structure, but also has a regulatory role that increases the impact of performance on the capital structure. Specifically, in the model without the regulatory participation of the firm size, ROA and ROE have the opposite impact on the capital structure, when other factors unchanged, if ROA and ROE increase or decrease by 1 unit, they will reduce or increase the debt ratio to 0.2766 units and 0.1181 units, respectively. When there is regulatory participation of the firm scale, if the ROA and ROE still increase or decrease by the same amount as before, the debt ratio will now decrease or increase by a larger amount than before the introduction of the regulatory variable into the model, the debt ratio will decrease or increase by 1.8648 units and 0.5397 units, respectively.
Type of Business (TB)
The data from Table 5 illustrate that local firms use higher financial leverage than FDI firms, this result supports the H3b hypothesis. When there is no scale adjustment, local feed production firms maintain a higher financial leverage than FDI firms of about 10.928%. When there is regulation of firm size, the level of using financial leverage of local firms decreases more than before but is still higher than that of FDI firms from 2.2% to 2.9%. FDI firms have a lower debt ratio than local firms because these firms have large equity capital, often foreign firms investing in Vietnam are firms with large scale, strong economic potential and available, so the use of their loans is lower than local firms.
Lag Variable
The debt ratio of the previous year has the same impact on the current debt, the impact coefficient is positive with a statistical significance of 1%, showing the importance of financial leverage in the previous year in determining the current capital structure of the sample firms. This result supports our hypothesis.
Operating Time (OT)
The operating time has a negative effect at the level of 1% on the capital structure. This inverse relationship predicts that feed production firms in Vietnam operate for a long time using a small part of their total capital. One reason for using less debt is that firms have existed in the market for a long time, so they have accumulated a lot of capital to run their business, so their loan rate gradually decreases. This result agrees with the findings of Ahmed and Bhuyan (2020), and Rao et al. (2019), but does not support our hypothesis.
Revenue Growth (RG)
The rate of increase precedes the adverse but negligible impact on the capital structure. Growth can put pressure on retained earnings and push firms into borrowing (Michaelas et al., 1999; N. M. Nguyen & Tran, 2020). As a result, firms with good growth potential tend to reduce financial leverage (Chandra, 2015; Myers, 1977). However, the results of this study do not show that the growth rate has an impact on the capital structure. Therefore, the results do not support our hypothesis.
Fixed Asset Ratio (FA)
The proportion of fixed assets has an inverse and statistically significant impact on the use of debt by feed production firms. Firms with a high proportion of fixed assets tend to gradually reduce the debt ratio in the capital structure. The results agree with studies of Cassar and Holmes (2003), Hossain and Ali (2012), and are consistent with the implications of pecking order theory. But the results contradict the trade-off theory and the results of Rao et al. (2019), Margaritis and Psillaki (2007). But there is also research that shows that the proportion of assets does not affect the decisions about the capital structure, such as studies of Chandra (2015), and Ahmed and Bhuyan (2020).
Inventory Ratio (IR)
The proportion of inventories that affect the capital structure in the same direction is at a statistically significant 1%. Inventory reserves have an important impact on production and business activities of feed production firms in Vietnam. The inventory process ensures uninterrupted production, especially input materials for feed production industries that are dependent on imports of up to 70%.
Therefore, stockpiling inventory can be a predictive signal that the business needs additional capital for this activity. Moreover, reasonable inventory storage will ensure stable production and business activities and good growth. This result completely supports our hypothesis.
Conclusion
Through the data collected from 116 feed production firms in the context of Vietnam in the period 2010 to 2022, the impact of capital structure on the performance as well as the reverse causal relationship is investigated. At the same time, we also consider the regulatory role of firm on this causal relationship, as well as compares the performance and capital structure of local and foreign-invested firms.
By employing the GMM method, the results reveal that the capital structure and firm performance have an interaction relationship, the capital structure has the opposite effect on firm performance, and vice versa. In addition, the firm size plays a role in regulating this relationship, the capital structure affects the firm performance and firm performance influences the capital structure more strongly when there is regulation of the firm size. The type of foreign-invested firm has a lower debt ratio than local firms but operates more effectively than local firms.
In the model of analyzing the impact of capital structure on the performance of feed production firms in Vietnam, the structure has a negative impact on performance at a statistical significance of 1%. The results of the model support our hypothesis and agree with the pecking order theory, the value – concession hypothesis and many empirical studies, but do not support the agency theory, the trade-off theory and the efficiency – risk hypothesis. Besides the impact of capital structure, other determinants such as past performance and growth rate have the same impact on firm performance. Inventory proportion has the same impact as ROE, but no impact on ROA, the results reveal that operating time and fixed asset proportion have no impact on the firm performance.
In the opposite causal model of performance impacting on capital structure, we find the opposite effect of performance on capital structure at a significant 1%. The control variables of the model such as the debt ratio in the past affect the determination of the debt ratio in the present. Operating time and the proportion of fixed assets have an adverse effect at a significant level of 1% on the capital structure. The ratio in inventories impacts the capital structure significantly in the same direction, and there does not appear to be a significant impact of the growth rate on the structure.
On the regulatory role of firm size. In the capital structure model that affects firm performance, the firm size does not directly influence performance, but has a regulatory role that increases the impact of the capital structure on performance. In the opposite causal model, performance affects the capital structure, the firm size not only directly affects the capital structure but also has a regulatory role that increases the impact of performance on the capital structure of sample firms.
In terms of firm types, foreign-invested firms operate more efficiently than local firms and FDI firms have a less debt-intensive capital structure than local firms.
From the findings, our study has made certain contributions to the methodology. We employ GMM advanced quantitative methods, provides empirical evidence of the two-way causal relationship, contributing to expanding the analytical framework by including regulatory variables. In theory, we clarify theories of capital structure in specific contexts, providing evidence in favor of pecking order theory, expanding the understanding of the role of firm size.
Footnotes
Acknowledgements
The authors would like to thank the Hanoi Metropolitan University, the National Economics University, Vietnam, the Hanoi University of Industry, Vietnam, editors, friends, and other researchers and reviewers who supported us during the study period and for supporting this publication.
Funding
The author(s) received no financial support for the research, authorship, and/or publication of this article.
Declaration of Conflicting Interests
The author(s) declared no potential conflicts of interest with respect to the research, authorship, and/or publication of this article.
Data Availability Statement
All data are collected from General Statistics Office of Vietnam. The data that support the findings of this research are available from the corresponding author upon reasonable request.