
Abstract
Agriculture dominates Sierra Leone’s economy, employing 75% of the labor force and contributing 64.5% of GDP. Despite its centrality, financial constraints persistently impede sectoral growth, necessitating evidence-based interventions. This study examines the long- and short-term impacts of financial credit on agricultural productivity in Sierra Leone (1990–2024), with implications for policy design. Using time-series data and a vector autoregression (VAR) framework, we analyze linkages between agricultural productivity and financial credit, labor, land, fertilizer use, investment, and rainfall. Co-integration tests and error correction modeling (ECM) identify equilibrium relationships and dynamic adjustments. Co-integration confirms a stable long-run equilibrium. A 1% increase in financial credit, agricultural land, and investment boosts productivity by 0.105%, 0.344%, and 0.04%, respectively. Conversely, a 1% rise in agricultural labor and rainfall reduces productivity by 0.77% and 1.59%, signaling labor saturation and climate vulnerabilities. Short-term ECM estimates reveal a 33.4% annual adjustment toward equilibrium, highlighting sluggish sectoral adaptation. Financial credit expansion, land optimization, and targeted investment are pivotal for enhancing productivity, whereas labor oversupply and erratic rainfall impede growth. Policy priorities include improving smallholder credit access, promoting sustainable land management, and upgrading climate-resilient infrastructure. These findings advance scholarly debates on agricultural finance in fragile economies and offer actionable pathways for Sierra Leone’s agricultural transformation.
Plain language summary
Can farmers in Sierra Leone produce more food and contribute to a stronger economy if they have better access to financial credit? This research explores this question by analyzing the relationship between financial credit from institutions like banks and the productivity of the agricultural sector in Sierra Leone. We use a sophisticated statistical method to understand how changes in credit availability affect agricultural output and overall economic growth.
Keywords
Introduction
The agricultural sector is vital for the economic growth of many developing nations, especially sub-Saharan Africa, where it constitutes a key source of livelihood, employment, and foreign exchange revenue. Sierra Leone exhibits a significant dependence on agriculture; however, the country has experienced a persistent food shortage since the 1980s. The global pandemic (COVID-19), the Ebola outbreak in West Africa, and the11-year civil war that ended in 2002, had a severe impact on agricultural productivity. This sector has substantial economic significance, accounting for 60.7% of the gross domestic product (GDP) of the nation. Approximately 70% of Sierra Leone’s labor force is engaged in agricultural activities, including forestry and fisheries (World Bank, 2023). The agricultural landscape in Sierra Leone is diverse, with production focused on a variety of crops such as rice, cocoa, coffee, palm oil, and livestock farming, which contribute to the country’s agricultural output (Abdela et al. 2019, 2021; Oloukoi, 2021). More than 90% of the country’s food needs are met by this sector, which makes a substantial contribution to socioeconomic stability, poverty alleviation, and food security (Duramany-Lakkoh et al., 2022).
Despite making significant strides in recent decades, the agricultural sector in Sierra Leone continues to face ongoing difficulties stemming from its transitional economic status along with environmental and socioeconomic issues. The sector is dominated by small-scale farmers, who struggle to achieve economies of scale. Growth in agriculture has been largely dependent on rain-fed, labor-intensive methods and excessive fertilizer use rather than embracing technological innovations (Alekseieva et al., 2023; Siddiqui et al., 2021). This problem is further compounded by inadequate government investment in agriculture, particularly in areas such as adopting new technologies, innovating agri-food production, and enhancing post-harvest processing techniques (Mack et al., 2023; Seidu &Tanko, 2022). Climate-related challenges, including floods, droughts, and saltwater intrusion, pose considerable risks to crop yields and overall sustainability of agriculture in Sierra Leone (Barrie et al., 2021; Osman Nabay et al., 2022). However, the fundamental issues underlying these problems include insufficient funding and restricted access to credit facilities. These factors collectively hinder the sector’s ability to modernize and boost productivity effectively. Consequently, a crucial priority for Sierra Leone’s agricultural sector is its transformation into a large-scale technologically advanced industry supported by a robust financial credit system.
The role of the financial sector in supporting agricultural production extends beyond simply providing financial resources to farmers. Financial credit has been instrumental in developing Sierra Leone’s agricultural sector since the country gained independence in 1961, thus playing a critical role in its progress (Ezekiel & Lakkoh, 2021). In recent years, the government of Sierra Leone has implemented substantial initiatives to enhance agricultural financing by focusing on improving smallholder farmers’ access to credit and financial services (Chigunhah & Svotwa, 2020; Naeruz et al., 2022). Access to financial credit enables farmers to expand their operations, adopt new technologies, and enhance their productivity (Alekseieva et al., 2023; Siddiqui et al., 2021). The influence of financial credit on agricultural productivity growth is a complex issue that requires a comprehensive understanding of the various factors (Gizaw et al., 2023; Mack et al., 2023). Many studies have shown the importance of financial credit in economic growth and productivity. They stress the importance of access to credit to maintain sustainable agricultural practices and drive economic growth. Research conducted by Kamara and Bangura (2018) and Kargbo and Kamara et al., (2020) underscores the essential function of financial credit in enhancing agricultural productivity and fostering economic development in Sierra Leone. These studies assert that financial credit is a pivotal factor in the advancement and modernization of the agricultural sector and rural communities in Sierra Leone. In recent years, the Sierra Leone government has enacted multiple decrees regarding credit laws for agricultural and rural development, acknowledging the potential role of credit in national agricultural advancement to enhance credit inflows into this sector. The decrees have been consistently altered and amended to align with the current credit needs of the agricultural sector. The preceding explanation of credit requirements indicates that Sierra Leone requires a robust and well-established financial system to enhance its agricultural sector, thereby facilitating its economic development.
Various aspects of agricultural productivity in Sierra Leone have been investigated extensively in numerous studies (Bangura et al., 2021; Jain et al., 2023; Kamara & Bangura, 2018; Mansaray & Jin, 2020; Midya et al., 2021; Saravia-Matus et al., 2021; Sesay & Kamara, 2019). However, most of these studies were limited to a single region and set of production characteristics at a single point in time, and did not consider the impact of financial credit on agricultural productivity over time. Although the significance of credit in agricultural development has been recognized in previous literature and has garnered substantial attention from the Sierra Leone government, no empirical study has examined the relationship between credit and agricultural productivity at the macro-level in Sierra Leone. Although previous research has explored the impact of financial credit on agricultural productivity, a notable deficiency persists in comprehending the relationship between credit and its direct influence on agricultural production. The question of whether credit genuinely aids in the advancement of Sierra Leone’s agricultural sector remains contentious. To fill this research gap, this study considers the trade-offs between economic growth and agricultural productivity in Sierra Leone while investigating the crucial topic of whether financial credit from financial institutions affects agricultural production. This study examines the relationship between credit and agricultural productivity at the macro-level in Sierra Leone.
The empirical results of this study have theoretical and practical implications. This study represents the first application of the Structural Vector Autoregression (SVAR) methodology to evaluate the short- and long-term effects of financial credit on agricultural productivity in Sierra Leone. Additionally, the Granger causality test developed by Toda and Yamamoto (1995) was employed to assess the robustness of the SVAR model and elucidate the causal relationships between credit and agricultural productivity in Sierra Leone. The empirical findings of this study yield significant policy implications and recommendations for governmental action to enhance the efficacy of financial loans and to promote growth in the agricultural sector. The remainder of this paper is arranged as follows. Section 2 provides a thorough analysis of current research on the relationship that exists between financial lending and agricultural productivity. The methodology and data employed in this study are detailed in Section 3. Section 4 presents empirical data and analysis, followed by the main findings, conclusions, and the implications for policy intervention.
Literature Review
Financial Credit and Agricultural Productivity Relationship
The relationship between financial credit and agricultural productivity at the macro level has been the subject of numerous studies because of the significant contribution of agricultural production to the national economy, and the importance of credit for agricultural growth in developing nations. Carter’s (1989) work, which simulated the effect of credit on small farm productivity in Nicaragua, serves as the theoretical foundation for a substantial body of current empirical research. Carter delineated three mechanisms by which access to credit could positively influence smallholder farmers’ production functions. First, access to financing could present an allocatively efficient opportunity to invest in agricultural inputs to optimize output. Second, finance availability influences farm output by enabling the acquisition of expensive machinery, tools, and valuable agricultural inputs, which enhances farmers’ technical efficiency. Third, access to finance provides the opportunity to increase the utilization of fixed inputs and make investments in labor and technical skills, which augments production through improved technical and allocative efficiency. Jimi et al., (2020) identified binding credit constraints as a mechanism linking credit to productivity, positing that an agent lacking credit is anticipated to invest less, resulting in diminished production. Alemu (2022) developed a Cobb–Douglas production function incorporating labor, agricultural inputs, and land as determinants of agricultural output, subsequently augmenting it to encompass human capital. This model consistently demonstrated low production regarding the agricultural yield gap, with Alemu identifying financial limitations as an impediment to enhancing productivity.
Smith and Jones (2021) provided empirical evidence of moral hazard among farmers in their study on credit utilization. Their analysis examined the change in farmers’ risk-taking behavior when protected from crop losses, and revealed moral hazard issues within lending markets. This study employed the Cobb–Douglas Production Function, estimated by OLS, to investigate the relationship between institutional credit and agricultural GDP in Pakistan from 1971 to 2002. They conclude that institutional lending has a significant positive effect on agricultural production. Chisasa and Makina (2015) obtained similar results using the same methodology. However, Hussain et al., (2012) study contradicts these findings, indicating that credit distribution has a minimal impact on agricultural production. Hussain et al., (2012) posits that this lack of significance may reflect inefficient credit utilization within the agricultural sector. Chi et al., (2020) investigated the long-term causal relationship between financial sector development and agricultural productivity in the CEMAC region from 1990 to 2018. Through the application of vector error-correction models and autoregressive distributed lag analysis, they established a strong correlation between agricultural output and financial sector development. This study emphasizes a bidirectional causal relationship between credit from lending institutions and agricultural productivity, suggesting mutual benefits. By contrast, Zafeiriou et al., (2023) examined the influence of financial sector development on agricultural production in South Asia from 1973 to 2015, revealing a curvilinear relationship. Agricultural productivity initially increased with financial development but subsequently declined as financial development progressed. Chi and Kesuh (2020) examined the long-term causal relationship between Nigeria’s banking sector development and the real estate market from 1990 to 2018, identifying a correlation; however, it remains unclear whether one influenced the other or if there was a bidirectional effect.
Agbeno (2021) says that investment is the main thing that drives economic growth in both neoclassical and endogenous growth models. This has led to a lot of empirical research being done on the subject. The research that Abdela and Teferi (2021) did on Nigeria used the impulse response function (IRF) and forecast error variance decomposition in the structural vector autoregression (SVAR) framework. Their findings reveal that fluctuations in portfolio investment and foreign direct investment (FDI) inflows exert a substantial and positive influence on Nigeria’s economic growth. FDI ranked second to portfolio investments in its impact on Nigeria’s economic growth, while personal remittances had the least effect on growth variation. Chigunhah et al., (2020) examined an array of factors that influence economic growth, including government consumption, real per capita GDP, initial education levels, life expectancy, fertility rate, inflation, and terms of trade. Contemporary research has explored the nexus between credit and agricultural productivity over short- and long-term horizons. Ahmad (2011) found that from 1974 to 2008, credit, agricultural output, labor, cropped area, and water were all linked in Ghana using the ARDL bounds test method. In the same way, Ahmad et al., (2018) and Chisasa and Makina (2015) used the ARDL and Johansen cointegration methods to find a relationship between credit and agricultural production. Conversely, Waje (2020) applied the Johansen cointegration method to Nigeria’s data from 1981 to 2011 and found no cointegration relationship between credit and agricultural output. Mack et al. (2023) say that this lack of association is because few farmers can get credit, the amounts they can borrow aren’t enough, and funds are being misused for things other than farming.
According As Duramany-Lakkoh et al. (2022) say, the ARDL bounds test method shows a strong positive link between agricultural loans and performance in Pakistan from 1983 to 2016 over both the short and long term. According to additional research, credit has a long-term substantial positive impact on agricultural productivity (Ayele & Tamirat, 2020; Barrie et al., 2021; Chisasa & Makina, 2015). Using an error correction model, Toaha and Mondal (2023) come to the conclusion that bank lending has no immediate impact on Nigerian agricultural performance. Previous agricultural credit significantly and adversely affects short-term agricultural output, as evidenced by Chisasa and Makina (2015). Chisasa and Makina (2015) attributed the uncertainty in agricultural output to factors such as price volatility, climate change, high borrowing rates, and misaligned production and repayment cycles. Doe and Smith (2019) in sub-Saharan Africa, Florence and Nathan (2020) in Uganda, and Orji et al. (2020) in Nigeria indicate that credit exerts a minimal short-term impact on agricultural output. The literature has analyzed the correlation between agricultural credit and performance outcomes. Kamara et al. (2020) use the Granger causality test to show that there was a two-way link between financial development (shown by real credit given to farmers) and agricultural growth in Pakistan from 1971 to 2011. Jimi et al., (2020) identified a bidirectional causal relationship between agricultural growth and financial development in Iran from 1970 to 2011. Chisasa and Makina (2015) demonstrated a unidirectional causal relationship between bank loans and agricultural production in South Africa from 1970 to 2011.
Mack et al. (2022) contended that empirical models should include additional variables that affect agricultural performance, such as labor, rainfall, and public investment, in addition to agricultural finance. Public investment in agriculture is essential for supporting agricultural growth (Oloukoi, 2021). Formal credit provision for agriculture is unlikely to substantially improve agricultural growth without concurrent public investment in irrigation, extension, and research (Barrie et al. 2021; Das & Patnaik, 2020). Sekyi et al. (2019) use the total factor productivity decomposition method to show that between 1970 and 2005, public spending on rural roads, irrigation, and agricultural research in Punjab, Pakistan, greatly increased the productivity of agriculture. Agricultural labor is a vital component of agricultural output (Rufai et al., 2018). The availability of agricultural labor affects the performance of the agricultural sector by affecting planting schedules, crop management practices, and harvest processing (Anwar et al. 2020; Taremwa et al. 2021). Using the ordinary least squares (OLS) approach, Nordjo and Adjasi (2019) showed that between 1960 and 2010, agricultural labor significantly and favorably impacted Nigeria’s agricultural output. From 1971 to 2011, Shahbaz et al. (2013) used the ARDL technique to show that agricultural performance in Pakistan was positively correlated with the agricultural labor force. Prior research has analyzed weather-related or climate change indicators, such as rainfall, in conjunction with agricultural labor and investment to assess the agricultural sector’s performance. Different countries face the unique effects of climate conditions on their agricultural sectors. Matusse (2020) identified that the agricultural sectors in developing countries situated in tropical and subtropical areas exhibit greater vulnerability to climate change than those in temperate regions. According to Chisasa and Makina (2015), rainfall is detrimental and has a considerable impact on agricultural performance. A 1% increase in rainfall volume led to a 0.3% decrease in agricultural GDP in South Africa.
Financial Credit and Agricultural Productivity Nuxes in Sierra Leone
Most existing research has concentrated on the micro-level impact of credit on Sierra Leone’s agricultural productivity. Utilizing endogenous switching regression models (Anh et al. 2020), Saravia-Matus et al., (2021) illustrated the considerable effect of credit on rural household production in two areas of Sierra Leone. Salami et al., (2023) reported analogous outcomes by employing quantile regression to show that both formal and informal credit significantly and positively affect rice yields for households in southern Sierra Leone. However, as highlighted by Ezekiel and Lakkoh (2021), Bangura et al., (2021), and Osman Nabay et al., (2022), drawing comprehensive inferences about the relationship between credit and agricultural productivity solely from micro-level investigations is not feasible. There is a notable absence of research in the current literature exploring the long- and short-term effects of credit on agricultural productivity with respect to the macro-level association between credit and agricultural performance in Sierra Leone. This study addresses the gap in the existing body of knowledge by offering a nationwide assessment of the relationship between loans and agricultural productivity growth in Sierra Leone.
Materials and Method
The conceptual framework demonstrating financial credit and additional elements (labor, agricultural investment, and weather-related factors) that could impact agricultural output in Sierra Leone is shown in Figure 1.

Financial credit and other factors influencing agricultural productivity.
Building upon the research of Kamara and Bangura (2018), Alekseieva et al. (2023), and Chisasa and Makina (2015), the simplified empirical model is presented as

Where: APG is the Agricultural productivity is the ratio of agricultural output to input, measured by crop yield, FCSA is the financial credit to the agricultural sector by financial institution, AGLANCP represent agricultural land under crop production, AGINV represent Agricultural Investment, FCOM is the Fertilizer consumption, AGLAB is the Agricultural labor force per cultivated Ha; RAIN is Rainfall is reported in millimeters (mm).
The bounds test in SVAR method is a robust econometric approach employed to analyze the dynamic relationships between credit and agricultural performance in Sierra Leone. This technique is particularly valuable for investigating both short-term fluctuations and long-term trends in the response of the agricultural sector to credit availability. The applicability of the method to small sample sizes renders it especially suitable for studies in developing economies, where extensive time-series data may be limited. A key strength of the SVAR bounds test is its flexibility in accommodating variables with different integration orders. This characteristic allows researchers to incorporate a mix of stationary (I(0)) and first-difference stationary (I(1)) variables into the same model, facilitating a more comprehensive analysis of the economic relationships at play. Furthermore, the simultaneous examination of short-run dynamics and long-run equilibrium relationships offers a nuanced understanding of how credit affects agricultural performance over various time horizons (Mertens & Olea, 2018; Mumtaz & Theodoridis, 2020).
Perron’s (1989) assertion highlights the critical importance of addressing structural breaks in time-series analysis. Ignoring these breaks can lead to biased results, particularly in unit root tests, in which the ability to reject a false null hypothesis is compromised. This bias can have far-reaching consequences, as it may result in incomplete model specifications and subsequently affect the accuracy of the estimations and inferences drawn from the data (Afolabi et al., 2021; Sun et al., 2017). To address these concerns, this study employed impulse response techniques. The method offers several advantages for endogenously detecting structural breaks within time-series data. First, it demonstrates a high capacity to identify breaks in both the variance and mean of the data (Albar & Ratnasari, 2022; Santos, 2008). This comprehensive approach ensures that various types of structural changes can be captured effectively. Second, the IS method is particularly suitable for small sample sizes as it does not require a trimming percentage. This feature is particularly beneficial for the current study, which utilized a dataset of 32 annual observations. This approach allows for a more nuanced understanding of the data’s underlying structure and potential points of change, ultimately leading to more accurate and reliable econometric analysis. The models using impulse techniques are given as follow (respectively):

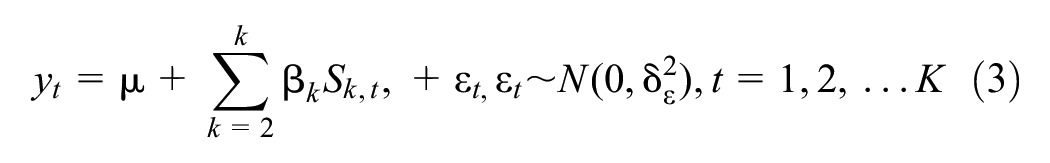
The equation includes y_t which represents the analyzed time series. The constant term μ accounts for the fixed effects or baseline level. The model incorporates impulse (Ik_t) and step dummies (Sk_t). Impulse dummies capture sudden, temporary changes at specific time points, while step dummies represent more permanent shifts persisting from a certain point onward. The unknown parameters δ_k and βk were associated with these dummy variables to estimate the magnitude and direction of their effects on the time series. εt represents the error term, which accounts for unexplained variations or random fluctuations that are not captured by the other components of the model. The technique detects breaks in the y_t variable by using indicators or dummies. The maximum number of indicators could be K, but incorporating all was impractical (Raggad, 2018). These techniques use a split-half method to divide the dummies into two blocks (Marczak & Proietti, 2016). The process begins with the first half of the impulse/step dummies in the model. After regression analysis, statistically significant dummies at a predetermined α level are retained. The second stage replaces the first block with the second half, and repeats the selection process. The final stage involved the evaluation of the indicators. Insignificant indicators from both blocks are eliminated, while significant ones are incorporated into the terminal model (Marczak & Proietti, 2016; Raggad, 2018). This model undergoes recursive re-estimation to refine the selection of significant indicators representing breaks (Mariscal & Powell, 2014). This approach ensures that only the most relevant indicators detect breaks in the yt variable, enhancing the model’s accuracy in capturing structural changes.
This study employed a comprehensive approach to analyze time-series data using a combination of conventional and advanced statistical techniques. Initially, Phillips–Perron (PP) and Augmented Dickey–Fuller (ADF) tests were applied to assess the stationarity of the variables. These tests are complemented by stability analysis, Granger causality tests, variance decomposition, and Vector Error Correction Model (VECM) estimation to provide a thorough understanding of the relationships and dynamics within the data. To address the potential limitations of conventional unit root tests, particularly in the presence of structural breaks, this study incorporates the Kapetanios (KP) test. This advanced technique allows the detection of multiple structural breaks within a univariate time series, with the breaks being endogenously determined. The KP test’s flexibility in accommodating more than two breaks and its ability to handle an unspecified number of breakpoints (up to a maximum of M) make it particularly valuable for analyzing complex time-series data:

The equation uses yt for the tested time series, K the lag length, and m the number of breaks. The first difference operator (Δ) captures the changes over time. Parameters (α, β, θ, λ, δ, and γ) are estimated in the analysis. εt represents white noise, which is a random process with constant mean and variance. The model incorporates breakpoint indicators (TB,i+1) and dummy variables for intercept breaks (DUi,t), and trend breaks (DTi,t). These dummy variables are defined based on whether time t exceeds the breakpoint TB,i. The trend-break dummy variable (DTi,t) considers the difference between the current time and the breakpoint. The Kapetanios-Perron (KP) test, as applied in this study, represents the general approach to unit root testing that accounts for potential structural breaks in both the intercept and trend of a time series. This methodology is particularly valuable in economic and financial analyses, where structural changes are common and can significantly impact the stationarity of the data. The implementation of the grid search procedure following Bai and Perron’s (1998) approach is crucial for accurately identifying the locations of structural breaks. This method systematically evaluates potential breakpoints across a time series, ensuring a comprehensive examination of the data. The test’s null hypothesis of a unit root (γ = 1) against the alternative of stationarity (γ < 1) was evaluated using the t-statistic of the estimated γ coefficient. The selection of the appropriate number of structural breaks is determined by the criterion of minimizing the t-statistic (τmin), which becomes the final test statistic.
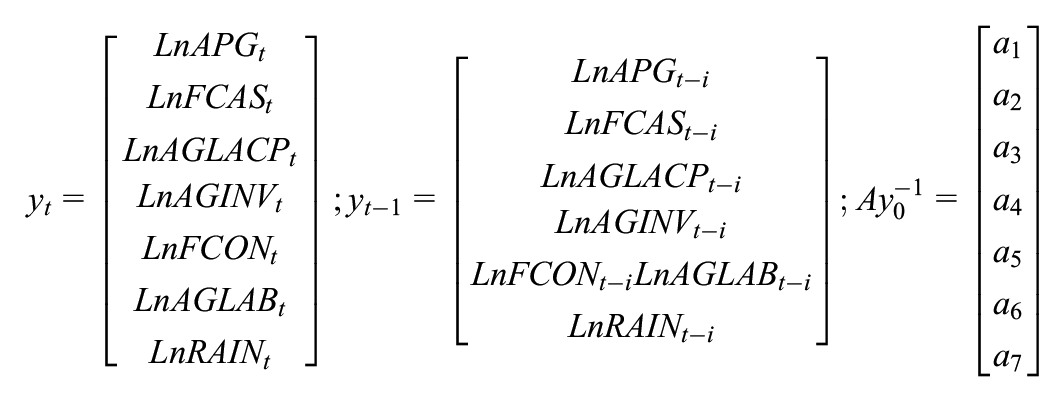
The Structural Vector Autoregression (SVAR) model analyzes Agricultural Production Growth (APG) as the primary response variable. Dummy variables (STRUCDUM) representing structural breaks were incorporated to account for significant shifts in APG over time, allowing for a more accurate representation of the data. This study uses the natural logarithm form for all variables to stabilize the variance and linearize the relationships. This study extends the analysis by implementing an ARLD-Error Correction Model (ARLD-ECM) to investigate potential long-term relationships between APG, Financial Credit to Agricultural Sector (FCAS), and other relevant variables. This approach examines both short-term dynamics and long-term equilibrium relationships among variables, providing a comprehensive understanding of the factors influencing agricultural production growth over time is given as:

In this context, Ln signifies the natural logarithm; δ represents the drift component; θi (where i = 1,…,11) symbolizes the calculated coefficients; and p, q, r, s, and w indicate the best lag values. m denotes the number of AGDP breaks, whereas STRUCDUMh (where h = 1,…,m) signifies the structural breaks of AGDP, assigning a value of 1 for time indices t ≥ Th and 0 for t < Th, with Th being the h-th breakpoint. A combined F-statistic was utilized to evaluate the null hypothesis of the absence of cointegration among variables. The null hypothesis was articulated as H0: δi = 0 for all i = 1, 2,…, 5. Given the limited sample size, a comparison was made between the computed F-statistic and the two sets of crucial values provided by Narayan (2005) Should the F-statistic surpass the upper-bound critical (UCB) value, the null hypothesis is dismissed, signifying the attainment of steady-state equilibrium among the variables. The null hypothesis remains unrefuted if the calculated F-statistic is less than the lower critical value. The assessment of cointegration is indeterminate when the calculated F-statistic falls between the crucial values of the upper and lower limits (Badeeb & Lean, 2017). The Toda–Yamamoto (1995) Granger causality test was employed to examine causal directions. A t-test was utilized for two main objectives. The T-Y test is relevant for a collection of variables with mixed integration orders and is appropriate irrespective of the variables’ cointegration status (Salahuddin & Gow, 2019). The T-Y test serves as a dependable validation tool for the results of the SVAR-bound test. The null hypothesis of no cointegration in the SVAR limits test is rejected, indicating the presence of Granger causation in at least one direction (Fan et al., 2019). An augmented VAR model was utilized in the t-test to evaluate the direction of causation among the variables in the model. The VAR is defined as:

where dmax denotes the maximum order of integration and h denotes the ideal lag values;

Using Toda and Yamamoto’s (1995) modified Wald (MWALD) test, Granger causality between the variables was investigated. H0, for instance, is equivalent to L3i 5 0, ∀ i 5 1, 2,…, h, which is the null hypothesis that LnFCAS does not Granger-cause LnAPGs. MWALD test statistics have a high degree of freedom and an asymptotical chi-square (χ2) distribution (Hryshchuk, 2021; Rana & Sharma, 2019). In the context of bank lending and agricultural output, Engle and Granger’s (1987) two-step methodology was applied, utilizing equations 1.5 and 1.6. This method facilitates a more comprehensive analysis of the relationships between these factors and elucidates the mechanisms by which financial lending influences agricultural productivity.


H1: NJ = 0, j = 1, 2, 3……….N, which posits that financial credit does not Granger-cause agricultural output (APG), is the null hypothesis to be tested.
H2: αj = 0 for j = 1, 2, 3,…, N indicates that APG does not Granger-cause bank credit.
APG is Granger caused by financial credit if the first hypothesis is rejected. Rejection of the second hypothesis implies a causal relationship between financial credit and APG. If neither hypothesis is rejected, it indicates that financial credit does not Granger-cause APG and APG does not Granger-cause financial credit, suggesting independence between the two variables. The rejection of both hypotheses suggests bidirectional causality between financial credit and APG. Pairwise Granger causality tests were conducted on the factors influencing APG.
Data Source and Descriptions
The study utilized data from the World Bank database to investigate the relationship between agricultural productivity and financial credit over a 34-year period spanning 1990 to 2024 (Table 1).
Variables and Descriptions.
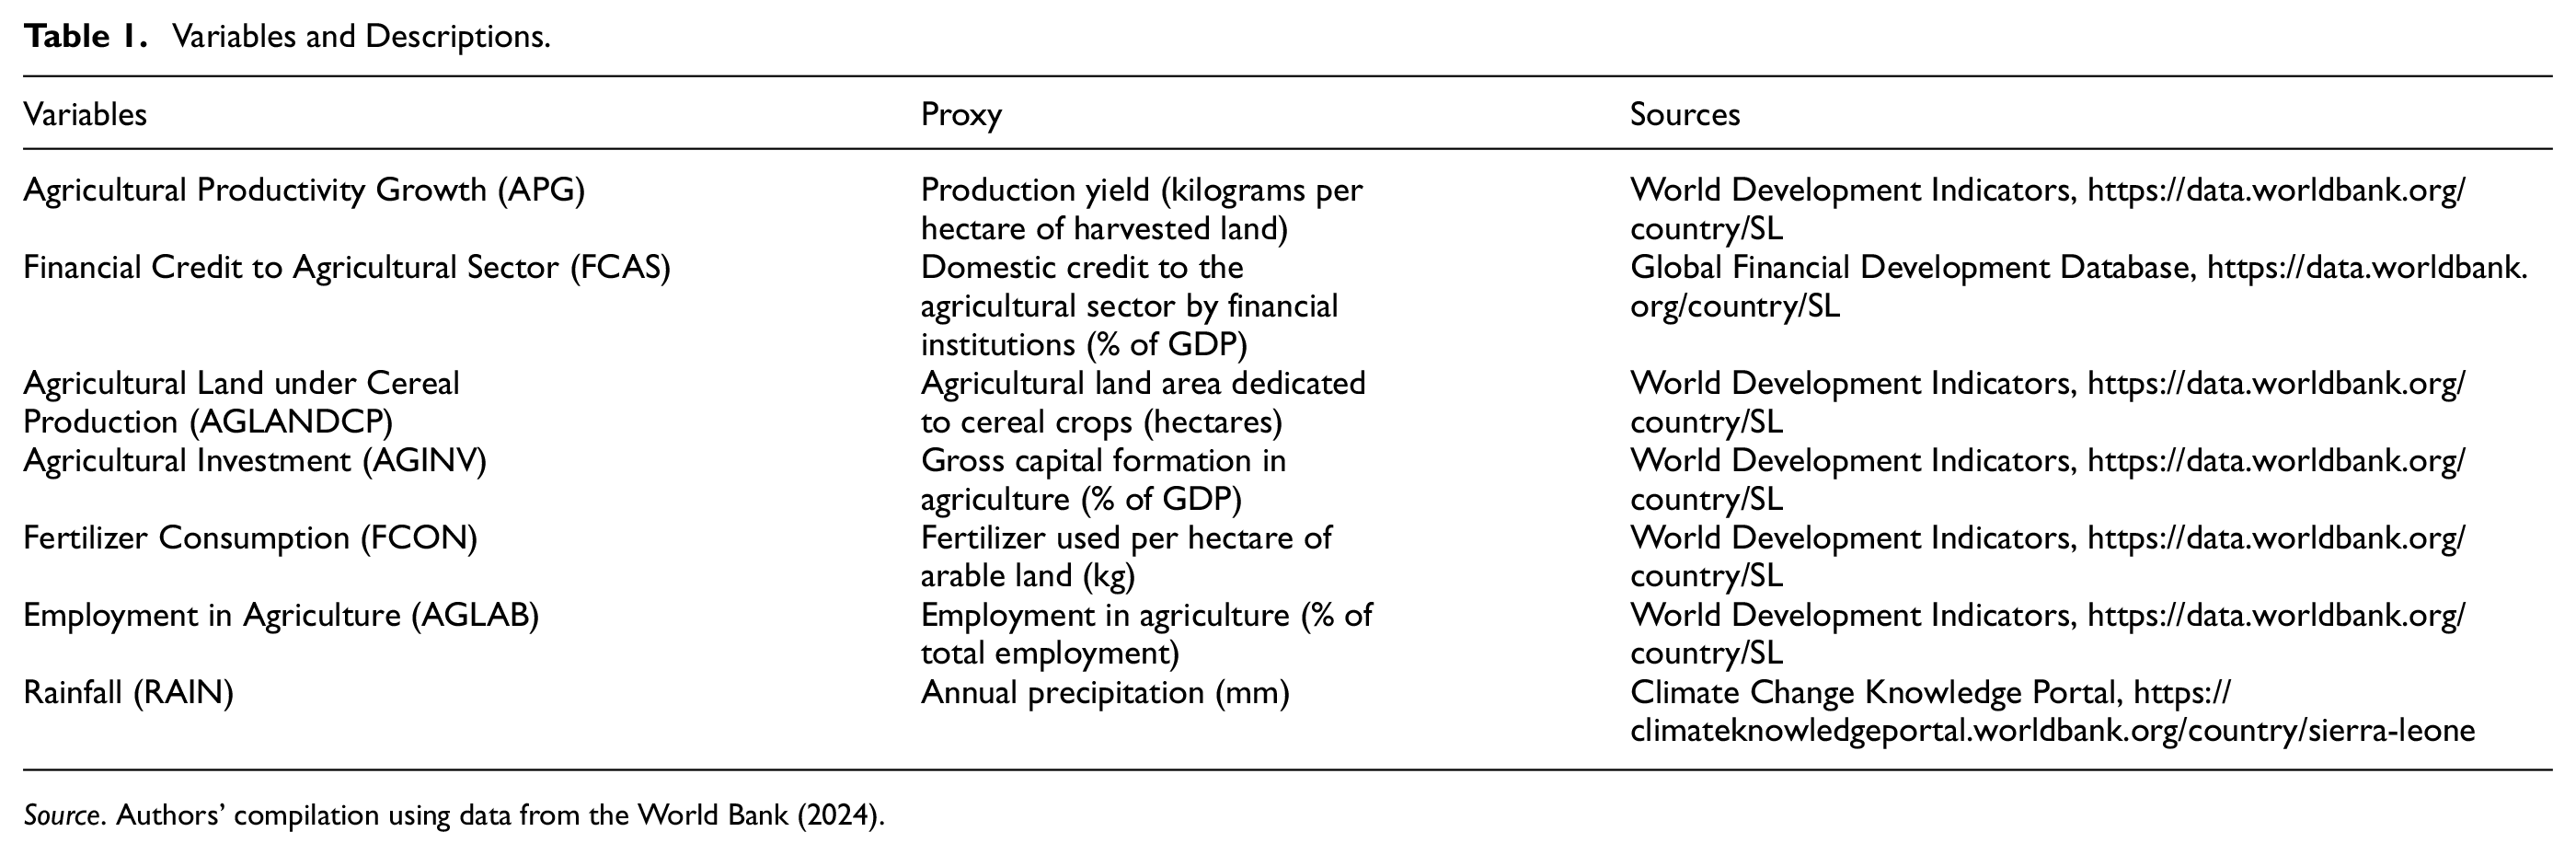
Source. Authors’ compilation using data from the World Bank (2024).
Empirical Results and Discussions
Descriptive statistics and the correlation matrix of Equation 5 variables are shown in Table 2, analyzing seven variables using dispersion measures (maximum, minimum, and standard deviation) and central tendency measures (mean and median), along with shape measurements (skewness and kurtosis). The mean agricultural productivity growth (APG) was 13.5548, with the median being slightly higher than the mean, indicating skewness. A skewness value of −0.0759 suggests a slight skew toward lower values, and a standard deviation of 0.58359 indicates consistency around the mean. The financial credit availability score (FCASB) shows higher variability, with values ranging from −2.9672 to 4.1889. The Jarque-Bera test results mostly exceeded 0.05, suggesting normality, except for APG with a notably low probability. The correlation matrix showed significant positive correlations (p ≤ .05) between agricultural investment, financial credit, fertilizer consumption, and rainfall, with a notable positive relationship between productivity and agricultural investment. However, agricultural labor and land for crop production are negatively correlated with productivity growth, whereas a positive and significant correlation exists between agricultural investment and credit.
Descriptive Statistics.
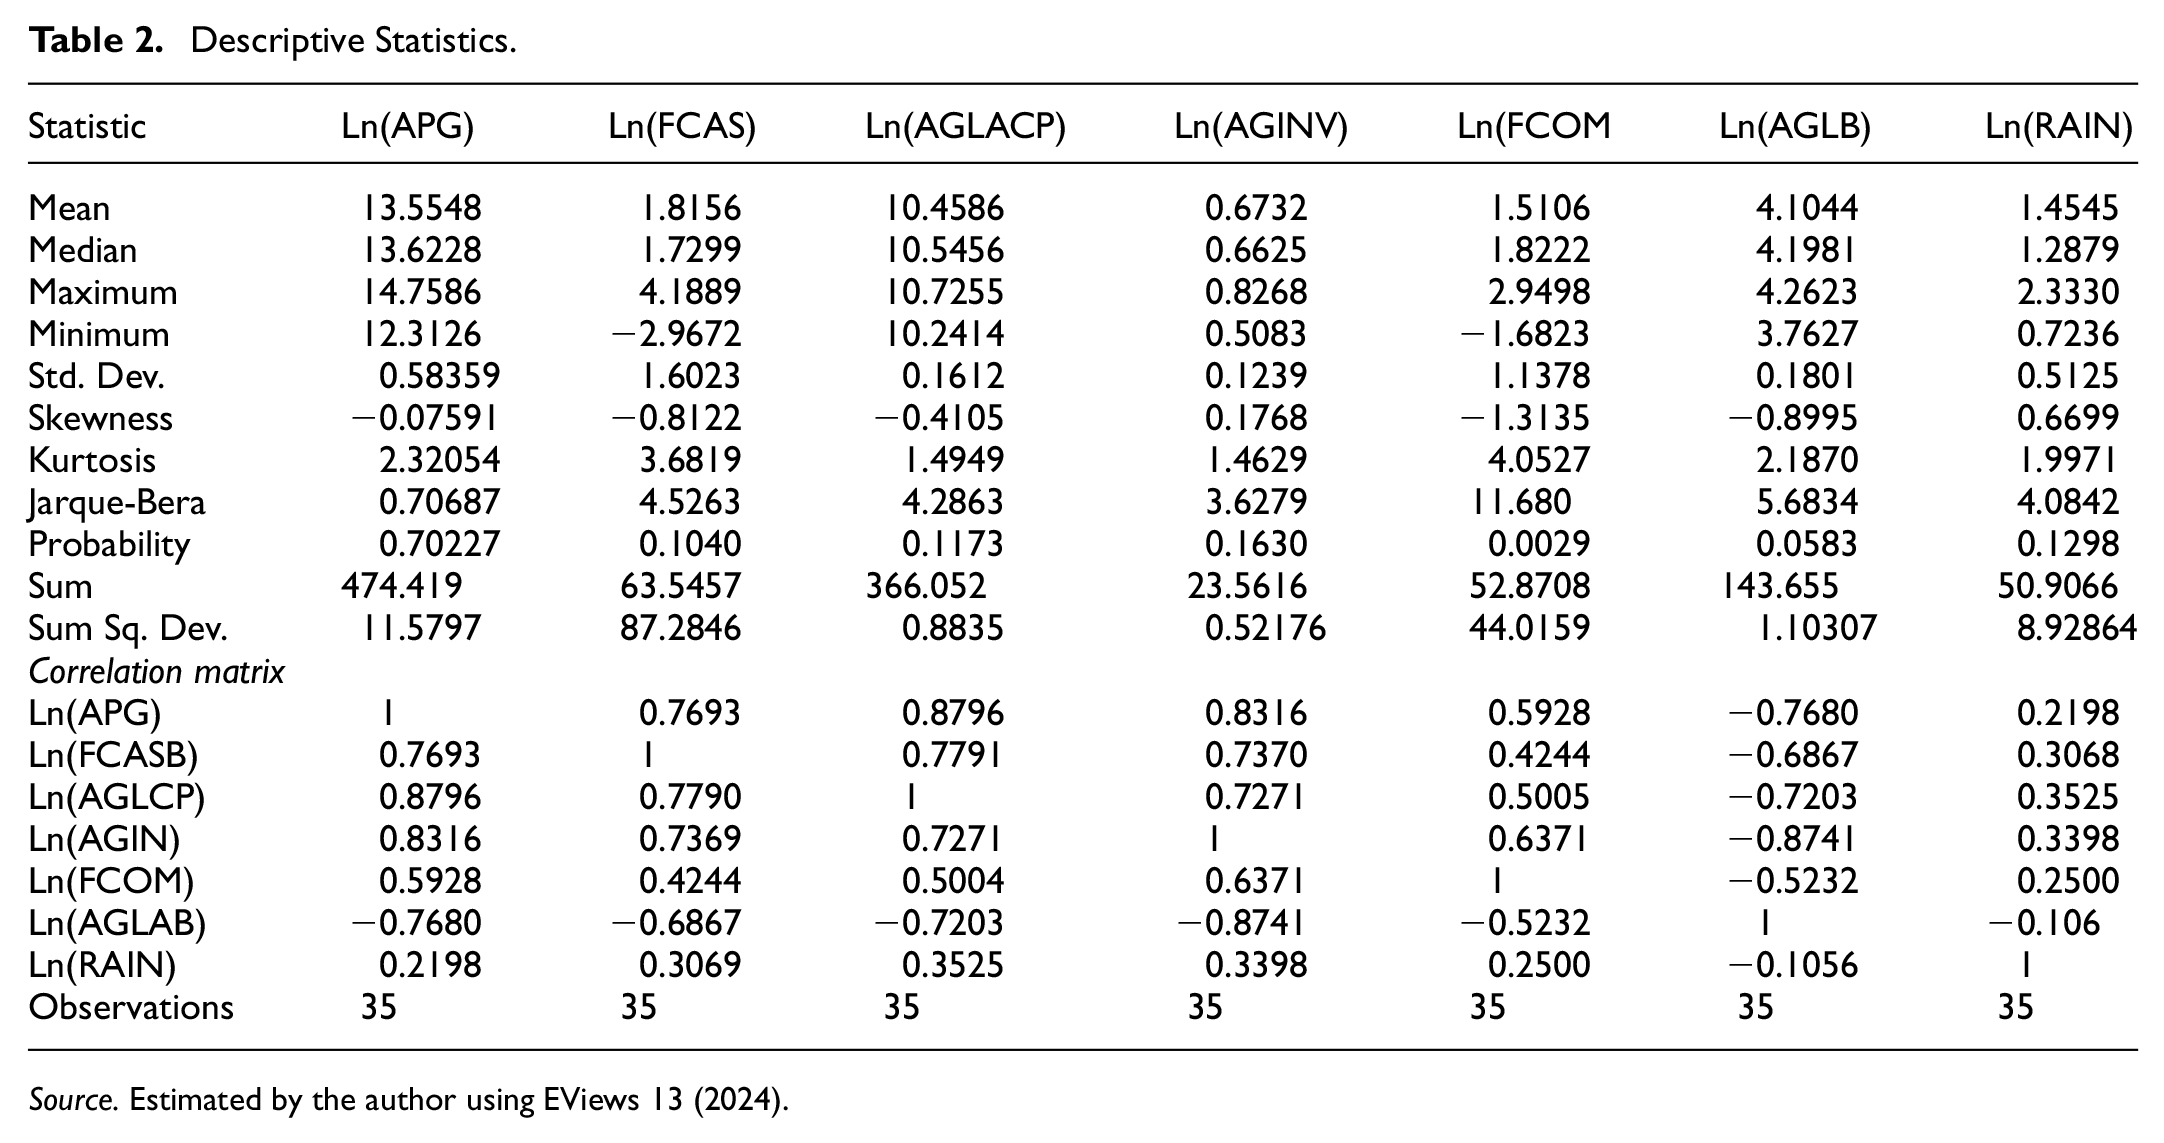
Source. Estimated by the author using EViews 13 (2024).
Result of the Unit Root Test
The results of the initial- and first-difference-corrected unit root tests are presented in Tables 3 and 4, respectively. Critical values at the 1% significance level were compared with observed values from the Phillips-Perron (PP) and Augmented Dickey-Fuller (ADF) tests. Table 3 shows clear evidence of nonstationarity, with the test statistics meeting Mackinnon’s (1996) criteria. Most variables’ stationarity is unclear, except for the agricultural labor force, which is confirmed to be stationary by its p-values, thus supporting the null hypothesis of a unit root. In contrast, the coefficients in Table 4 indicate stationarity for all variables when the first-difference data are analyzed. Values below the 1% and 5% significance thresholds confirm this conclusion, rejecting the null hypothesis of non-stationarity and suggesting that these variables are integrated of the first order or I(1).
At Level Augmented Dickey-Fuller and Phillips-Perron Stationary Test.

Source. Estimated by the author using EViews 13 (2024).
***,**Denotes 1% and 5% significance level.
At First Difference Augmented Dickey-Fuller and Phillips-Perron Stationary Test.

Source. Estimated by the author using EViews 13 (2024).
***,**Denotes 1% and 5% significance level.
Table 5 displays the parameters of the vector autoregression (VAR) model used to determine the optimal lag order. The evaluated criteria include the Akaike Information Criterion (AIC), Schwarz Criterion (SC), Hannan-Quinn criterion (HQ), likelihood ratio test (LR), log likelihood (LogL), and final prediction error (FPE). These criteria were assessed for lag orders ranging from 0 to 2. The data indicate that a lag order of 1 is the best choice, as it yields the highest log likelihood, a statistically significant LR statistic, and lower values of AIC, SC, and HQ compared to other lag orders. Using a lag order of one appears prudent for the VAR model, balancing model complexity and fit. To examine the dynamic relationships between financial credit and agricultural productivity, Johansen’s (1991) trace and maximum eigenvalue cointegration tests were utilized. At a lag length of 1, the p-value is below 5%, leading to the rejection of the null hypothesis and acceptance of the alternative hypothesis. Figure 2 presents variables related to agricultural productivity, credit, labor, irrigated land, and capital investment, providing robust visual proof of the cointegration of the parameters in the productivity from agriculture model. This representation suggests that improvements in rainfall, labor force, credit, and agricultural machinery positively correlate with increases in agricultural output over time. To support these findings, the Cobb-Douglas production function has also been employed (Chisasa & Makina, 2015). However, as Koop (2000, p. 156) cautions, “visual examinations of graphs should not be considered substitutes for statistical tests.” Therefore, additional cointegration analysis was conducted and is presented below to further validate these results.
The SVAR Lag Order Selection Criteria.

Source. Estimated by the author using EViews 13 (2024).
“*” indicate the optimal lag order selected by each criterion.

Co-trending variables of agricultural productivity growth.
The long-term correlations among the variables were analyzed utilizing the Johansen and Juselius (1990) cointegration methodology, revealing that the variables were integrated of order one for AGDP (LAPG), agricultural land (LAGLCP), capital investment (LAGINV), labor (Llabor), and credit (Lcredit). The initial step in implementing this method is to ascertain the suitable lag length—three in this instance—by evaluating the sequential modified likelihood ratio (LR) test statistic. The Johansen Trace cointegration test indicates three integrating equations that confirm the cointegration of credit, land, labor, capital investment, and agricultural productivity at the 95% confidence level (p-value < .05). Both the highest eigenvalue statistic and the trace statistic surpass the critical eigenvalue. These findings confirm the enduring cointegration of labor, agricultural machinery, financial credit, and agricultural productivity. The findings are shown in Table 6 below.
At Level Augmented Dickey-Fuller and Phillips-Perron Stationary Test Interval Between Lags (in First Differences). Logs (APG, FCASB, AGLAND, AGINV, FCOM, AGLAB, and RAIN): Endogenous variables.

Source. Estimated by the author using EViews 13 (2024).
The “*” denotes rejection of the null hypothesis (no or at most r cointegration) at 5% significance, while “**” indicates p values derived from MacKinnon et al. (1999) critical values adjusted for small-sample bias.
The Max-eigenvalue test identifies four cointegrating equations at a significance level of .05, rejecting the null hypothesis. This result aligns with the trace test p-values, which also confirm the four cointegrating equations at the same significance level. The conclusion is derived from the Max-Eigen Statistics and unconstrained cointegration rank test. Using deterministic cointegrating trends, the Johansen cointegration test, conducted on a set of endogenous variables (Case 3: Johansen-Endry Juselius), confirms four cointegrating equations at 0.05 significance. Both the Trace and Maximum Eigenvalue tests surpass the critical levels, with p-values below .05, for the hypothesis of “at most 3” cointegrating equations. For hypotheses of “at most 4” and “at most 5” cointegrating equations, either p-values exceed .05 or the Trace and Maximum Eigenvalue statistics are below critical levels, indicating no additional cointegration. The significant cointegration of the independent and dependent variables at the 5% level suggests a persistent link between financial credit, agricultural productivity growth, and other factors. Both tests confirm an estimated cointegration level of four, rejecting the null hypothesis of no cointegrating equations. The VAR model’s cointegration plot statistically analyzes the long-term impact of financial credit on agricultural productivity. Statistical theory is essential for estimating linear system parameters, and without it, practical cointegration success is unattainable.
Co-Integration Relationship
Figure 3 illustrates the ongoing associations among the variables. The intersection of the grid lines indicates convergence toward a stable and enduring equilibrium. The Jarque-Bera test statistics were used to evaluate the normality of the residuals, while the residual heteroscedasticity test provided insufficient evidence to reject the null hypothesis. Furthermore, the cointegration is shown in Figure 3 by the repeated intersections between the cointegration graph and the zero-grid line. This analysis confirms the existence of a persistent association among the examined components.

Co-integration relation graph.
Polynomial Characteristics of AR Root
Figure 4 presents the solutions for the characteristic polynomial. The presence of a reciprocal root in the AR characteristic function indicates that all points lie within the unit circle, confirming the stability of the VECM and the potential for cointegration in the equation. Additionally, the display includes the standard deviation of each error term. To eliminate autocorrelation from the study’s parameters, Breusch–Godfrey LM tests and correlogram-Q statistics were applied. The residuals were further examined using the Ljung-Box Q statistic, along with autocorrelation and partial autocorrelation functions, to identify higher-order serial correlations and validate the accuracy of the Q statistic. If there is no serial correlation, not all Q statistics are expected to show significance; thus, p-values greater than or equal to .1 indicate the presence of serial correlation. The precision of the estimates was evaluated using LM Test Statistics. According to the null hypothesis, the residuals within the specified lag order do not exhibit serial correlation.

characteristic polynomial Source: Estimated by the author using EViews 13 (2024).
Estimation of the Long-Term Relationship Model
Table 7 illustrates the correlation between financial credit and the growth rate of agricultural productivity. However, the influence of financial credit on productivity development is negligible. The minimal regression coefficients and standard errors for both agricultural production growth and financial credit indicate results with a 1% degree of statistical significance. Specifically, a 1% increase in financial credit for the agricultural sector is expected to result in a 0.105% increase in long-term agricultural productivity growth, assuming all other factors remain constant.
Outcome of the Long-Term Cointegration Relationship.

Source. Estimated by the author using EViews 13 (2024).
Despite government efforts to allocate funds to the agricultural sector, agriculture remains heavily reliant on financial resources, only partially meeting farmers’ needs. Agricultural finance poses significant challenges in Sierra Leone compared to other developing countries. The deterioration of economic infrastructure may exacerbate these issues, hindering the government’s ability to meet farmers’ financial needs and contributing to the limited increase in production. The findings also suggest that variations in agricultural productivity improvements in Sierra Leone are relatively insensitive to financial credit, largely due to the general availability of such credit. This aligns with the findings of Flifli et al. (2019) and Kamara et al. (2018), while contradicting the conclusions of Saravia-Matus et al., (2021).
This study revealed a direct correlation between arable land per hectare and long-term agricultural productivity. The results show a strong, statistically significant relationship between these factors. As indicated in Table 7, a unit increase in farm size leads to a 0.3448 production increase, with a low standard error, suggesting that a 1% increase in agricultural acreage results in a 0.344% productivity rise. This finding supports the idea that larger farms yield greater output. However, a substantial standard error (0.2002) indicated significant variability. A 1% increase in cultivated area per capita, ceteris paribus, is projected to enhance the nation’s agricultural output by 0.3448% in the long term. This study reinforces economies of scale in agriculture, indicating that larger farms may be more efficient and productive. The dependent variable showed a minimal yet elastic response to changes in agricultural land area, aligning with the results of previous studies by Nordjo and Adjasi (2019) and Toaha and Mondal (2023). Previous research indicates that land fragmentation in Sierra Leone has led to a decline in the food supply and altered agricultural practices, thereby reducing output rates (Jones & Patel, 2021; Kamara et al. 2018).
Table 7 indicates a substantial negative correlation between productivity and agricultural investment. This relationship is statistically robust, exhibiting a minimal standard error value and a significance level of 1%. An increase in investment by 1% is associated with a 2.313% decrease in agricultural productivity, suggesting agricultural investment can adversely affect agricultural profitability. Additionally, the findings demonstrate that agricultural productivity responds elastically to investment. The analysis reveals that agricultural investment has a direct relationship with declining agricultural production in Sierra Leone, suggesting that increased investment can positively impact agricultural productivity and the overall sector. This conclusion aligns with several micro-level empirical studies, including Mack et al. (2022) and Rufai et al. (2018). The favorable relationship found by (Gizaw et al., 2023) is not supported by this study.
Fertilizer use enhances agricultural yield and productivity, as illustrated in Table 7, although productivity shows minimal response to changes in fertilizer application. Both agricultural productivity and fertilizer usage (kg/ha) reached 1% statistical significance with low regression coefficients and standard errors, suggesting that a 1% increase in fertilizer use results in a 0.126% rise in agricultural productivity over the long term, assuming that other factors remain constant. Despite government efforts to meet fertilizer needs, fulfilling only a small percentage of Sierra Leone’s agriculture remains fertilizer-dependent. Compared to other developing countries, Sierra Leone’s use of chemical fertilizers to boost output is low but gradually increasing, rising from 2.5 kg/ha in 1990 to 12 kg/ha in 2018. Cereal production also increased from 16.5 quintals/ha in 2009 to 23.94 quintals/ha in 2020 (Ayele & Tamirat, 2020). These findings confirm the inelastic response of agricultural productivity to fertilizer use in Sierra Leone, due to the minimal application per hectare, aligning with the conclusions of (Martey et al., 2019; Bangura et al., 2021).
Table 7 reveals that a 1% increase in agricultural labor results in a 1.214% increase in agricultural production, significant at the 1% level. This implies that a 1% increase in labor leads to a 1.21% growth in agricultural productivity (APG), suggesting that additional output can be achieved by employing more labor, particularly as machinery use advances. This is largely because rural households in Sierra Leone depend more on family labor than on hiring external workers for agricultural tasks. As family size grows, the likelihood of increased productivity through effective agricultural management increases. These findings suggest that hiring more labor is a viable strategy for boosting agricultural productivity. Additionally, the dependent variable is more responsive to a 1% change in labor. These results contradict those of Asmamaw and Hong (2024), who analyzed agricultural production determinants in Ethiopia.
This study indicates that a 1% annual increase in rainfall correlates with a 0.14% decrease in agricultural productivity, revealing a negative relationship. The coefficient of −0.1483, although negative compared to other variables in the cointegrating equation, signifies that rainfall does not enhance productivity growth but has a significant impact. This could be lack of irrigation system, with certain regions being prioritized over others, thereby limiting overall productivity growth. The findings show that agricultural productivity growth in Sierra Leone is inelastic to changes in climate. These results align with those of Osman Nabay et al. (2022), who also examined the influence of agricultural investment on Sierra Leone’s economic development.
Error Correction at Co-integration Lag Order
The speed of the error-correction model (ECM) in returning to equilibrium after a brief external shock. As Engle and Granger (1987) demonstrate, the correction plot moves toward equilibrium when non-stationary variables exhibit a co-integrating relationship. To better capture short-term fluctuations of the variables, our model adopts a lag order of two, which is the maximum permitted in the VECM estimate as stated in the APPENDIX of Table A1. The coefficient for the prior year’s agricultural output was negative and statistically significant at 1% level, suggesting that any deviation from the equilibrium point may yield long-term repercussions. Consequently, the ECM effectively captures the current and ongoing performance of the system. In the final model, only variables with statistically significant values were retained, while insignificant ones were excluded. This results in a short-term model based on our findings.
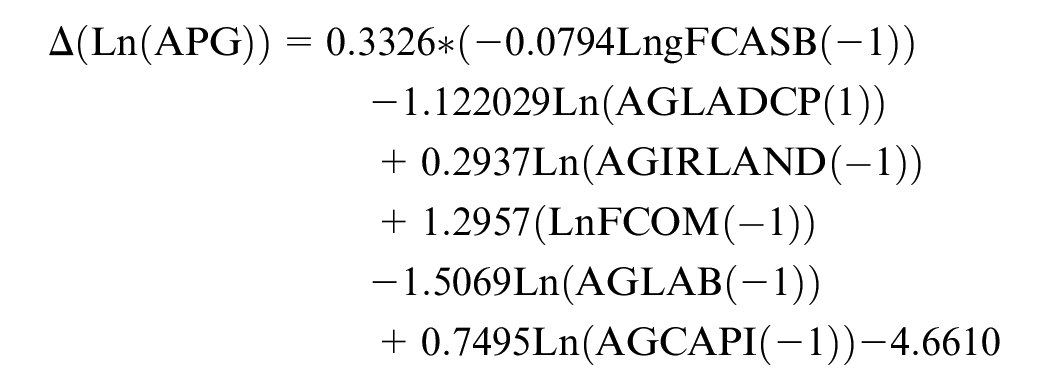
The model rapidly attains long-term equilibrium, as evidenced by the statistically significant and negative “speed of adjustment” or “error term” coefficients. This result supports the existence of a stable long-run relationship among APG, financial credit and other variables in the model. A coefficient of 0.33 indicates that 33% of the adjustments toward long-term equilibrium occur annually, suggesting a gradual progression toward equilibrium over several months. To investigate this phenomenon, the dynamic behavior of the model was analyzed using the variance decomposition and impulse response.
Variance Decomposition and Impulse Response
Impulse-response analysis (utilizing Cholesky ordering) and variance decomposition were used to interpret the results. The study used impulse-response graphs from Figure 5 to demonstrate how shocks in the independent variables affected the agricultural productivity growth (APG)-dependent variable within the model. In addition, variance decomposition was applied to quantify the extent to which variations in one variable could be attributed to other variables in the system under investigation. The reveal intricate relationships between financial credit, agricultural productivity, investment, labor, fertilizer consumption, and Rainfall in agriculture. The reaction of agricultural productivity growth in Sierra Leone to financial credit shocks, as depicted in the first graph of Chart 1, reveals a notable positive trend, which is particularly evident after the second period. This observation suggests that increased access to financial credit has a significant and beneficial impact on the country’s agricultural productivity. The positive relationship between credit availability and agricultural output aligns with the findings of several studies in the field, including those conducted by Barrie et al. (2021), Osman Nabay et al. (2022), and Abdela et al. (2019).

Show impulse response estimated by the author using EViews 13 (2024).
However, the negative response in Period 10 suggests that improvements in investment, labor, land utilization, fertilizer utilization and rainfall may have temporarily reduced the impact of financial credit on productivity. The impact of investment on agricultural growth shows initial negative effects followed by positive impacts, indicating a potential adaptation period for new technologies or practices. This result is similar to the studies of Davidson et al. (2012) and Ferrucci (2010), which emphasize the impact of investment on agricultural productivity. The analysis revealed a unidirectional causal relationship between agricultural productivity and financial credit, with productivity innovations leading to increased financial support for the sector, suggesting that improved agricultural performance may encourage greater investment. This study highlights the complex interplay between investment and labor, as well as the positive influence of investment on financial credit across all periods. However, shocks to the financial credit system had a detrimental impact on labor in the early periods, emphasizing the far-reaching consequences of financial disruptions. These findings underscore the intricate interdependencies within agricultural ecosystems and the importance of balanced strategic interventions for sustainable growth. The results align with those of Ghana (Toaha & Mondal, 2023) and Nigeria (Asaleye et al. 2020) and broader regional analyses (Ndolage et al. 2020) demonstrating the positive impact of agricultural credit on economic growth and further emphasizing the significance of financial support in driving agricultural productivity and overall economic development.
The variance decomposition analysis in Table A2 of the APPENDIX elucidates the short- and long-term impacts of external disturbances on agricultural variables over 5 years. Initially, agricultural productivity gains were entirely attributable to innovation. However, fluctuations over subsequent years led to a significant reduction in productivity, reaching 68.28% by the fifth year. The analysis revealed a complex interplay between factors affecting agricultural productivity, including land under crop production, investment, fertilizer consumption, labor, and rainfall, with contributions ranging from 2.99% to 20.83%. The impact of financial credit was predominantly due to innovation in the first year, accounting for 96.14% of the variance, with a minor contribution from agricultural productivity. Over time, the influence of agricultural productivity on financial credit has decreased marginally. The analysis demonstrates the dynamic nature of the impact of agricultural land on productivity, with initial exogenous disturbances having a substantial effect (97.40%) that gradually diminished. Other factors, such as investment and rainfall, also shape productivity outcomes. The study highlights the changing contributions of innovations in fertilizer utilization and agricultural labor, which exhibited notable decreases from initial values by the final period, indicating their evolving influence on the agricultural sector over time.
In the first four trimesters and early phases, financial credit shocks significantly affected agricultural productivity. After 1 year, the effect began to diminish and reached its zenith at approximately 4 years thereafter. The advantageous effects began to diminish after the fifth year. This outcome indicates that financial credit shocks substantially affected agricultural productivity in Sierra Leone. Both short- and long-term positive financial credit shocks influence agricultural productivity, as Figure 5 shows. The effect is particularly beneficial in the medium term, spanning 2 to 4 years, owing to its enhanced productivity. The high cost of borrowing in the agricultural sector continues to hinder the growth of agricultural production in Sierra Leone, affecting both short- and long-term outcomes. It is imperative to advocate for policies that augment agricultural productivity and emphasize medium-term implementation. During this period, bank financing positively affected the growth of agricultural output. Auxiliary measures are essential for sustaining this trajectory over the long term. These initiatives may include improving quality and increasing financial accessibility for the agricultural sector. To alleviate the negative effects of financial credit shocks after the fifth year, it is essential to implement policies that maintain agricultural productivity. Improving workforce quality via specialized education and training programs can significantly enhance long-term productivity. Moreover, regulating the allocation of financial credit to the agricultural sector may alleviate the high costs associated with loans. Policymakers should prioritize creating a favorable environment for agricultural investment by offering incentives and reducing obstacles to credit access.
The Toda-Yamamoto (T-Y) causality test in Table 8 revealed complex relationships between the variables in the vector autoregression model. For the logarithm of agricultural productivity growth (LOG(APG)) as the dependent variable, financial credit to the agricultural sector by banks (LOG(FCASB)) emerged as a strong predictor, showing significant Granger causality at the 1% level. Agricultural land under crop production (LOG(AGLANDCP)) and agricultural labor (LOG(AGLAB)) exhibit Granger causality at the 10% significance level. The joint test for LOG(APG) indicates robust overall Granger causality for all variables combined, suggesting that these factors collectively predict agricultural productivity growth. The analysis revealed several unidirectional causal relationships. Financial credit is found to Granger-cause agricultural productivity growth (APG), supporting the notion that credit availability leads to increased agricultural productivity. The result aligns with previous research by Chisasa and Makina (2015) in South Africa and Samuel and Asana (2021), demonstrating cross-regional consistency of agricultural credit impacts. Other unidirectional relationships include AGDP Granger causing public investment, agricultural labor Granger causing public investment, and public investment Granger causing agricultural credit. These results, combined with the bounds test indicating cointegration among variables, provide a comprehensive understanding of the dynamics within the agricultural sector and related economic factors. The findings underscore the importance of credit availability, labor, and investment in driving agricultural productivity and highlight the interconnected nature of these variables in agricultural economic development.
The Toda-Yamamoto (T-Y) Test Result.

Source. Estimated by the author using EViews 13 (2024).
p < .1. **p < .05. ***p < .01.
Conclusion and Policy Implication
This study employs the Structural Vector Autoregression (SVAR) methodology to examine the relationship between agricultural productivity in Sierra Leone and financial credit. Utilizing variables such as agricultural land, investment, fertilizer use, and rainfall, this study investigates the factors that influence the increase in agricultural productivity between 1990 and 2024, to provide a comprehensive understanding of the elements affecting productivity in the agricultural sector. The SVAR methodology enables the analysis of complex relationships between these variables over time. To investigate the Granger causality directions among the variables, this study also applies Toda-Yamamoto’s (1995) methodology. The empirical findings indicate a long-run cointegration relationship between agricultural credit, land fertilizer consumption, labor, rainfall, and agricultural productivity growth. In both the short and long terms, agricultural lending has been demonstrated to have a positive impact on agricultural GDP. The results of the T-Y test reveal that financial credit increases agricultural productivity, but there is no evidence of a reverse relationship. The findings demonstrate a strong association between financial credit and agricultural productivity in Sierra Leone, affirming the substantial role of credit in agricultural sector growth. The results of the study indicate that agricultural land, labor, and fertilizer utilization have positive and significant impacts on agricultural productivity, whereas investment and rainfall do not exhibit a significant effect on agricultural productivity in the long run.
The results of this study indicate that financial credit is essential for long-term increases in agricultural productivity, suggesting that the Sierra Leonean government should continue to expand credit flows into the agricultural sector. In the long term, however, credit has a substantially smaller effect on agricultural output than labor (a 1% increase in credit and labor leads to 0.19% and 1.01% increases in agricultural productivity, respectively). This finding implies that the government should focus on methods to increase agricultural loan availability and strategies to improve agricultural credit efficiency. To mitigate the adverse effects of the 2-year lag in financial credit on short-term agricultural productivity, financial credit institutions should collaborate closely with smallholder farmers and agricultural enterprises. This collaboration should emphasize providing flexible lending periods and amounts, particularly for short-term loans, which align with the realities of agricultural production. To provide agricultural finance effectively, it is necessary to establish more agricultural banks and strengthen existing ones. The Central Bank of Sierra Leone should implement regulations to remove barriers to credit allocation to the agricultural sector, thereby enhancing productivity and benefiting the banking sector. The development of customized financial products that correspond to the agricultural production cycle can mitigate the timing discrepancies between credit availability and farmers’ requirements, optimize input allocation, and enhance overall productivity.
The significant and favorable effect of agricultural labor on agricultural productivity attests to the crucial role that labor plays in enhancing agricultural output in the long term. However, the substantial impact of labor suggests that throughout the study period, the agricultural sector in Sierra Leone is heavily dependent on labor utilization. Therefore, prioritizing training and education for farmers to improve their labor skills and expertise is essential for enhancing agricultural productivity. Implementing contemporary farm technology (both biochemical and mechanical advancements) to reduce the labor-intensive nature of the agricultural sector is another approach to increasing the productivity and efficiency of farming methods. With a cointegration analysis demonstrating a substantial correlation between land extent and production levels, this study further emphasizes the significance of agricultural land in increasing productivity. Based on these findings, policymakers should establish and implement effective mechanisms to improve the flow of financial credit to the agricultural sector. This can be achieved by collaborating with financial institutions to develop tailored credit services and solutions. Policies designed to optimize land use and enhance sustainable agricultural practices may significantly contribute to productivity growth in Sierra Leone’s agricultural sector. The long-term impact of rainfall on agricultural productivity indicates that weather-related factors play a significant role in agricultural sector productivity. Sierra Leone, as a developing country significantly affected by climate change—particularly in terms of altered precipitation patterns and intensity—requires increased focus on enhancing farming practices and technological adaptation within the agricultural sector. This approach aims to strengthen the adaptive capacity to address climate change and to promote rapid and sustainable growth in agriculture. These findings indicate that agricultural investment does not have a significant impact on agricultural productivity in the long run, potentially because of the inefficiency of investment projects. Therefore, the government should focus on improving the assessment and administration of projects financed by the state budget to achieve superior investment outcomes in the agricultural sector.
Footnotes
Appendix
Distinctive Analysis of Variance Decomposition.

| Period | S.E. | LOG(APG) | LOG(FCASB) | LOG(AGLANDCP) | LOG(AGINV) | LOG(FCOM) | LOG(AGLAB) | LOG(RAIN) |
|---|---|---|---|---|---|---|---|---|
| Variance decomposition of LOG (APG) | ||||||||
| 1 | 0.175026 | 100.0000 | 0.000000 | 0.000000 | 0.000000 | 0.000000 | 0.000000 | 0.000000 |
| 2 | 0.207729 | 80.13671 | 9.364983 | 0.844163 | 6.408062 | 0.591457 | 1.187388 | 1.467241 |
| 3 | 0.270915 | 47.26462 | 42.94842 | 2.020681 | 3.950774 | 1.979577 | 0.725627 | 1.110296 |
| 4 | 0.308155 | 36.58901 | 39.32158 | 2.385041 | 5.276671 | 12.81480 | 2.754680 | 0.858212 |
| 5 | 0.337635 | 30.89169 | 32.76986 | 4.877882 | 7.023093 | 19.72362 | 3.918581 | 0.795276 |
| Variance decomposition of LOG(FCASB) | ||||||||
| 1 | 1.021132 | 0.196546 | 99.80345 | 0.000000 | 0.000000 | 0.000000 | 0.000000 | 0.000000 |
| 2 | 1.177548 | 0.177457 | 90.33351 | 4.76E-05 | 2.217185 | 4.651754 | 2.289333 | 0.330710 |
| 3 | 1.224863 | 0.241656 | 83.54498 | 1.561749 | 4.882900 | 6.961948 | 2.483496 | 0.323270 |
| 4 | 1.272874 | 0.224769 | 78.85521 | 2.509439 | 8.726345 | 7.045166 | 2.334937 | 0.304135 |
| 5 | 1.299923 | 0.219090 | 75.77908 | 4.408432 | 9.814438 | 7.157385 | 2.329955 | 0.291624 |
| Variance decomposition of LOG(AGLANDCP) | ||||||||
| 1 | 0.031051 | 19.94872 | 0.008975 | 80.04230 | 0.000000 | 0.000000 | 0.000000 | 0.000000 |
| 2 | 0.045801 | 10.74586 | 0.018152 | 59.94805 | 14.42678 | 8.212964 | 2.343022 | 4.305179 |
| 3 | 0.061788 | 6.013280 | 2.895226 | 55.83811 | 13.95458 | 16.02573 | 2.623358 | 2.649723 |
| 4 | 0.078144 | 5.043879 | 1.940535 | 44.74294 | 17.12716 | 24.47076 | 4.533512 | 2.141216 |
| 5 | 0.091681 | 5.177558 | 1.929286 | 40.83915 | 17.42759 | 27.73543 | 5.267038 | 1.623948 |
| Variance decomposition of LOG(AGINV) | ||||||||
| 1 | 0.021851 | 1.456781 | 0.348922 | 2.947215 | 95.24708 | 0.000000 | 0.000000 | 0.000000 |
| 2 | 0.031377 | 13.04455 | 0.472429 | 5.057590 | 67.48255 | 10.68081 | 1.725548 | 1.536516 |
| 3 | 0.038316 | 26.74020 | 0.428824 | 4.482619 | 49.90931 | 13.25435 | 1.477236 | 3.707456 |
| 4 | 0.045667 | 32.00894 | 2.577843 | 7.006440 | 39.99201 | 9.988363 | 1.418387 | 7.008010 |
| 5 | 0.053159 | 28.41229 | 8.723940 | 10.66890 | 34.40108 | 7.575925 | 2.213352 | 8.004508 |
| Variance decomposition of LOG(FCOM) | ||||||||
| 1 | 0.752525 | 5.975592 | 0.406027 | 1.909396 | 19.83309 | 71.87589 | 0.000000 | 0.000000 |
| 2 | 1.021814 | 8.127305 | 5.909915 | 2.850130 | 26.39073 | 56.31744 | 0.189895 | 0.214587 |
| 3 | 1.065665 | 9.327843 | 6.293424 | 2.897985 | 26.14016 | 54.24211 | 0.813703 | 0.284777 |
| 4 | 1.099729 | 8.946133 | 11.13977 | 2.979625 | 24.82004 | 50.94597 | 0.801500 | 0.366964 |
| 5 | 1.153388 | 8.148264 | 16.49837 | 3.186294 | 23.21514 | 47.57450 | 0.958036 | 0.419393 |
| Variance decomposition of LOG(AGLAB) | ||||||||
| 1 | 0.016714 | 2.886690 | 3.214892 | 6.081969 | 3.181088 | 19.89509 | 64.74027 | 0.000000 |
| 2 | 0.024328 | 1.363099 | 6.147326 | 6.275974 | 2.509253 | 11.39011 | 71.18925 | 1.124985 |
| 3 | 0.030234 | 1.090899 | 9.625576 | 4.063651 | 4.906964 | 7.375995 | 69.90872 | 3.028194 |
| 4 | 0.036469 | 0.758693 | 10.75336 | 3.418413 | 10.52323 | 5.247667 | 63.31275 | 5.985891 |
| 5 | 0.044230 | 1.354127 | 11.13466 | 4.793435 | 17.22122 | 4.030415 | 52.02186 | 9.444283 |
| Variance decomposition of LOG(RAIN) | ||||||||
| 1 | 0.253393 | 17.76268 | 0.015426 | 16.91607 | 7.446490 | 2.699740 | 12.01442 | 43.14517 |
| 2 | 0.353282 | 16.82683 | 1.962655 | 24.87272 | 6.224091 | 4.082740 | 10.77964 | 35.25133 |
| 3 | 0.396515 | 15.03949 | 2.467991 | 24.49546 | 10.89841 | 4.204997 | 9.424904 | 33.46874 |
| 4 | 0.423504 | 14.11235 | 2.321283 | 25.54445 | 14.77571 | 4.211562 | 8.599463 | 30.43519 |
| 5 | 0.451801 | 13.78390 | 2.051337 | 25.49278 | 18.53547 | 3.818478 | 8.845511 | 27.47253 |
| Cholesky Ordering: LOG(APG) LOG(FCASB) LOG(AGLDCP) LOG(AGINV) LOG(FCOM) LOG(AGLAB) LOG(RAIN). | ||||||||
Source. Estimated by the author using EViews 13 (2024).
Funding
The author(s) received no financial support for the research, authorship, and/or publication of this article.
Declaration of Conflicting Interests
The author(s) declared no potential conflicts of interest with respect to the research, authorship, and/or publication of this article.
Data Availability Statement
The data supporting the findings of this study are available from the corresponding author upon reasonable request.