
Abstract
This article focuses on the validity of the students’ attitudes toward mathematics scale based on data from TIMSS 2019. The scale has been reported as having a three-factor structure for decades, but this study assumes the validity can appear differently depending on the country or culture. Thus, the scale should first be checked for invariance between countries. This study selected five English-speaking countries to prevent translation effects. The results of exploratory factor analysis (EFA) indicate that the factor loading values of the two items were below 0.4 in more than four countries. The EFA model with the two items deleted had a greater fit than the others in all countries using confirmatory factor analysis (CFA). A metric invariance model based on the EFA results showed the greatest fit when using multiple-group CFA. The findings suggest that two items may need revision, and the results must be interpreted considering differences in students’ cultural backgrounds, even though the questionnaires were administered in the same language, which warrants further research.
Plain language summary
In international comparative studies, responses between countries may vary due to nuances in culture or language, even when the same survey items are used. Recognizing this, this study was conducted to investigate potential validity issues in students’ attitudinal scales in TIMSS, which has been implemented for over 20 years. To minimize environmental differences, only five English-speaking countries were included in the study. The results revealed low validity for two items across all countries. After removing these problematic items and reanalyzing the data, the validity of the scales significantly improved. Therefore, a review of these two items in the attitudinal scales in TIMSS is warranted to enhance.
Introduction
The Trends in International Mathematics and Science Study (TIMSS) has been widely used to compare mathematics and science achievement among countries. Researchers can use TIMSS to investigate the relationships among academic achievement in mathematics and science, student background, school effects, and teachers in these subjects. About 40 countries have participated in the survey every cycle since 1995 and have established educational policies based on the survey results. TIMSS conducts surveys using non-cognitive data (context questionnaires on the background information of students, teachers, school administrators, and national curricula) as well as cognitive data to measure the mathematics and science abilities of fourth and eighth-grade students. Many researchers have focused on factors affecting achievements in mathematics and science and have used students’ background information as key predictors. The scale that measure attitudes toward mathematics and science is popular as variable to analyze the effect of student backgrounds. Students’ motivation for learning or positive emotions toward subjects (e.g., interest, confidence, endurance, etc.) enables them to learn steadily and encourage students to seek challenging goals (Greensfeld & Deutsch, 2022; Pekrun et al., 2002). By the same reasoning, if students have positive attitudes toward mathematics or science, they will be able to learn those subjects more easily than if they have negative feelings. Thus, attention should be paid to learners’ motivation or emotions toward mathematics or science.
The TIMSS attitude scales toward subjects have been widely used as variables in recent decades. However, only a few researches have studied the validity of these attitude scales (Ertürk & Oyar, 2021; Eser, 2021; Liou & Lin, 2021; Liu & Meng, 2010; Oon & Fan, 2017; Reynolds et al., 2022; Sabah et al., 2013; Uyar, 2021). This study explores the internal structure of 27 items from students’ attitudinal questionnaires from TIMSS 2019 and investigates their validity using factor analysis. Recent studies on the validity of the attitudinal scales in TIMSS have focused on determining whether the invariance of scales was sustained regardless of conditions such as gender, race, and country. However, the invariance between countries under the same conditions should be checked first rather than different languages or cultures. Thus, this study focuses on whether the same internal structure of factors is observed across countries after controlling for translation effects by examining measurement invariance. When measurement invariance and the validity of the attitude scale are secured among countries, the interpretation of the results of the attitude scale across countries will be more precise than before.
Theoretical Background
Trends and Alterations of the Attitude Scales
TIMSS has been used to survey the Students’ Attitudes Toward Mathematics scale (the SAM scale) in 4-year cycles since 1995. The International Association for the Evaluation of Educational Achievement (IEA) has developed and updated many of the TIMSS 2019 attitudinal items, combining them into scales that measure a single underlying latent construct, as described in their technical report. Many of these scales have been continuously changed to gather useful information about learning attitudes over the last 20 years. Some items have consistently measured specific factors or constructs for seven cycles, while others have been changed or deleted while new items are inserted to reflect current research or trends (Martin et al., 2020). Appendix 1 shows the change trends and alterations of the attitudinal scales.
Overview of Research Trends of TIMSS Attitudinal Scales
Many researchers have used the SAM scale in TIMSS as a variable to explain students’ achievement or motivation. Two hundred fifty-nine journal articles have used the scale as a predictor variable, and 24 journal articles have studied the validity of the attitude scale in the Web of Science as of May 2023. Among the 24 journal articles, most papers examined validity by confirming measurement invariance in specific conditions or using demographic characteristics such as gender, race, regional variation, school type, and home environment (Aditomo & Klieme, 2020; Ardic & Gelbal, 2017; M. Chen & Hastedt, 2022; Glassow et al., 2021). Eser (2021) investigated the measurement invariance of attitudinal scales based on home resources for fourth-grade students in Turkiye in TIMSS 2015. Liou and Lin (2021) also studied measurement invariance regarding attitude scales toward science using data from eighth-graders in Australia, the United States, and Taiwan from TIMSS 2019. Oon and Fan (2017) provided psychometric information on attitudinal scales such as measurement invariance, unidimensionality, optimum utilization, and item difficulty hierarchy based on the Rasch model using eighth graders from Hong Kong and Singapore in TIMSS 2011. Reynolds et al. (2022) examined the measurement invariance and cross-country comparability of attitudinal scales in international educational large-scale assessments using item response theory (IRT) modeling approach. Using data from fourth graders from 58 countries and eighth graders from 39 countries from TIMSS 2019, they concluded that the measurement invariance of item 19G was unsatisfactory (“My teacher tells me I am good at mathematics.”).
Existing studies have also investigated factor structures across countries (Abu-Hilal et al., 2013; Ayob & Yassin, 2017). Liu and Meng (2010) examined the factor structure of attitudinal scales according to country and degree of achievement using data from eighth-graders in Japan, Hong Kong, Taiwan, and the USA from TIMSS 2003. Uyar (2021) evaluated the appropriateness, factor structure, and invariance of Turkish eighth-graders’ attitudes toward mathematics from TIMSS 2015 using an exploratory structural equation model and confirmatory factor analysis (CFA). Uyar (2021) concluded that the scales satisfied the invariance conditions. Marsh et al. (2013) compared validity measures such as factor structures, method effects, gender differences, and convergent and discriminant validity between four Arab-speaking countries and four English-speaking countries using the TIMSS 2007 dataset. They highlighted methodological weaknesses in the TIMSS approach to these measures.
In contrast, some papers have studied methodological properties to measure validity. Ertürk and Oyar (2021) examined the measurement invariance of attitudinal scales toward mathematics through different methods such as multiple group confirmatory factor analysis (MGCFA), multiple group latent class analysis (MGLCA), and a mixed Rasch model. They used data from eighth-grade students in the USA, Canada, and Turkiye from TIMSS 2015. They concluded that examining assumptions and considering the variable structure is necessary when deciding on the method in measurement invariance studies. Michaelides (2019) analyzed the factor structure of 18 item scales regarding mathematics and the effect of negative keying items using data from fourth graders from six European countries from TIMSS 2011. He stated that reverse-keyed items were responded differentially according to age or achievement level and suggested reconsidering the use of reverse-keyed items in surveys of young students to confirm the validity. Sabah et al. (2013) also discussed misfitting negatively worded items in TIMSS. They investigated how to validate a scale of eighth graders’ attitudes toward science based on eight items from TIMSS 2007, using Rasch measurement perspectives across countries along the states of achievement. They concluded misfit items must be deleted to support the validity of the attitudinal scales.
Studies using TIMSS and other datasets have demonstrated the need to thoroughly check the validity when using reverse-keyed items in research (Bolt et al., 2020; Bulut, 2021; Bulut & Bulut, 2022; Kam & Meyer, 2023; Lindwall et al., 2012). Lindwall et al. (2012) emphasized that positively and negatively worded items did not show invariant across countries and may be interpreted differently depending on the student’s cultural or linguistic background.
Many studies on the validity of TIMSS have considered the potential influence of students’ gender, age, and cultural or linguistic background across countries, with most investigating the influence of demographic characteristics and various other measurement invariance (Abu-Hilal et al., 2013; Ayob & Yassin, 2017; Liu & Meng, 2010; Marsh et al., 2013). A research gap remains regarding whether linguistic similarity across countries can compensate for validity issues in international assessments like TIMSS that include positively and negatively worded items. This study seeks to address this gap in the literature.
A discussion on the validity of attitudinal scales in TIMSS has been conducted because it is a significant issue in large-scale international assessment. It is crucial to confirm the validity before using data to research and establish education policy. The TIMSS dataset is widely used in research to compare educational outputs across countries. Thus, it is necessary to check whether the validity of the scales is secured among countries before comparing them.
Validity Results From the TIMSS 2019 Technical Report
The IEA reported that the principal components analysis (PCA) was conducted to prove that it provides comparable measurements across countries, and the component loadings of each questionnaire item from the PCA were positive and substantial, indicating a strong correlation between each item and the scale in each country (Martin et al., 2020). Therefore, this study verified a single underlying latent construct as described in IEA’s technical report using PCA.
TIMSS explains factors affecting students’ motivation to learn and categorizes the SAM scale into “Students Like Learning Mathematics,”“Students are Confident in Mathematics,” and “Students Value Mathematics” within the report (Mullis & Martin, 2017). In this study, we did not use TIMSS’s terms for learning attitudes, simplifying them to words such as “interest,”“confidence,” and “value recognition.”
Methods
Datasets and Sample
Validity results vary when conditions such as gender, age, race, culture, and language differ. To ensure the validity of the attitudinal scale in international surveys, the gaps between these conditions must be reduced. This study selected datasets of eighth graders from TIMSS 2019 according to the results of Michaelides (2019) and Sabah et al. (2013), who found that responses to the reverse-keyed items were influenced by achievement, and this influence was stronger among young students, such as fourth graders, than among older students (Bolt et al., 2020; Bulut, 2021; Bulut & Bulut, 2022; Kam & Meyer, 2023; Lindwall et al., 2012). The questionnaire contained seven reverse-keyed items out of 27. Therefore, eighth graders were deemed to be the appropriate age group of students should be considered in the survey.
In addition, it is important to examine the internal structure of factors after controlling for translation effects to evaluate the validity of the scales used in various countries. This study chose a dataset from linguistically similar countries that had consistently participated in TIMSS at least three times recently to minimize differences in the linguistic meaning of items meaning and the gap in experiences taking the survey. TIMSS 2019 collected data on the first languages of students and which language they used to respond to the survey. This information is included in the language of the student context questionnaire from each country’s dataset provided by the TIMSS website. We selected datasets from countries in which over 95% of students used questionnaires written in English and which presented no special issue according to TIMSS. We used data from five English-speaking countries (Australia, England, Ireland, Singapore, and the United States) to investigate the factor structure and to prevent translation effects. The average mathematics achievement of students in these countries was significantly higher than that of the average eighth graders. Appendix 2 shows the average mathematics achievement of students in each country, taken from the TIMSS 2019 international results (Mullis et al., 2020). In addition, Appendix 3 shows the percentage of eighth-grade students who answered the questionnaire in English within the five English-speaking countries that we selected.
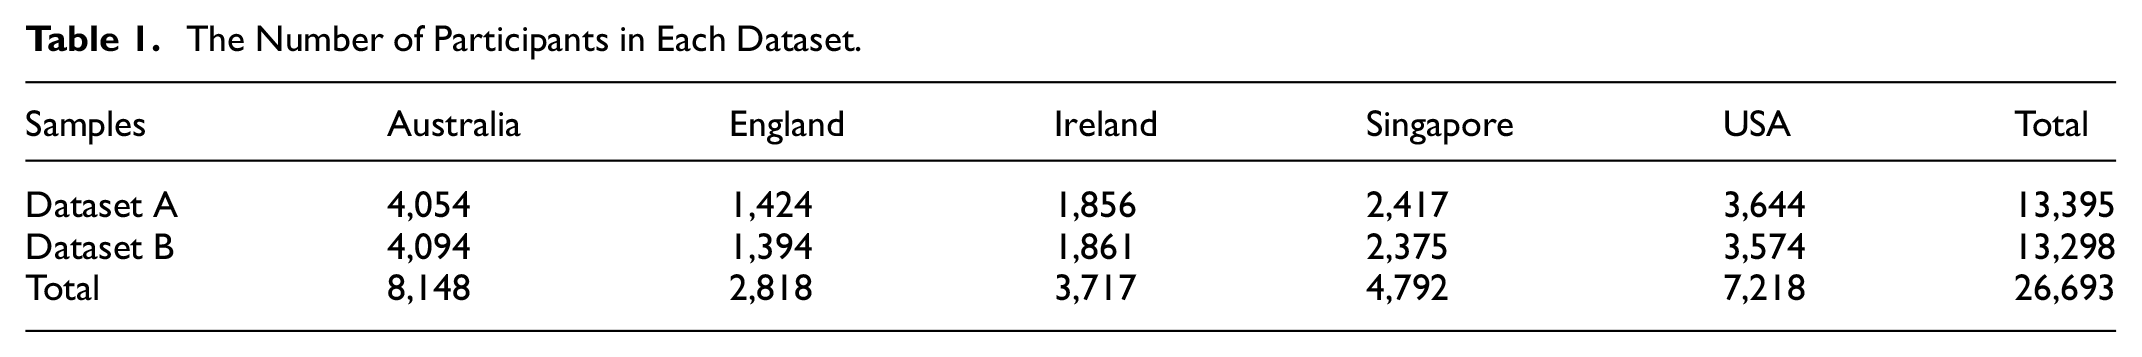
This study randomly divided the entire dataset from five countries into two samples, one for exploratory factor analysis (EFA) and the other for confirmatory factor analysis (CFA), following the approach used in other studies (Guo et al., 2022; Vaculíková et al., 2022; Willmer et al., 2019) based on Hair et al., (2006). The total number of samples, excluding missing values, was 26,693. The number of participants in Dataset A for EFA was 13,395, and Dataset B included 13,298 participants for CFA. Table 1 shows the number of samples from the five countries in each dataset.
The Number of Participants in Each Dataset.
Data Cleaning
TIMSS 2019 divided the SAM scale into three factors: interest (Item 16), confidence (Item 19), and value recognition (Item 20). Each attitude toward learning mathematics scale comprised nine items. All 27 items were rated on a four-point Likert scale (1 = “Agree a lot”, 2 = “Agree a little”, 3 = “Disagree a little”, 4 = “Disagree a lot”). Items with a positive connotation were reverse-coded to enable natural interpretations. We used listwise deletion for missing data, and no outliers were detected.
Analysis
We used principal component analysis (PCA) and principal axis factoring (PAF) in extraction methods EFA to reduce items to smaller subsets containing as much valuable information from the initial items as possible (Nunnally & Bernstein, 1994). EFA is conducted when the researcher does not know how many factors are necessary to explain the interrelationships among a set of indicators or items (Gorsuch, 1983; Pedhazur & Schmelkin, 1991; Tabachnick & Fidell, 2001). In this study, we attempted to re-explore the factor structure under the assumption that we do not know exactly how many factors there are. In PCA, we did not use rotation results when the factor rotation was not converged, or the factor matrix was not generated. We used multiple methods to determine the appropriate number of factors using a scree plot, the percentage of variance, and parallel analysis to evaluate whether the factor structure was achieved for these five English-speaking countries as intended by the IEA. The principal axis factoring (PAF) extraction method was also applied to investigate all 27 items regarding the factor structures of the three subscales for the SAM scale. A factor loading of 0.40 was used as a cut-off value (Hair et al., 2006), and the statistical software package used for the analyses was SPSS version 28.
Next, CFA was performed to find a suitable factor structure based on both the TIMSS 2019 technical report and the EFA results using SAS 9.4. CFA is used to assess the extent to which the hypothesized underlying structure of the construct under investigation fits the data (Nunnally & Bernstein, 1994; Pedhazur & Schmelkin, 1991). So we verified whether the assumed factor structure fits the data well. The estimation method was the maximum likelihood with Satorra-Bentler adjustments, as our datasets were not normally distributed (Satorra & Bentler, 1994).
The R package lavaan (based on R version 4.1.2) was used for multiple-group confirmatory factor analysis (MGCFA; Rosseel, 2012). MGCFA is an analytical method that verifies measurement invariance by checking whether the factor structure is the same across groups. Measurement invariance refers to whether an instrument, such as a questionnaire or items, is interpreted in the same way across different groups (F. F. Chen, 2008; Davidov et al., 2014; Horn & McArdle, 1992; Millsap, 2011). Once measurement invariance has been established, comparisons between scores or values are considered valid. The robust maximum likelihood (MLR) method was used as an estimation method because it has been demonstrated to be the most suitable method for non-normal data in previous simulations (Hirsch et al., 2018; Lei & Wu, 2015; Wurster, 2022). Various model-fit indices were computed, and the χ2/df ratio was utilized as a badness-of-fit index, as smaller values indicate a better fit (West et al., 2015). Constraints were controlled in the model parameters to evaluate the degree of invariance in the measurement model of the SAM scale in the MGCFA model. MGCFA was conducted to analyze metric and scalar invariance across groups with a configural invariant factor structure (Ding et al., 2022).
Results
Assumption Checks
Table 2 indicates the descriptive statistics for the 27 items of the SAM scale in Dataset A for EFA. The Shapiro-Wilk normality test is an appropriate method for small sample sizes (n < 50), although it can also handle large samples, while the Kolmogorov-Smirnov normality test is used for n ≥ 50. For both tests, the null hypothesis states that data are taken from a normally distributed population. We performed both the Shapiro-Wilk and Kolmogorov-Smirnov tests to check the normality assumption. All datasets for the five countries had non-normality. Bartlett’s test of sphericity for the 27 items was significant (p < .001). The Kaiser-Meyer-Olkin (KMO) test statistics ranged from 0.955 to 0.960 and the anti-image values for individual measures of sampling adequacy (MSA) ranged from 0.878 to 0.981. These statistics indicated that our data were suitable for performing factor analysis (see Table 3).
Descriptive Statistics of the SAM Scale (Dataset A).
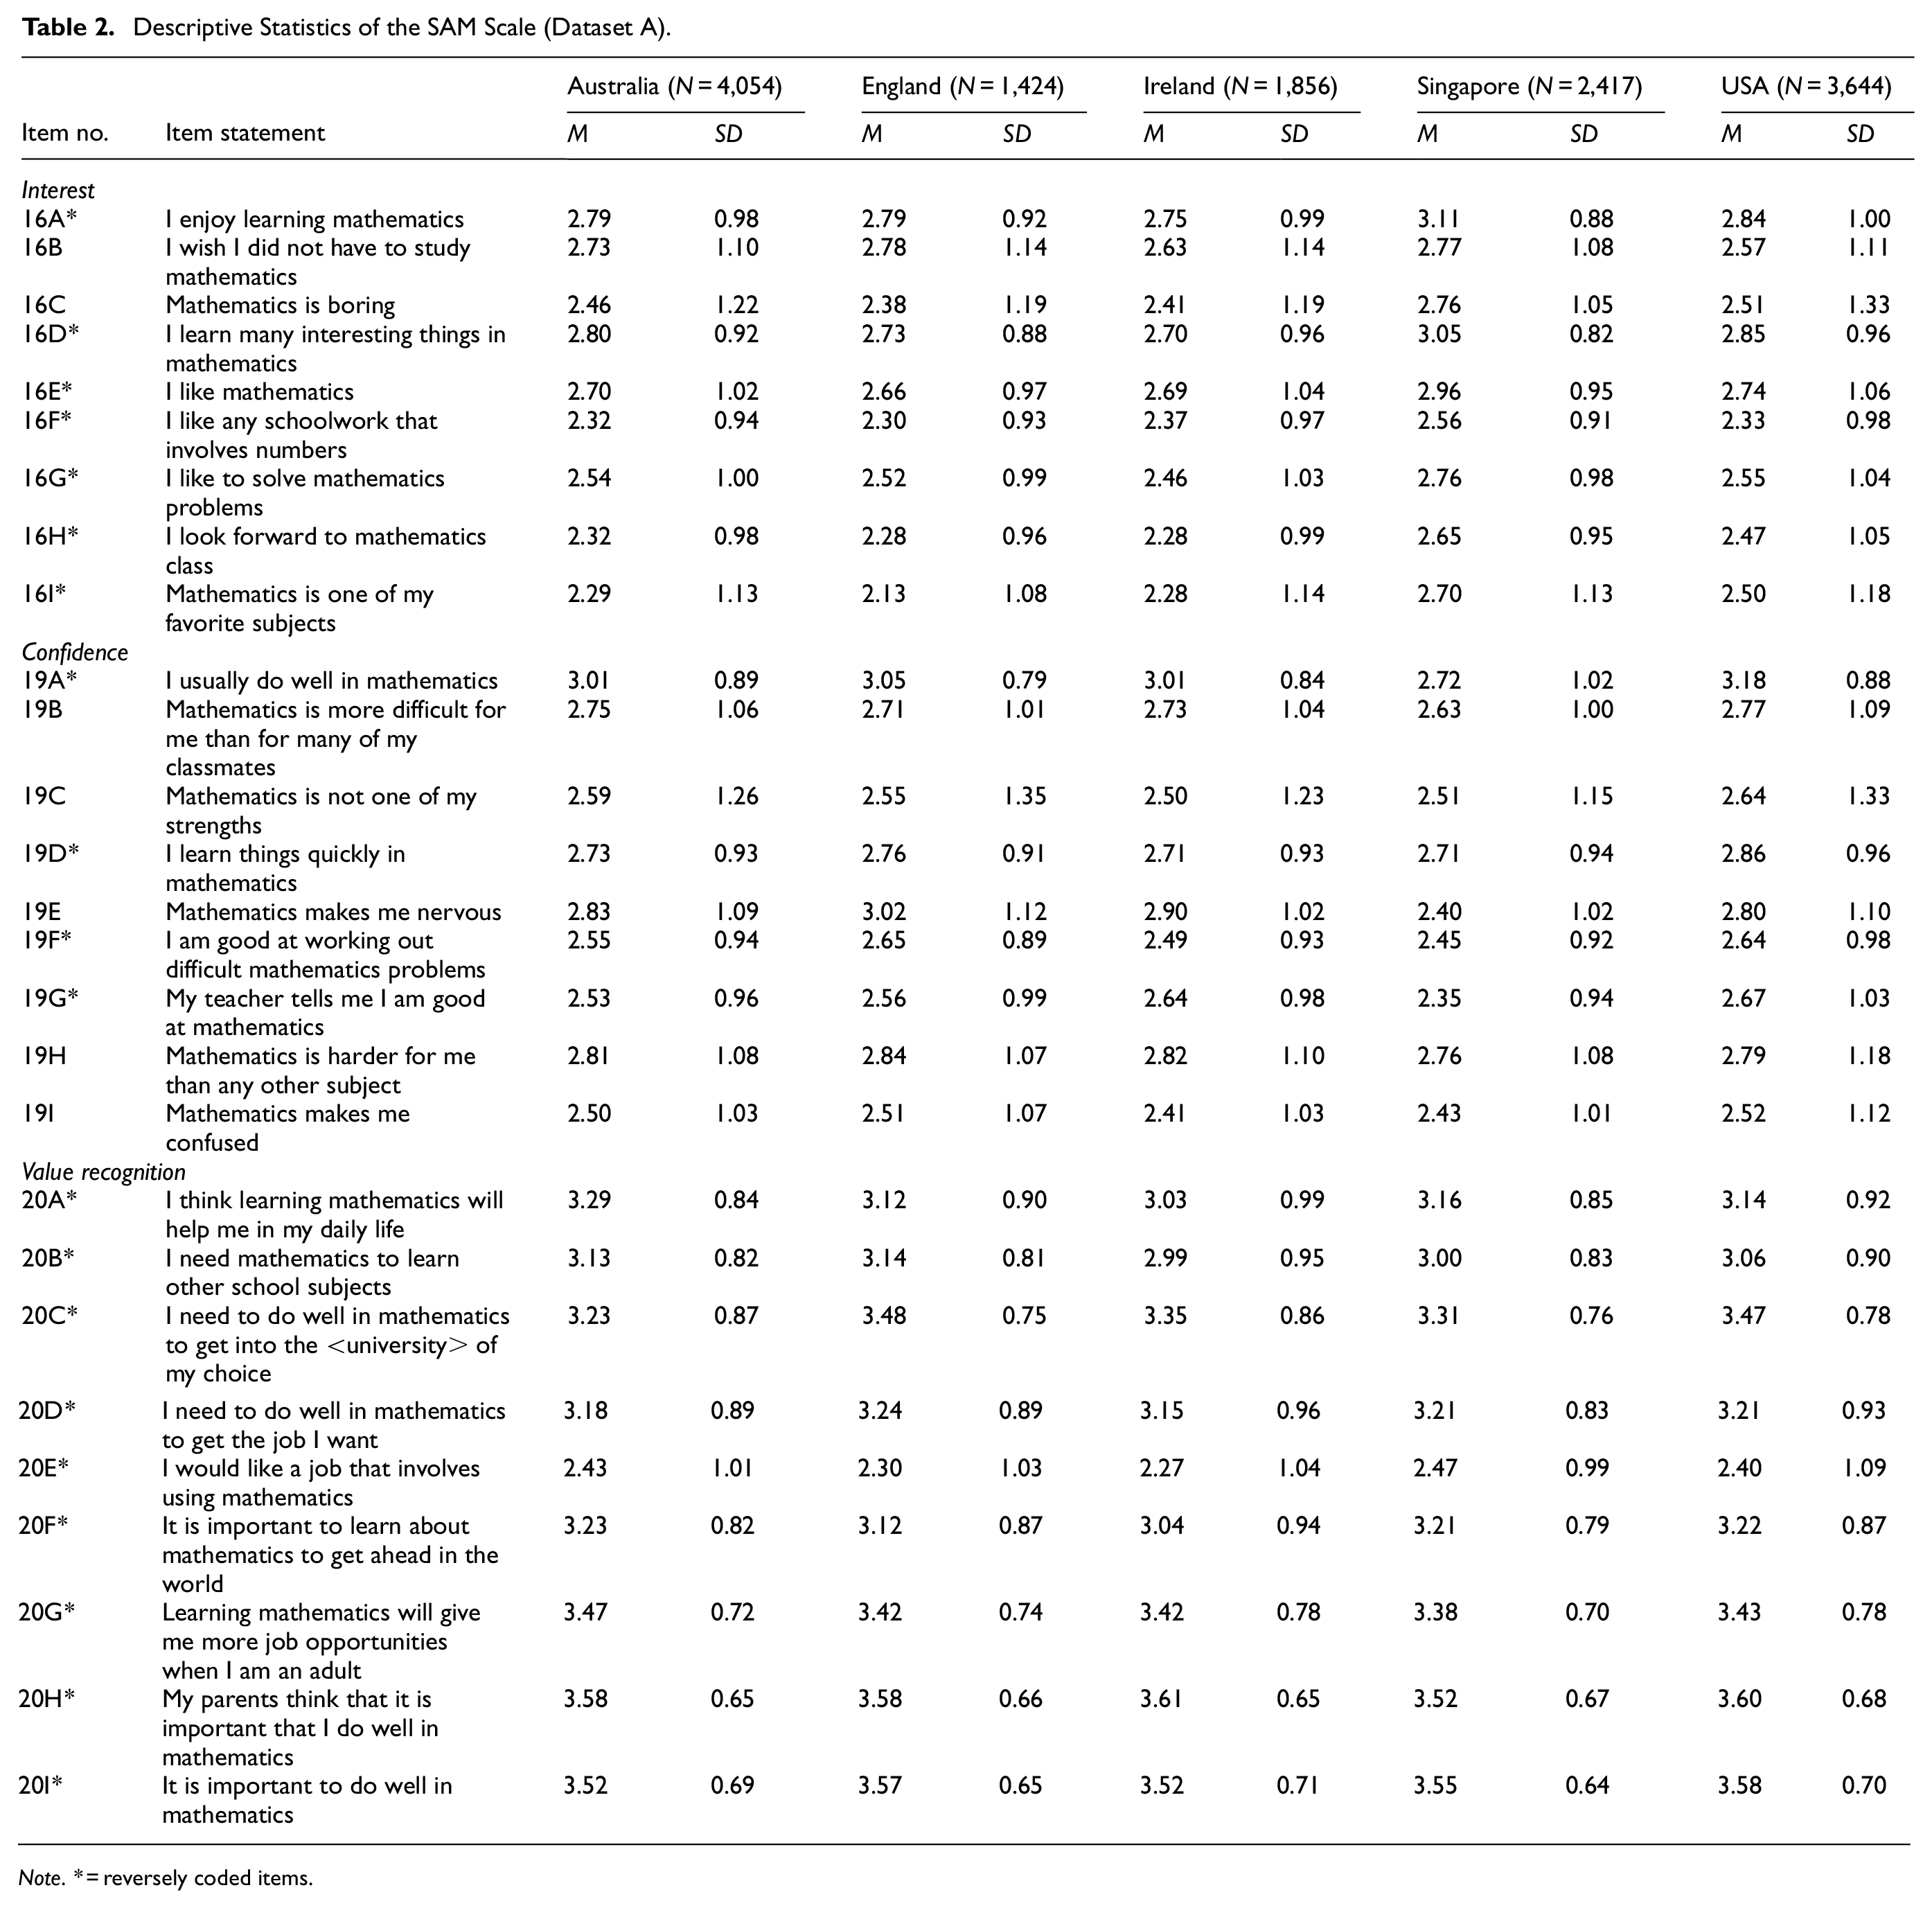
Note. * = reversely coded items.
Bartlett’s Test of Sphericity, KMO, MSA, and Cronbach’s α (Dataset A).

Examining the Validity sing Principal Components Analysis (PCA)
In the technical report, TIMSS 2019 reported that each of the three scales was extracted as a single underlying latent construct when using PCA with no rotation. We performed PCA for each factor separately to compare our PCA results to those in the technical report. However, Table 4 shows that confidence was extracted as a two-factor structure in all five countries with an eigenvalue of >1 and a scree plot, and 19E (“Mathematics makes me nervous”) and 19G (“My teacher tells me I am good at mathematics”) were double-loading items on the Confidence factor for all countries. In contrast, according to the data from Singapore, a two-factor structure with an eigenvalue of >1 was extracted from the “Confidence” items and the “Value recognition” items, and three items (20A (“I think learning mathematics will help me in my daily life”), 20E (“I would like a job that involves using mathematics”), and 20H (“My parents think that it is important that I do well in mathematics”)) were double-loaded.
Number of Extracted Factors (Dataset A, PCA).

Note. Extraction method: 1 = parallel analysis, 2 = eigenvalue > 1, 3 = scree plot, 4 = total variance explained by first factor (%).
Double-loaded with 19E item and 19G item.
Double-loaded with 20A item, 20E item, and 20H.
Examining the Validity Using Principal Axis Factoring (PAF)
Table 5 shows communalities from the PAF analysis using all 27 items, and the communalities of four items were below 0.4 for all five countries: 16C (“Mathematics is boring”), 19E (“Mathematics makes me nervous”), 19G (“My teacher tells me I am good at mathematics”), and 20H (“My parents think that it is important that I do well in mathematics”) (see Table 5).
Communalities (Dataset A, PAF).

Note.* = reversely coded item; bold = communalities less than 0.4.
Also, the communality value of three items was below 0.4 for one country: 16B (“I wish I did not have to study mathematics”), 19C (“Mathematics is not one of my strengths”), and 20B (“I need mathematics to learn other school subjects”). The oblique factor rotation using the direct oblimin method was applied as the factor correlations ranged from 0.116 to 0.644, and the factor correlations between interest and confidence and those between interest and value recognition were high for all five countries (see Table 6).
Correlations Between Factors (Dataset A, PAF).

Note. F1 = interest; F2 = confidence; F3 = value recognition.
Three factors were extracted in all five countries based on scree plots, parallel analysis, and total variance explained by factors, regardless of the TIMSS 2019 technical report. However, two items (19G (“My teacher tells me I am good at mathematics”) and 20E (“I would like a job that involves using mathematics”)) did not fit the scale TIMSS intended in more than four countries even though translation effects were controlled (see Table 7). Also, most of the loading values of these items were below 0.4. Moreover, three items (19F (“I am good at working out difficult mathematics problems”), 19G (“My teacher tells me I am good at mathematics”), and 20E (“I would like a job that involves using mathematics”)) were assigned incorrectly to another factor, and the incorrectly assigned loading values of the three items (19F, 19G, and 20E) were above 0.40 in Singapore. Appendix 4 includes the structure factor matrix for all five countries for more information.
Pattern Matrix of Factor Loadings (Dataset A, PAF).

Note. F1 = interest; F2 = confidence; F3 = value recognition; * = reversely coded items; bold = factor loadings > .4;
Examining Validity Using Confirmatory Factor Analysis (CFA)
Table 8 indicates the descriptive statistics for the 27 items of the SAM scale for Dataset B (see Table 8).
Descriptive Statistics of the SAM Scale (Dataset B).

Note. * = reversely coded items.
We performed four different CFA models to find the best-fitted model for our data. Because the values of average variance extracted (AVE) and composite reliability (CR) were all greater than 0.9, they were suitable for CFA (Bagozzi & Yi, 1988; Fornell & Larcker, 1981). Model A was based on the TIMSS 2019 technical report and comprised a three-factor structure using all items. Model B was composed of a single-factor structure using all items, as researchers have often used these items as one factor in their studies. Model C was based on the EFA results; two items (19G and 20E) were deleted, and the model consisted of a three-factor structure. Lastly, Model D applied only to the data from Singapore based on EFA results because only Singapore had a different factor structure from the EFA results. Three items (19F (“I am good at working out difficult mathematics problems”), 19G (“My teacher tells me I am good at mathematics”), and 20E (“I would like a job that involves using mathematics”)) were moved from each original scale to interest without deleting items.
Table 9 presents that no models were suitable for the chi-square statistics for the measurement model normalized by degrees of freedom (χ2/df), but the values of Model C were the smallest among all models (see Table 9). Based on the three model fit indices used to find the suitable model fit (Root Mean Square Error of Approximation (RMSEA), Standardized Root Mean Square Residual (SRMR), and Comparative Fit Index (CFI)), Model C was the best-fitted model for our dataset from 0.050 to 0.059, which is under to the typical 0.08 cutoff according to Hu and Bentler (1999). The CFI values of Model C ranged from 0.888 to 0.917, which is close to the typical 0.900 cutoff used by Bentler (1990). Therefore, we found that Model A based on the factor structure suggested by the TIMSS 2019 technical report was not bad, but Model C, based on the factor structure of the EFA results that deleted two items (19G and 20E), fitted better than Model A. These results are meaningful in that they show the survey’s effectiveness. Also, it was found that measuring the three-factor structure consisting of interest, confidence, and value recognition was desirable because of the poor fit of Model B, which was a one-factor structure. Finally, Model D only applied to Singapore’s data based on the among all four CFA models. The RMSEA values of Model C ranged from 0.063 to 0.066, which is a fair fit (based on 0.05–0.08 as suggested by MacCallum et al. (1996), and the SRMR values of Model C ranged EFA results, which were moved from each original scale to the interest scale without deleting items (19F, 19G, and 20E), has a bad fit and Model C had a better fit than Model D. Thus, it was confirmed that Model C was better than Model D for Singapore.
CFA Model Comparisons by the Model Fit Indices (Dataset B).
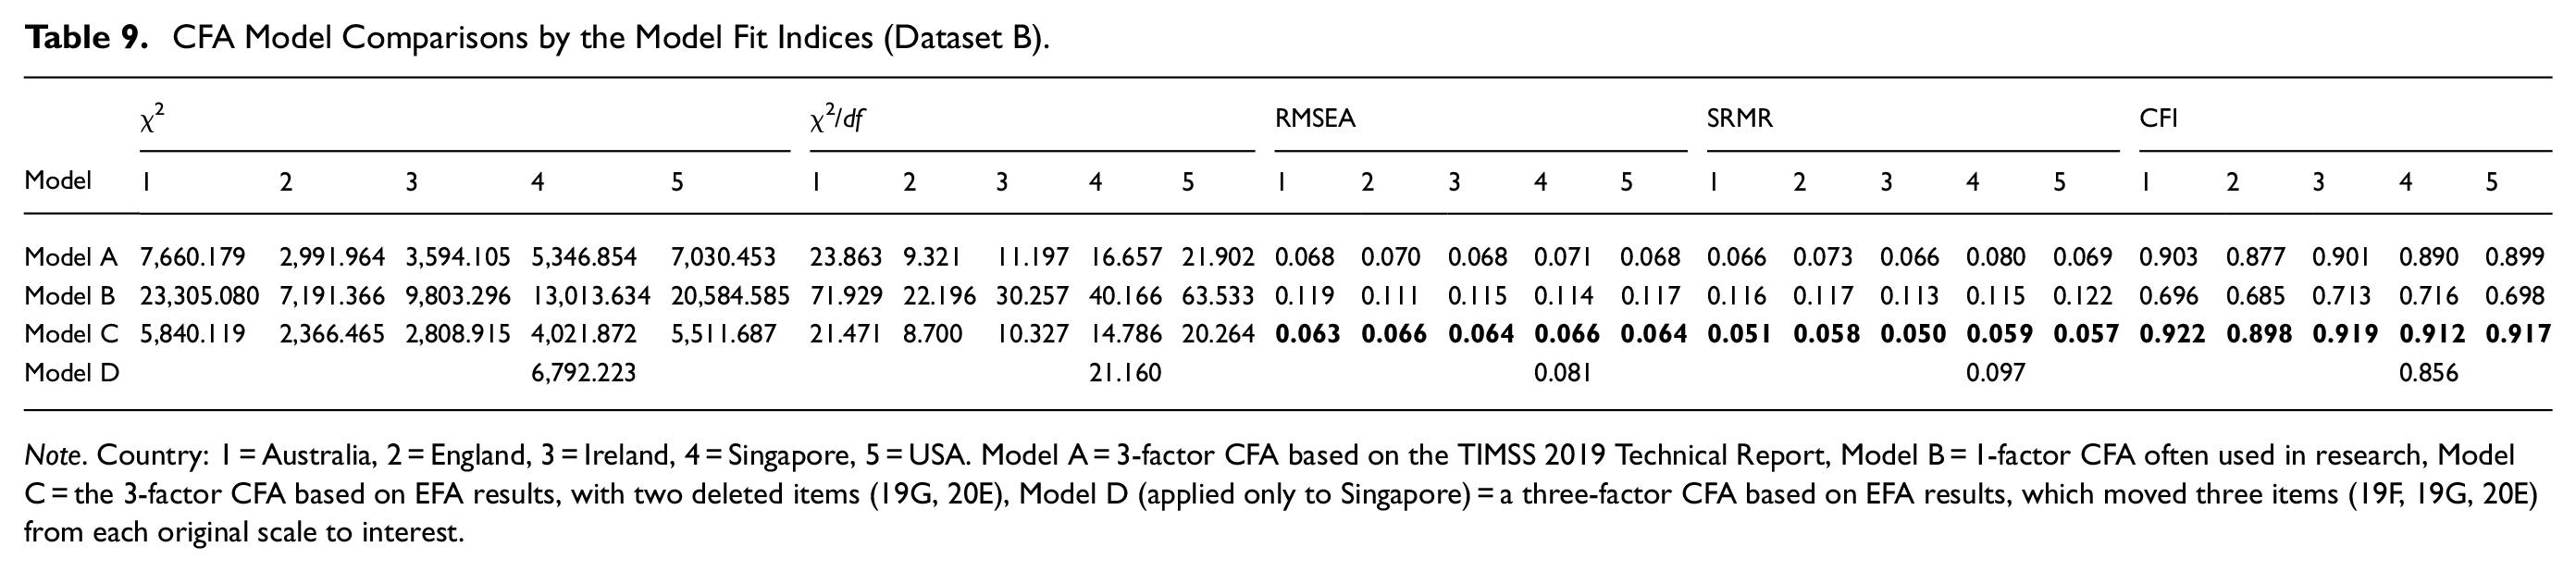
Note. Country: 1 = Australia, 2 = England, 3 = Ireland, 4 = Singapore, 5 = USA. Model A = 3-factor CFA based on the TIMSS 2019 Technical Report, Model B = 1-factor CFA often used in research, Model C = the 3-factor CFA based on EFA results, with two deleted items (19G, 20E), Model D (applied only to Singapore) = a three-factor CFA based on EFA results, which moved three items (19F, 19G, 20E) from each original scale to interest.
Measurement Invariance Tests Across Five Countries Using Multiple Group Confirmatory Factor Analysis (MGCFA)
MGCFA was performed on Models A and C according to the CFA results. The model fit values of Model C were better than Model A, but both models did not have poor statistical values. Plus, Model A was proposed by TIMSS which designed the survey, and Model C was based on the EFA results. Therefore, both models were analyzed using MGCFA to test the measurement invariance among the five English-speaking countries with the same language conditions. These models used different datasets of observed variables (Model A consists of 27 items, and Model C consists of 25 items), so each dataset was analyzed separately and performed in the same steps. Table 10 presents the models’ fit statistics and comparisons (see Table 10).
Model Fit Indices of MGCFA for the Measurement Invariance of the SAM scale (Dataset B).

Note. Configural: the same items belong to the same construct/metric: equal factor loadings/scalar: equal factor loading and equal intercepts.*= CFI>.9.
We performed a chi-square test to evaluate whether the model fits the data. However, the multiple model-fit indices must be examined because chi-square tests are substantially affected by the sample size (Bollen, 1989; Cheung & Rensvold, 2002; Meade et al., 2008; Svetina et al., 2020). Even though the chi-square test results point to incorrect specifications in all models, widely-used fit indices, namely CFI, RMSEA, and SRMR, revealed better results in all invariance conditions. As a result, RMSEA and SRMR values were less than .080. CFI yielded values ranging from 0.876 to 0.910, which is close to the typical 0.900 cutoff.
Two invariance conditions in Model C (configural and metric) were larger than the CFI of 0.90. The values of ΔRMSEA in all invariance conditions ranged from −0.002 to 0.001, those of ΔSRMR ranged from −0.004 to −0.002, and those of ΔCFI ranged from 0.002 to −.011. Rutkowski and Svetina (2014) proposed cutoff values for ΔRMSEA and ΔCFI of 0.03 and 0.02, respectively, to achieve metric invariance in large numbers of groups. They also advised against using SRMR in isolation (Ding et al., 2022). The values we obtained are below the cut-off scores suggested by Rutkowski and Svetina (2014). Therefore, we conclude that both models showed measurement invariance among the five English-speaking countries. This means the three-factor structure consisting of three subscales (interest, confidence, and value recognition) was the same among countries under the same condition (language). However, the CFI values of Model A for the MGCFA ranged from 0.876 to 0.889, and the CFI value of the metric invariance of Model C was 0.907. Therefore, from these CFI values, it can be inferred that the metric invariance of Model C based on the EFA results was fitted better than all models of Model A. Thus, it was confirmed that Model C has better measurement invariance than Model A.
Discussion
This study investigated the validity and measurement invariance of the SAM scale from TIMSS 2019 for five English-speaking countries. TIMSS 2019 reported that the validity of the SAM scale for all data was achieved using PCA. However, the measuring tool in international comparative research, such as TIMSS or PISA, has translation effects. This phenomenon threatens the validity of comparative studies between countries. Many researchers have investigated the translation effects caused by different languages using differential item functioning (DIF), MGCFA, and factor analyses (Asil & Gelbal, 2012; El Masri & Andrich, 2020; Gökçe et al., 2021; Oliveri & Ercikan, 2011). Asil and Gelbal (2012) proclaimed that increasing the number of DIF items was caused by linguistic and cultural differences. Gökçe et al. (2021) suggested that research results using TIMSS data should reflect culture, language, curriculum, or other differences. Therefore, this study selected five English-speaking countries as samples to prevent or control translation effects and investigated the validity of the SAM scale.
TIMSS is the widely used data for conducting international comparative research. Checking the validity of measuring tools considering these data characteristics would be a more valuable way to improve the usefulness and accuracy of the scale, rather than discussing data from a few countries of interest or simply combing all the data without considering the diversity among countries. This study investigated the validity of five English-speaking countries from this point of view, providing two meaningful results to be discussed.
Consideration of Two Items for Improving the Accuracy of Measurement
According to the results, two items (19G (“My teacher tells me I am good at mathematics”) and 20E (“I would like a job that involves using mathematics”)) out of 27 were not appropriate for the SAM scale when using EFA methods controlling for translation effects. The communalities and the loading values of item 19G in the factor TIMSS intended were below 0.40 among all countries. Looking at the meaning of item 19G, the statement, “My teacher tells me I am good at mathematics,” refers to a teacher’s opinion rather than the student’s thoughts. Reynolds et al. (2022) also discussed that the measurement invariance was unsatisfactory with item 19G. Furthermore, the loading values of item 20E were below 0.40 in the factor intended by TIMSS in four countries, and the loading value of this item was above 0.40 in interest factor only in Singapore. Looking at the meaning of item 20E, the statement, “I would like a job that involves using mathematics,” is closer to interest than value recognition, and there may be different interpretations due to the cultural differences between Singapore and the four Western countries based on the results of Singapore.
Moreover, it was confirmed that the model based on EFA results with the two items deleted fitted better than the others with CFA results. Also, Model C based on EFA results fitted better than Model A suggested by TIMSS, when using the MGCFA method for measurement invariance testing. Thus, we concluded that it is better to delete or revise the two items (19G and 20E) to improve the measurement accuracy.
The Different Results for the Three Items Only in Singapore
The other significant result is that three items (19F (“I am good at working out difficult mathematics problems”), 19G (“My teacher tells me I am good at mathematics”), and 20E (“I would like a job that involves using mathematics”)) were assigned incorrectly to another factor, and the incorrectly assigned loading values of these three items (19F, 19G, and 20E) were above 0.40 in interest factor only in Singapore, even though it was linguistically the same condition as the other four countries. This is presumed to result from cultural differences for the same reason as mentioned above. Although Singapore is a multilingual country, all Singaporean students completed the questionnaire in English. In contrast, 2% of Irish students used questionnaires written in a second language (See Appendix 3). Thus, we could not conclude that the characteristics were due to differences between multilingual and English-speaking countries, even if the ratio was small. The meaning of the items could be interpreted differently depending on country-specific cultural factors rather than on reading ability, even if the items were written in the same language. Directly comparing the results from different countries poses limitations, as pointed out by Schmitt and Allik (2005) and Lindwall et al. (2012). Therefore, future research should investigate results that reflect differences according to cultural background.
Conclusion
Many researchers have used non-cognitive scales in TIMSS to study students’ learning attitudes and the relationship between achievement and attitudes in mathematics and science. However, few studies have been conducted to confirm validity measures, such as the items themselves, factor structure, and measurement invariance. Measurement invariance is especially important for analyzing cohort trends in longitudinal and large-scale educational studies (Wurster, 2022). Therefore, it is meaningful to investigate the validity and factor structure of the SAM scales because it has been modified, deleted, and added to over the decades.
This study is significant for testing the validity of survey tools under the same conditions, such as language or culture, before comparing data among various countries in international comparative research. The SAM scale is widely used by many researchers and countries globally; thus, it is meaningful because it provides researchers with a perspective on how to use and deal with the scale before using the data to conduct cross-country comparative studies.
However, this research is limited because it was conducted only in English-speaking countries. It would be good to conduct a validity study more deeply by finding and reflecting certain similar conditions, such as other languages or cultures among the researched countries. In addition, further research using a dataset from Singapore is needed to examine why different results were produced despite the same language conditions to determine whether the results were due to a different culture. Finally, as the result of the statistical analysis cannot be said to reflect all the contexts of the survey, a follow-up study is needed to further secure the validity of the scales by reflecting the analysis of content experts.
Footnotes
Appendix
Structure Matrix of Factor Loadings (Dataset A, PAF).

| Australia |
England |
Ireland |
Singapore |
USA |
|||||||||||
|---|---|---|---|---|---|---|---|---|---|---|---|---|---|---|---|
| 1 | 2 | 3 | 1 | 2 | 3 | 1 | 2 | 3 | 1 | 2 | 3 | 1 | 2 | 3 | |
| 16A* |
|
|
|
|
|
0.37 |
|
|
|
|
|
0.37 |
|
|
|
| 16B |
|
|
|
|
|
0.36 |
|
|
|
|
|
0.31 |
|
|
0.29 |
| 16C |
|
|
0.36 |
|
|
0.30 |
|
|
0.35 |
|
|
0.29 |
|
|
0.27 |
| 16D* |
|
0.35 |
|
|
0.29 | 0.39 |
|
0.39 |
|
|
0.32 |
|
|
0.33 |
|
| 16E* |
|
|
|
|
|
0.38 |
|
|
|
|
|
0.37 |
|
|
|
| 16F* |
|
|
|
|
|
0.30 |
|
|
|
|
|
0.33 |
|
|
0.37 |
| 16G* |
|
|
|
|
|
0.35 |
|
|
0.39 |
|
|
0.36 |
|
|
|
| 16H* |
|
|
|
|
0.39 | 0.33 |
|
|
0.35 |
|
|
0.34 |
|
|
0.39 |
| 16I* |
|
|
|
|
|
0.33 |
|
|
0.36 |
|
|
0.34 |
|
|
0.36 |
| 19A* |
|
|
0.36 |
|
|
0.31 |
|
|
0.31 |
|
|
0.26 |
|
|
0.34 |
| 19B | 0.39 |
|
0.18 | 0.36 |
|
0.11 |
|
|
0.17 |
|
|
0.11 |
|
|
0.14 |
| 19C |
|
|
0.27 |
|
|
0.22 |
|
|
0.23 |
|
|
0.18 |
|
|
0.20 |
| 19D* |
|
|
0.36 |
|
|
0.27 |
|
|
0.31 |
|
|
0.29 |
|
|
0.33 |
| 19E | 0.31 |
|
0.10 | 0.26 |
|
0.07 | 0.32 |
|
0.07 | 0.32 |
|
0.05 | 0.32 |
|
0.06 |
| 19F* |
|
|
0.36 |
|
|
0.27 |
|
|
0.31 |
|
|
0.27 |
|
|
0.34 |
| 19G* |
|
|
0.31 |
|
0.29 | 0.25 |
|
|
0.28 |
|
|
0.25 |
|
|
0.32 |
| 19H |
|
|
0.22 |
|
|
0.15 |
|
|
0.20 |
|
|
0.14 |
|
|
0.16 |
| 19I |
|
|
0.23 |
|
|
0.16 |
|
|
0.24 |
|
|
0.15 |
|
|
0.14 |
| 20A* |
|
0.21 | 0.70 |
|
0.13 |
|
|
0.20 |
|
|
0.17 |
|
|
0.17 |
|
| 20B* |
|
0.18 | 0.67 |
|
0.12 |
|
|
0.18 |
|
|
0.08 |
|
|
0.15 |
|
| 20C* | 0.37 | 0.22 | 0.75 | 0.22 | 0.09 |
|
0.29 | 0.16 |
|
0.31 | 0.13 |
|
0.29 | 0.13 |
|
| 20D* | 0.37 | 0.21 | 0.76 | 0.30 | 0.14 |
|
0.33 | 0.19 |
|
0.32 | 0.11 |
|
0.35 | 0.14 |
|
| 20E* |
|
|
0.60 |
|
0.37 |
|
|
|
|
|
|
|
|
0.34 |
|
| 20F* |
|
0.22 | 0.79 |
|
0.15 |
|
|
0.21 |
|
|
0.12 |
|
|
0.15 |
|
| 20G* | 0.36 | 0.19 | 0.79 | 0.32 | 0.13 |
|
0.34 | 0.19 |
|
0.31 | 0.08 |
|
0.33 | 0.14 |
|
| 20H* | 0.26 | 0.16 | 0.58 | 0.19 | 0.11 |
|
0.22 | 0.13 |
|
0.17 | 0.05 |
|
0.22 | 0.10 |
|
| 20I* |
|
0.22 | 0.77 | 0.32 | 0.15 |
|
|
0.22 |
|
0.35 | 0.14 |
|
0.36 | 0.17 |
|
Note. * = reversely coded item, bold = factor loadings > 0.4.
Author Note
This work is developed from the paper presented at the annual meeting of the American Educational Research Association, Chicago, IL, United States.
Author Contributions
Writing—original draft—Hun Won Choi.
Writing—review & editing—Youn-Jeng Choi.
Funding
The author(s) received no financial support for the research, authorship, and/or publication of this article.
Declaration of Conflicting Interests
The author(s) declared no potential conflicts of interest with respect to the research, authorship, and/or publication of this article.