
Abstract
Considering students’ voices and perspectives is indispensable in educational contexts. Therefore, instruments of measurement that are reliable and valid and can be used easily without complications are needed in schools. The Perceptions of Inclusion Questionnaire (PIQ) is a short instrument used to assess three central dimensions of inclusion, namely emotional and social inclusion and academic self-concept. Previous evaluations indicate in general high psychometric properties. This study aimed to evaluate the construct validity of the three scales of the PIQ’s student version using different approaches in two samples from primary (grade 4, N = 721) and secondary (grade 7, N = 393) schools. The results of confirmatory factorial analyses confirmed the PIQ’s three factors in both samples which are also measurement equivalent across grades. Plausible correlations with additional divergent and convergent scales reveal that the PIQ measures the theoretically assumed constructs—emotional and social inclusion as well as academic self-concept—validly.
Keywords
Introduction
In the context of inclusive education, the socio-emotional outcomes of students can help assess the quality of inclusion. However, due to its heterogeneous and latent characteristics, students’ social and emotional development is challenging for their teachers to diagnose. Teachers are faced with the responsibility of deducing their students’ inner states from external indicators. Therefore, individuals’ self-perceptions and self-assessments are considered reliable sources of information, as each person knows their inner states best (Eid, 2018). Researchers have also strongly emphasized the importance of taking students’ perspectives into account (Bourke & Mentis, 2013; de Leeuw et al., 2018; Giangreco et al., 2001). Promoting students’ voices seems to be meaningful, as past research has already indicated that students’ perspectives vary considerably from those of significant others like parents or teachers (Kunter & Baumert, 2006). Scanning through research in the field of inclusive education (Schwab, 2020), the question seems to arise: what outcomes should be considered in measuring the quality of inclusive education. While attitudes toward inclusion of all relevant stakeholders (e.g., students, parents, and teachers) have widely been in the focus of research for about two decades (cf. review by de Vroey et al., 2016), other socio-emotional outcomes of students have gained increased attention in recent years.
In this line of thought, there is a need for measurement instruments to assess students’ perception of emotional and social inclusion in school. As this is relevant not only for research but also for the evaluation of teaching, and school development, the instruments should be economical, easy to use and to evaluate, and preferably free of charge. Considering an inclusive education, where one encounters students’ broad heterogeneity, an instrument is needed that works with all students, despite their diversity. Additionally, it should adhere to high psychometric standards. One such instrument is the Perceptions of Inclusion Questionnaire (PIQ; Venetz, et al., 2015). The PIQ is intended for students from the third to ninth grades of different school types. The results of previous studies on the PIQ indicate in general to high psychometric properties (DeVries et al., 2018; Zurbriggen, et al., 2019). The development of the PIQ’s precursor version by Venetz et al. (2014) included an initial evaluation of the construct validity based on two samples of students from primary school grades four to six. However, a comprehensive evaluation of the construct validity of the current PIQ student version in a new sample is still pending, especially with a sample from secondary school. This is particularly significant because the school systems in the German-speaking countries Austria, Germany, and Switzerland are challenged by their segregational structure. In primary schools, all students are generally taught together, whereas, in secondary schools, students often visit classes according to their academic performance. Secondary schools differentiate not regarding the students’ academic performances but also their behavior, emotions, and social inclusion (e.g., Trautwein et al., 2006). An instrument that works equally in primary and secondary school settings is needed.
Therefore, this study aimed to evaluate the construct validity of the three scales of the PIQ’s student version, using different approaches with two samples with different age groups from primary and secondary schools. First and foremost, an overview of the development of the PIQ and its psychometric properties shall be provided.
The Perceptions of Inclusion Questionnaire: History and Development
The student version of the PIQ is originally based on the German self-report Questionnaire for Assessing Dimensions of Integration of Students (FDI 4-6; Haeberlin et al., 1989). The development of the FDI dates back to the initial period of a large research program investigating the effects of inclusion versus separation (called INTSEP), which was continued for over 25 years (Bless, 1995; Eckhart et al., 2011; Kronig et al., 2000). The FDI was developed to assess the student’s perspective on being included in school. Based on reference group theories (Kelley, 1968; Sherif & Sherif, 1969) and theoretical considerations on school inclusion, the authors derived three dimensions particularly relevant for the students’ subjective perception of inclusion in school, namely, emotional inclusion (i.e., emotional well-being in school), social inclusion (i.e., social relationship with peers in the classroom), and performance-motivated inclusion (i.e., self-perception of academic competences). In a multistep test construction procedure, many items were generated and empirically tested according to the state-of-the-art of that time (for more details see Haeberlin et al., 1989). Finally, 15 items per dimension were selected, resulting in a questionnaire with a total of 45 items. The theoretically sound and highly reliable FDI has been used in several other studies in the German-speaking areas (Schwab, et al., 2013; Sauer et al., 2007; Venetz et al., 2012).
Due to its length and the partly outdated wording, Venetz et al. (2014) developed a short version of the FDI, with considerations for gender-appropriateness and simplified item formulation. This makes it applicable to students with different linguistic or cognitive competencies from grade three. This FDI short version corresponds in part to the PIQ, or more precisely to the German PIQ student version. Further, the student version was extended by one version to assess teachers’ perspectives of students’ inclusion in school, and one version to assess parents’ or primary caregivers’ perspectives (Venetz et al., 2015). Each PIQ version consists of three scales with four items each rated on a 4-point Likert scale.
Approaches to Evaluate Test Validity
The usage of a measurement instrument and the interpretation of the information gained through it require a valid and theory-driven instrument. Though assumptions about the instrument are initially made, this needs to be proven in advance (Kane, 2013). For instance, the intention and which theoretical construct the test reflects or how it relates to other latent variables have to be clearly defined in advance. Therefore, the definition should include references to the internal structure of the theoretical construct, out of which clues about divergent or convergent validity can be derived (Campbell & Fiske, 1959; Wehner et al., 2020).
To ensure high measurement accuracy and quality, different approaches can be chosen. Besides the assessment of the instruments’ structure using confirmatory factor analysis, one of the most common approaches is the examination of construct validity, referring to correlations between other (content-related) measures and outcome variables (Cronbach & Meehl, 1955). Correlations between variables that intend to measure the same construct should be preferably high (>.5; Ziegler, 2020) and thus indicate convergent validity, whereas variables that intend to measure different constructs should correlate minimally or not at all to prove that no other (related) construct is being measured to some extent (discriminant validity; Campbell & Fiske, 1959). Therefore, constructs that are related to the construct being examined should be chosen for discriminant validity analyses (Ziegler, 2020). According to Cronbach and Meehl (1955), another strategy to prove construct validation is the examination of construct differences between groups. It is assumed that constructs differ between distinct groups. For instance, depressive people state lower values on a “good-mood-scale” than non-depressive people (Eid & Schmidt, 2014). These assumptions can be tested directly to validate the construct. To make meaningful and adequate interpretations from the group differences, the underlying scales need to be measurement invariant. The implication is that they have to measure the same construct in the same way in the different groups to avoid inaccurate inferences (Borsboom, 2006; Chen, 2008) especially in cases of test adaptation (e.g., adaptations for other populations or translations into different languages).
Previous Validation of the Perceptions of Inclusion Questionnaire
The development of the FDI short scales by Venetz et al. (2014) included a first evaluation of the internal consistencies and the construct validity of the scales based on the sample of Venetz et al. (2012) which contains N = 782 Swiss students from grades 4 to 6. The structural validity of the short scales was also tested in the original dataset of Haeberlin et al. (1989). Venetz et al. (2014) confirmed construct validity for the two scales of emotional inclusion and social inclusion. As expected, the scale performance-motivated inclusion showed only a low positive correlation with the Scales for the Assessment of Learning and Performance Goals (SELLMO; Spinath et al., 2002). However, it shows a high positive correlation with the subscale absolute self-concept from the Scales for the Assessment of Academic Self-concept (SESSKO; Schöne et al., 2002), as well as moderately positive correlations with academic achievement in German (teaching language) and mathematics (a summary of the results in the English language was provided in the supplementary materials available in Zurbriggen et al., 2019). Thus, as the scale performance-motivated inclusion related only marginally to performance motivation and covered primarily the academic self-concept, it was renamed accordingly.
Further evidence for the construct validity of the PIQ was provided by DeVries et al. (2018) with N = 407 sixth and seventh graders from Germany. The three PIQ scales correlated significantly as expected with the five scales of the Strengths and Difficulties Questionnaire (SDQ; Goodman, 1997), with the exceptions for emotional inclusion with peer problems and social inclusion with hyperactivity.
The PIQ student version was also examined by means of the Graded Response Model (GRM), which is an Item Response Theory (IRT) model for analyzing Likert-type items (Zurbriggen et al., 2019). The results of N = 823 fourth through sixth graders showed that the items functioned fairly well, in particular in the lower ranges of the scales and that Differential Item Functioning (DIF) for students with learning difficulties versus without learning difficulties was either absent or negligible. Again, the internal consistencies of the three scales of the PIQ student version proved to be reliable (as in the previous studies). As students with learning disabilities (LD) are a frequently investigated group in the research on inclusion, the PIQ was also tested for structural validity and measurement equivalence for students with formally diagnosed LD in different educational settings (i.e., students in special and inclusive classes; Knickenberg et al., 2019). Results confirmed again the factorial validity of the PIQ. Further analyses revealed a methodological factor, which suggested that students with LD struggle with negatively formulated items.
The convergent validity of the PIQ student version with the two other PIQ versions was examined through the correlated trait-correlated method minus one [CT-C(M − 1)] model (Eid et al., 2003). The findings showed low consistencies between self-reports and teachers’ reports for both emotional and social inclusion, and slightly higher consistencies for academic self-concept (Venetz et al., 2019). The same applied to the parent version (Schwab et al., 2020). The low convergent validity between students’ self-report and other reports (teacher and parents) underlines the importance of including the student’s perspective.
The Present Study
The overview of previous studies showed that the PIQ student version adheres generally to high psychometric properties. The development of the PIQ’s precursor version by Venetz et al. (2014) included a first evaluation of the construct validity. Their results provided the first evidence of content validity of the three scales based on two samples of students from grades four to six from primary schools. However, a comprehensive evaluation of the construct validity of the current PIQ student version in a new sample is yet to be done, particularly in a sample from secondary school. Based on theoretical assumptions, the scale “performance-motivated inclusion” was renamed “academic self-concept,” and this also needs to be empirically supported. Thus, this study aims to validate the PIQ’s student version using different approaches in two samples of different age groups from primary and secondary schools, since the PIQ is recommended for students from third to ninth grade.
First of all, the PIQ’s three-factorial structure and the reliabilities for each subscale will be examined for two samples from primary (fourth grade) and secondary (seventh grade) schools. Due to the potential use of the questionnaire in different types of schools, the PIQ will be tested for measurement invariance across grades thereafter.
For plausible reasons, it is expected that the subscale “emotional inclusion” relates positively to students’ positive activation in school, and negatively to their negative activation, their emotional problems, their intention to quit school, and their feelings of loneliness. Moreover, it is assumed that social inclusion correlates positively with prosocial behavior, social integration in the classroom, and sociometric ratings gained by peer nominations, and negatively with problems among peers and feelings of loneliness. To prove the validity of the academic self-concept subscale, substantial positive relations with two different measures of self-concept (absolute and academic) are anticipated that are higher than the relations with the global self-esteem and students’ grades in Mathematics and German.
The analyses conclude with the examination of group differences across gender and grades to prove a differentiated measurement of emotional and social inclusion, as well as academic self-concept in different sub-populations.
Method
Samples and Study Design
The first sample is based on Attitudes Toward Inclusive Schooling—Students, Teachers, and Parents (ATIS-STEP; Study 1; this study was financially supported by the Styrian government [Austria; grant number: ABT08-247083/2015-34], e.g., Schwab, 2018a). In total, 48 primary school classes from rural, urban, and suburban areas in Styria (a federal state in Austria) participated. A total of N = 721 fourth graders (9–11 years, 50.5% boys) from inclusive classes with at least one student with an official diagnosis of special educational needs (SEN) participated in the survey. The parents’ written consent for participation in the study was obtained beforehand, and the research was approved by the Styrian Regional School Authority. The questionnaires were administered in paper-and-pencil format. During the assessments, two assistants monitored all students and assisted those having difficulties filling out the questionnaires during regular classes in school. It took about 50 minutes to complete a questionnaire.
The second sample was taken from Attitudes Toward Inclusion of Students with disabilities related to Social Inclusion (ATIS-SI; Study 2) where 25 secondary classes (regular and inclusive) from rural, urban, and suburban areas in Styria participated. In total, N = 393 seventh graders (12–14 years; 49.1% male) participated. In the sample, 8.4% (n = 34) had a diagnosed special educational need.
PIQ Student Version (PIQ-S)
In the current study, the German version of the PIQ-S was used. The questionnaire comprises three scales with four items each. Students were asked to provide information on their emotional inclusion (e.g., “I like going to school”; for the wording of all 12 items, see www.piqinfo.ch), their social inclusion (e.g., “I have very good relationships with any classmates”), and their academic self-concept (e.g., “I do well in my schoolwork”) on a 4-point Likert-scale (0 = not at all true, 1 = rather not true, 2 = somewhat true, and 3 = certainly true).
Measures for Validation
In Study 1, emotional experiences in school were operationalized using the PANA-short scales (Schallberger, 2005) based on the Circumplex model of affect (Watson & Tellegen, 1985). According to this model, emotional experiences are described along two dimensions: positive and negative activation. Each dimension was measured with four items each. The students were asked how they experienced school lessons in general. On a 7-point bipolar scale, they indicated whether they felt, for instance, rather listless or rather highly motivated (positive activation) or rather carefree or worried (negative activation; for descriptive information see Table 1). The short scales show good psychometric properties and high construct validity (Schallberger, 2005).
Means, Standard Deviations, Reliability Coefficients, and Correlations in Study 1.
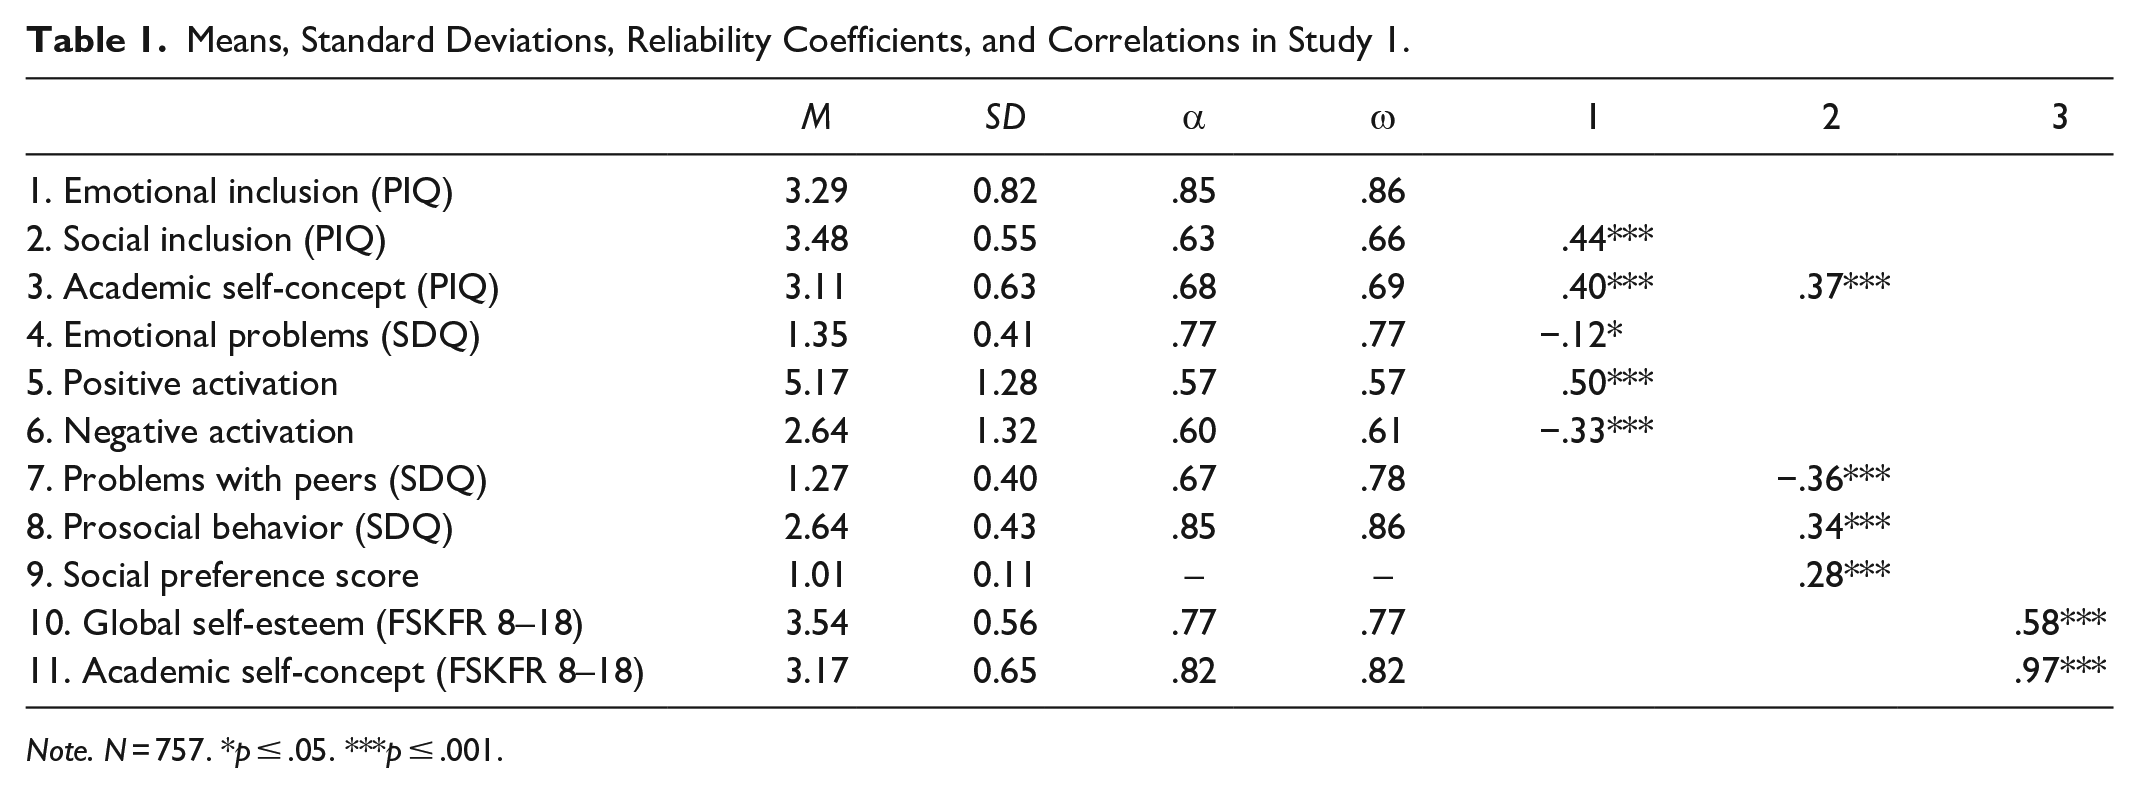
Note. N = 757. *p ≤ .05. ***p ≤ .001.
Students’ prosocial behavior, emotional problems, and problems with peers were measured with three subscales (out of five) of the SDQ (Goodman, 1997). The SDQ’s self-report version has already been proven extensively for its validity, reliability, and measurement invariance (Goodman, 2001; Kersten et al., 2016). Each subscale is operationalized with five items each. On a 3-point Likert scale ranging between “not true” and “certainly true,” students rate to what extent they “usually share things with others (food, games, pens, etc.)” (prosocial behavior), “worry a lot” (emotional problems) or “get on better with adults than with people [their] own age” (problems with peers).
For measuring students’ academic self-concept and their global self-esteem, two subscales (out of eight) of the FSKFR 8 to 18 (questionnaire for measuring multiple facets of self-concept of students at special schools and from regular school types; Weber & Freund, 2016) were used. The FSKFR 8 to 18 assesses various facets of students’ self-concept and holds for invariance across gender and school type, as well as special educational needs in the field of learning. The global self-esteem scale consists of four items (e.g., “I like myself the way I am”; Baudson et al., 2016), the academic self-concept scale contains five items (e.g., “I am good at school”; Baudson et al., 2016). Both scales are measured on a 4-point-Likert scale. Since the items of the FSKFR 8 to 18 assessing the academic self-concept are based, inter alia, on the already mentioned FDI 4 to 6 (Haeberlin et al., 1989), the wordings in the PIQ academic self-concept subscale resemble partially those in the FSKFR 8 to 18.
As an indicator of students’ social inclusion in class, a socio-metric rating scale was used. Specifically, students were asked to name peers in the class with whom they spent their school breaks. Each student got a list with peers’ names on it and rated whether he or she spent his or her break “never,” “seldom,” “sometimes,” “often,” or “always” with this peer. Based on these peer nominations, a social preference score was calculated for each student (Coie & Dodge, 1988). High values indicate social integration, whereas low scores suggest social rejection of the student. In Study 1, the score ranges between 1.06 and 1.35.
In Study 2, the SDQ’s subscales “emotional problems” and “problems with peers,” as well as the peer nominations (“social preference score,” ranging from 0.03 to 1.32 in the second study) were also used (for descriptive information see Table 2).
Means, Standard Deviations, Reliability Coefficients, and Correlations in Study 2.

Note. N = 329.
School grades are recoded (high values indicate better academic performance).
p ≤ .001. Gray values are not significant.
The scale “Intention to Quit school early (ITQ)” assesses through three items out of a scale of nine items by Pijl et al. (2014) whether and to what extent the students consider quitting school prematurely (e.g., “I often think about quitting school as soon as possible”). Ratings can vary on a 5-point Likert scale between “never” and “ever.” The three items were already translated into German and showed acceptable reliability (α = .78; Schwab, 2018b).
To assess loneliness, the four items of the Illinois Loneliness and Social Satisfaction Scale (ILSS; Asher, Hymel, & Renshaw, 1984) were used. All four items (e.g., “I have no one to talk to in my class”) have been answered on a 5-point Likert scale. Good psychometric quality for the German version of the short-scale was already shown by Schwab (2015).
Students’ social integration in the classroom was assessed through six items (e.g., “I get along well with the other children in my class”) included in the “Questionnaire on emotional and social school experiences of Elementary School Children” (FEESS; Rauer & Schuck, 2003). Answers could be given on a 4-point Likert scale ranging between “not true at all” and “true.” FEESS is characterized by good psychometric properties (Rauer & Schuck, 2003).
The students’ academic self-concept was measured using the German self-report instrument SESSKO (scales for measuring the academic self-concept; Schöne et al., 2002). In our study, five items, which represent the absolute self-concept, were used (SESSKO includes the individual, the social, as well as the criterial self-concept in addition). Students were asked to indicate on a 5-point Likert scale, for example, whether it is rather easy or rather difficult for them to learn something new in school. Within the scope of different studies, this measurement instrument shows high reliability, both high convergent and divergent validity, as well as good psychometric properties (Dickhäuser et al., 2002; Sparfeldt et al., 2003).
Additionally, their academic achievement was assessed through school grades in German and Mathematics. For the analyses and their plausible interpretations, school grades were recoded so that high values indicate better academic performance and low scores, lower performance.
Statistical Analyses
A confirmatory factor analysis (CFA) was used to confirm the PIQ’s three-factor structure. To evaluate the data’s fit to the CFA, different model fit indices were consulted. Besides χ2 and its associated degrees of freedom (df), several sample-size independent fit indices like the comparative fit index (CFI), the Tucker-Lewis index (TLI), the standardized root-mean-square residual (SRMR), and the root mean square error of approximation (RMSEA) were assessed. CFI and TLI values >.95 indicate an appropriate data fit to the theoretically assumed model. Further, RMSEA and SRMR values <.08 were considered as optimal model fit (Hu & Bentler, 1999). Cronbach’s α and McDonald’s ω were estimated to evaluate the subscales’ reliability.
To examine the PIQ’s construct validity, correlation coefficients were calculated considering additional variables that were also gained by the self-report questionnaires within the scope of the study. Since the manifest indicators are treated like categorical variables, the weighted least-square means and variances estimator (WLSMV) was used, which considers the data’s non-normal distribution (Flora & Curran, 2004; Liang & Yang, 2014). The nested data structure and, therefore, the non-independence of the data (students nested in classes) were considered by using the complex-design option in Mplus, which allows a standard errors adjustment. The intraclass correlations coefficient (ICC) for the 12 PIQ items ranged between .02 ≤ ICC ≤ .08 (M = 0.05) in Study 1 and between .01 ≤ ICC ≤ .13 (M = 0.05) in Study 2.
To test mean differences between groups, t-tests were performed. The students’ emotional and social inclusion, as well as their academic self-concept, were entered as dependent variables, and gender and grade as independent variables. As a prerequisite for making meaningful mean comparisons, the PIQ was checked for measurement invariance across groups (gender and grade) in both studies. Only if the PIQ holds for invariance across groups, the same trait is measured across groups and, therefore, group differences reflect true group differences (Brown, 2015). Measurement invariance is checked successively by increasing restrictions in the measurement model (from configural to strong measurement invariance). If the additional restrictions do not lead to a model fit decline, measurement invariance can be assumed.
Analyses were carried out using SPSS 25 and Mplus 8.3 (Muthén & Muthén, 1998–2019).
Results
Factor Structure
The three theoretical factors, namely, “emotional inclusion,” “social inclusion,” and “academic self-concept” were modeled with four indicators. The results of the CFA show an appropriate model fit for a three-factorial solution of the PIQ in Study 1. The model fit indices meet the postulated cut-off values (χ2 = 104.619, df = 51, p ≤ .001; RMSEA = 0.04, CFI = 0.99, TLI = 0.99, SRMR = 0.04). Further, the standardized factor loadings indicate an adequate model fit to the empirical data (emotional inclusion: .71 ≤ λ ≤ .91; social inclusion: .43 ≤ λ ≤ .80; academic self-concept: .48 ≤ λ ≤ .81). The preliminary CFA results confirm a three-factorial structure of the PIQ also for the sample in Study 2. Except for the χ2-test, the fit indices for the three-factorial model indicate an appropriate model fit (χ2 = 84.08, df = 51, p ≤ .01; RMSEA = 0.04, CFI = 0.99, TLI = 0.99, SRMR = 0.04). The standardized factor loadings range between 0.53 and 0.92 (emotional inclusion: .72 ≤ λ ≤ .92; social inclusion: .53 ≤ λ ≤ .90; academic self-concept: .70 ≤ λ ≤ .83). Measurement invariance analyses reveal that the three-factorial structure holds across grades 4 and 7 (partial strong measurement invariance for the samples in Study 1 and Study 2) indicating that the same traits are measured in both groups.
Reliability
In the first study, the PIQ’s dimension emotional inclusion was measured reliably with four items, as indicated by the Cronbach’s α and McDonald’s ω coefficients (α = .85, ω = .86). The reliability indices for the social inclusion and academic self-concept dimensions were not acceptable (social inclusion: α = .63, ω = .66; academic self-concept: α = .68, ω = .69; see Table 1). However, the three factors’ internal consistencies in Study 2 are at an acceptable level (emotional inclusion: α = .87, ω = .87; social inclusion: α = .76, ω = .77; and academic self-concept: α = .78, ω = .79; see Table 2).
Relations to External Criteria
To estimate the correlations between the PIQ’s factors and the measurement instruments used to validate it, all variables were modeled latently in Mplus. The PIQ’s three factors correlate moderately with one another (Study 1: *.37 ≤ r ≤ .44, p ≤ .001; see Table 1; Study 2: .22 ≤ r ≤ .48, p ≤ .001; see Table 2).
According to the assumptions, the variable emotional inclusion in Study 1 correlates substantially with positive activation in school (r = .50, p ≤ .001). At the same time, the negative correlation with negative activation (r = −.33, p ≤ .001) and with emotional problems (r = −.12, p ≤ .05) corresponds to the theoretical expectations. In Study 2, the students’ emotional inclusion relates negatively to their intention to quit school (r = −.72, p ≤ .001), but neither with their emotional problems nor with their feelings of loneliness.
Referring to the assumptions, the students’ social inclusion in Study 1 correlates moderately with their prosocial behavior in school (r = .34, p ≤ .001). Students who perceive themselves as socially included in class report fewer problems with their peers (r = −.36, p ≤ .001). The correlation with the sociometric measurement gained by peer-nominations is also at a medium level (r = .28, p ≤ .001). In Study 2, there are positive correlations between social inclusion and the social preference score (r = .30, p ≤ .001), and social integration in class (r = .93, p ≤ .001). The more the students perceived themselves as socially included in the class, the less they feel lonely (r = −.83, p ≤ .001) or have problems with peers (r = −.70, p ≤ .001).
The results in Study 1 show—as assumed—a coherence between the academic self-concept scale assessed with the PIQ and the global self-esteem scale (r = .58, p ≤ .001), whereas there is a near-perfect correlation with the academic self-concept scale measured by the FSKFR 8 to 18 (r = .97, p ≤ .001). In accordance with the assumption, the academic self-concept in Study 2 relates positively to the students’ grade in German (r = .55, p ≤ .001) and in Mathematics (r = .58, p ≤ .001). It also correlates with the content-related measurement of the absolute academic self-concept (SESSKO) at a very high level (r = .95, p ≤ .001).
Group Differences
To ensure meaningful interpretation of group mean differences, measurement invariance for the three PIQ scales across groups (male vs. female students; students in grade 4 vs. grade 7) was explored. Measurement invariance analyses reveal that the PIQ shows strong measurement equivalence across gender in Study 1 and partially strong measurement for boys and girls in Study 2, as well as partially strong measurement across grades.
Regarding the students’ emotional inclusion in Study 1, a t-test for independent groups reveals gender differences, with girls stating higher values on the emotional inclusion scale than boys (ΔM = 0.38, SE = 0.06; t(642) = 6.42, p ≤ .001). Female and male students differ neither on the perceived social inclusion scale nor on the academic self-concept scale (ps ≥ .05).
In Study 2, girls in grade 7 report, again, higher values on the emotional inclusion scale, compared to the boys (ΔM = 0.31, SE = 0.08; t(386) = 3.89, p ≤ .001). However, boys show significantly higher academic self-concepts than girls (ΔM = 0.14, SE = 0.06; t(390) = 2.23, p = .02). There are no differences regarding their social inclusion.
The results of a final t-test analysis using samples from both Study 1 and Study 2 reveal differences in the students’ perceptions of inclusion, depending on grades. Students in grade 4 perceived themselves more emotionally included than seventh-graders (ΔM = 0.63, SE = 0.05; t(1109) = 12.36, p ≤ .001). Students in primary schools also showed significantly higher academic self-concepts than students in secondary schools (ΔM = 0.19, SE = 0.04; t(1108) = 4.80, p ≤ .001). There are no significant group differences regarding their social inclusion.
Discussion
This study aimed to validate the PIQ’s student version, using different approaches in two samples with different age groups from primary and secondary schools. Confirmatory factorial analyses reveal that the PIQ’s assumed three-factorial structure fits the data from students both in primary (fourth grade) and secondary schools (seventh grade). The PIQ’s subscales correlate substantially with each other (Venetz et al., 2014; Zurbriggen et al., 2019). As the PIQ holds for measurement invariance across grades, the same traits are measured the same way in both groups.
As expected, emotional inclusion relates positively to positive activation at school and negatively to negative activation. The high negative correlation with the intention to quit shows that higher emotional well-being in class is associated with lower intentions to leave school early. Emotional inclusion correlates with students’ emotional problems in grade 4 marginally (which was already shown for seventh graders also by DeVries et al., 2018). However, in this study, in grade 7 there is no relation, which suggests divergent validity. The different pattern might be explained by the fact that students’ emotional well-being in school is decreasing during school times and they might become less sensitive about school in secondary grades as other aspects of life are becoming increasingly important (e.g., spare time). Further, the PIQ’s subscale “emotional inclusion” means inclusion in the class, whereas the SDQ’s subscale refers to emotional problems in general (Goodman, 1997) and this represents, therefore, different but partly similar constructs. Since the loneliness scale reflects a social aspect (referring to relations with peers and not simply to own emotions), the non-existent correlation with emotional inclusion also indicates divergent validity.
As expected, social inclusion relates positively at a medium level to prosocial behavior and—to a smaller extent—to the sociometric status in class gained by peers. This underlines the fact that the assessment of social inclusion in class from the perspectives of individuals and peers corresponds partly, but is mainly divergent (Zurbriggen, 2018). As social integration and social inclusion reflect an overlapping theoretical construct, the correlation between them is almost perfect. The strong negative relationship with feelings of loneliness suggests convergent validity also. In grade 7, problems with peers correlate much higher with social inclusion, compared to grade 4, which might indicate that peers and the social aspect in school, in general, assumes greater importance for students during adolescence (Rubin et al., 2006).
One main objective of this study was to prove the theoretical assumption of the renamed scale “academic self-concept” for validity. Due to the nearly perfect correlations with two self-concept scales (academic and absolute self-concept) indicating convergent validity, the PIQ’s subscale may be definitively taken to reflect academic self-concept, both in grades 4 and 7. Further, the relations with global self-esteem as well as with the students’ grades in Mathematics and German also refer to academic self-concept.
In addition to measurement invariance across grades, (partially) strong measurement equivalence was also confirmed for gender, indicating that differences between groups can be attributed to changes in the measured constructs. Therefore, the PIQ can be applied both in primary and secondary schools to detect differences or even a decrease in the students’ emotional and social inclusion, as well as in their academic self-concept, and to identify potential students at-risk at an early stage. Results reveal differentiated measurements of emotional inclusion and academic self-concept, with female students perceiving themselves as more emotionally included than their male peers, both in primary and secondary schools. The academic self-concept of boys and girls in grade 4 does not differ significantly. It can be assumed that the academic self-concept differs somewhat stronger subject-specifically (Marsh, 1990). Further, research suggests a developing and differentiating academic self-concept in the course of adolescence (Scherrer & Preckel, 2019). Gender differences in grade 7 regarding academic self-concept support this assumption: boys in grade 7 reported higher academic self-concepts than girls. Interestingly, boys and girls in grades 4 and 7 do not differ concerning their perceptions of social inclusion. In fact, social participation depends on other variables not considered in this study. For instance, students from ethnic minorities, students with academic difficulties, or special needs experience a heightened risk of social exclusion (Juvonen et al., 2019).
The results reveal that the PIQ is an appropriate instrument to measure students’ social and emotional inclusion, as well as academic self-concept reliably, validly, and economically at school, and adheres to high psychometric standards.
Limitations, Future Directions, and Conclusion
In the present study, some limitations remain which provide possibilities and directions for future research. Although the validation of the PIQ was a fundamental idea when planning the ATIS-STEP, as well as the ATIS-SI study, the measurement instruments for validation differ within the studies due to practical reasons and the different content-related foci of the two studies. A longitudinal study with parallel validation measures and considering additional control variables would be preferable for further validity studies, to make meaningful interpretations regarding the development of the PIQ’s three dimensions. As a prerequisite, the instruments’ longitudinal measurement invariance needs to be proven, which is currently pending.
Although the reliabilities of the three dimensions’ were good in many other studies focusing on the PIQ (e.g., social inclusion: Cronbach’s α = .83; academic self-concept: Cronbach’s α = .79; Zurbriggen et al., 2019), the reliability indices in Study 1 for the dimensions of social inclusion and academic self-concept were not acceptable. However, it should be considered that the variables were modeled latently in this study and, therefore, have already been adjusted for their measurement errors.
In the present study, data were captured in grades 4 and 7 in Austrian primary and secondary schools. It remains unclear whether the results are transferable to other countries, languages, or cultures. Therefore, replication studies of the German PIQ student version in other settings should be considered. Further, validity studies for different language versions are needed (see, e.g., the validation of the Arabic version; Alnahdi & Schwab, 2020).
In future research, the teacher, and the parent PIQ versions need to be validated to ensure a comprehensive examination of the PIQ. Simultaneously, analyses of validity and measurement invariance for different groups relevant in the school provide many opportunities for future research.
The present study’s results reveal that the PIQ measures the students’ social and emotional inclusion, as well as academic self-concept reliably, validly, and economically. Therefore, the PIQ represents a short, reliable, and valid tool to assess the three central dimensions of inclusion in school, which can be used both in educational settings and research. Especially in the context of inclusive education, using the PIQ might give teachers more in-depth insights into students’ perceptions to, for example, identify at-risk students for interventions or obtain feedback from their students. Besides gaining information about their students, teachers can use the instrument also as a source of information for their own professionalization and quality analysis of their own teaching.
Footnotes
Declaration of Conflicting Interests
The author(s) declared the following potential conflicts of interest with respect to the research, authorship, and/or publication of this article: Two authors of the current manuscript (Carmen Zurbriggen and Susanne Schwab) are also co-authoring the Perceptions of Inclusion Questionnaire.
Funding
The author(s) disclosed receipt of the following financial support for the research, authorship, and/or publication of this article: This study was financially supported by the Syrian Government (Austria; grant number: ABT08-247083/2015-34).