
Abstract
This study examines expenditure and price elasticities for five major travel products, considering tourism satisfaction and traveler characteristics. Using Taiwan Tourism Bureau data (2016–2021) from 20,574 international visitors, the Almost Ideal Demand System (AIDS) model reveals that accommodation and shopping spending are relatively inelastic compared to food, transportation, and other expenses. Tourism satisfaction significantly influences spending, particularly on accommodation, transportation, and shopping. Shorter trips, prior travel experience, and planned travel increase expenditure elasticity. Female and high-income tourists are more responsive in their spending. Education and generation cohorts also impact demand elasticities. Practical implications highlight the need for satisfaction-driven strategies. Policymakers should enhance infrastructure, streamline visa policies, and integrate digital tools like mobile payments to attract diverse tourists and navigate economic uncertainties. Businesses should use differentiated pricing, improve service quality, and leverage digital marketing to appeal to budget and high-income travelers. Stakeholder collaboration can strengthen tourism competitiveness, sustainability, and economic resilience.
Keywords
Introduction
Tourism has been demonstrated to be crucial in enhancing economic growth in many nations. Therefore, attracting a large number of tourists, particularly international tourists, has become a significant element of tourism policies. The World Tourism Organization (UNWTO) reports that the number of international tourist arrivals increased from 972.7 to 1,462.3 million in 2010 to 2019 (UNWTO, 2023). This remarkable growth has made the tourism industry a critical contributor to the economic growth of many countries. The direct contribution of tourism to the global economy increased by 148% from USD 983.5 to USD 1,458.7 billion in 2010 to 2019 (UNWTO, 2023). Unfortunately, the COVID-19 pandemic has significantly impacted the tourism industry globally. According to UNWTO (2023), the number of international tourist arrivals dropped by 70.45% in 2020 to 2021, resulting in 1.03 billion fewer international tourists worldwide compared to 2019. After a steep decline in 2020 to 2021, this figure has recovered by 65.66% (to 960.2 million) in 2022 compared to its peak in 2019. Table 1 illustrates the statistics.
Global and Taiwan Tourism Performance (2010–2022).
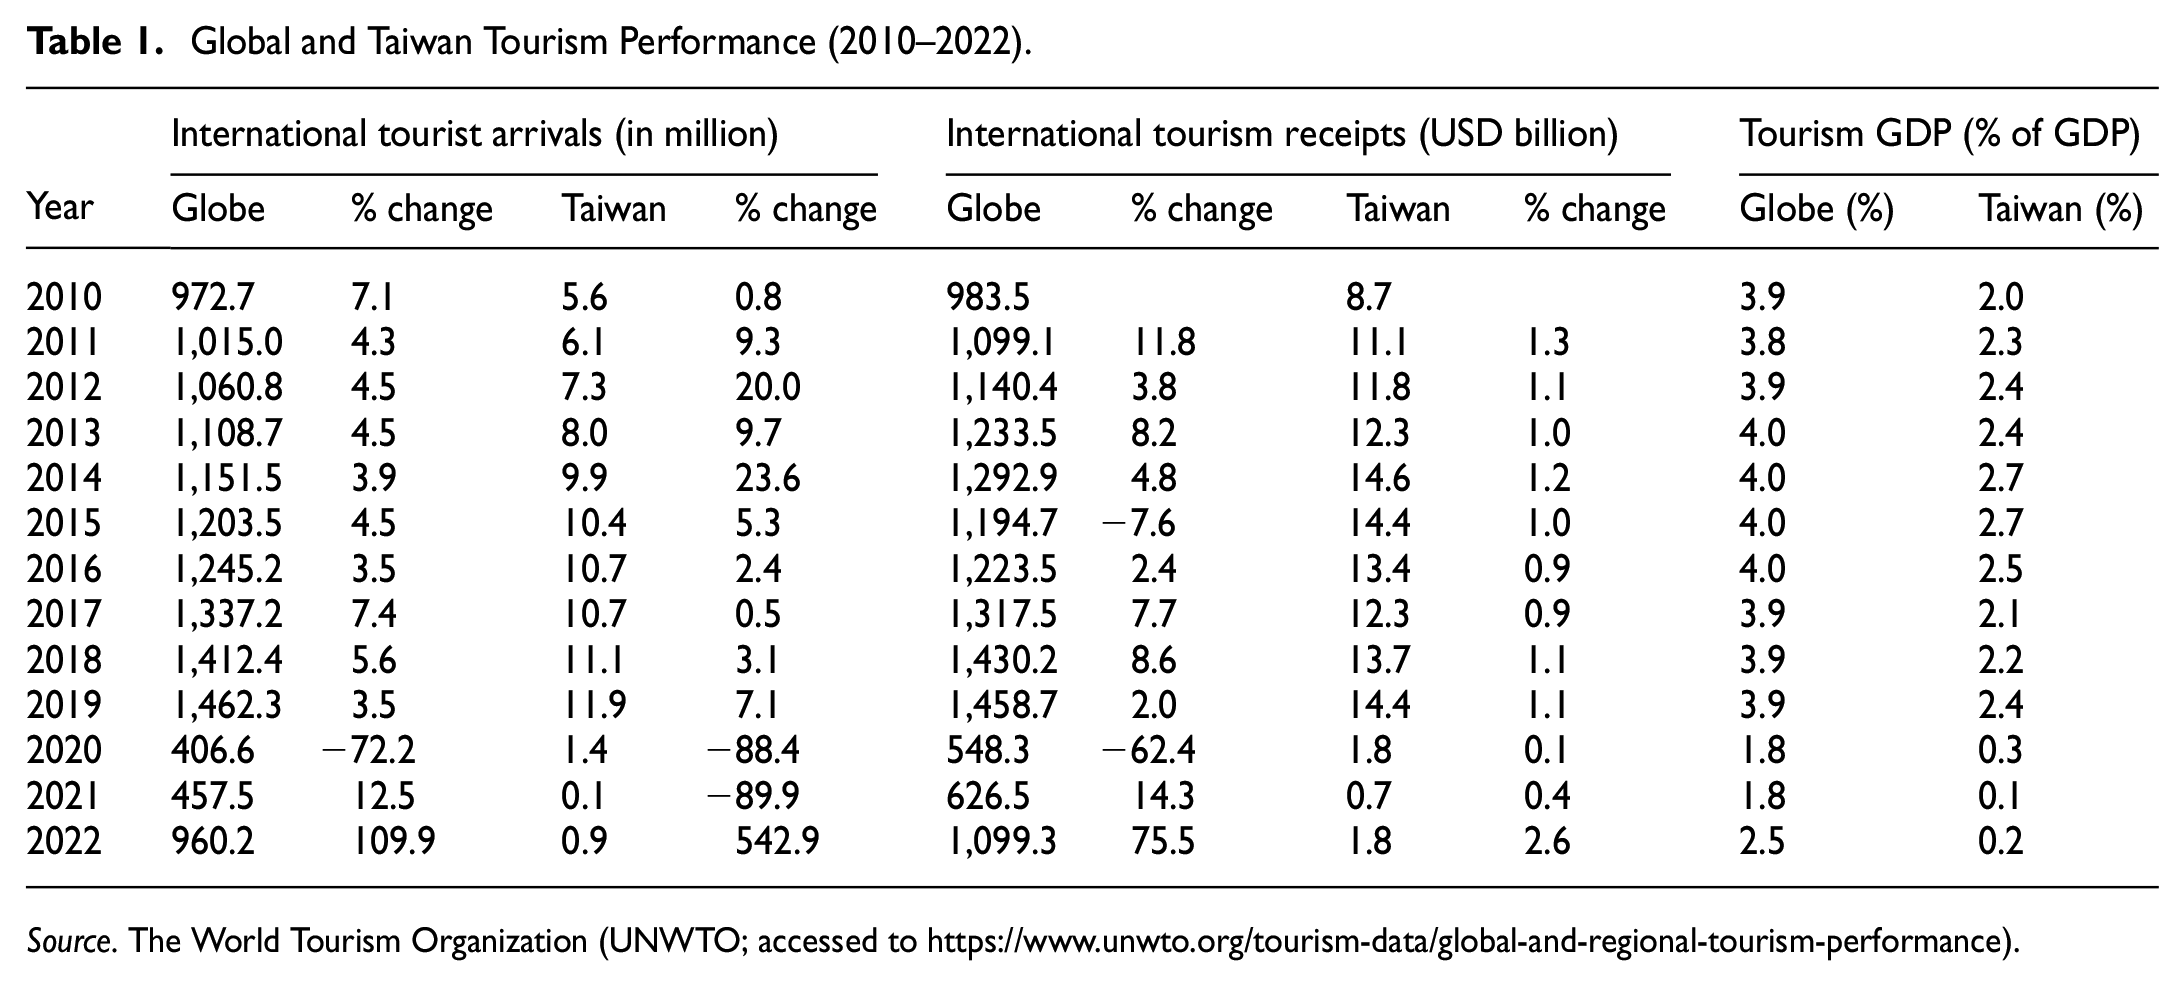
Source. The World Tourism Organization (UNWTO; accessed to https://www.unwto.org/tourism-data/global-and-regional-tourism-performance).
The direct contribution of travel and tourism to global GDP has grown by an average of 3.9% per year over the past decade (2010–2019) and by 2.0% per year on average in 2020 to 2022 (UNWTO, 2023). The travel and tourism industry has been growing steadily, but the COVID-19 pandemic has severely impacted the industry. International travel demand has dropped significantly due to lockdowns and travel restrictions. Small and medium-sized businesses are particularly at risk, with approximately 100 million direct tourism employees in danger (Tan & Soon, 2023). Hence, it is crucial to research tourism demand to develop policies that attract international tourists, especially in the post-COVID-19 pandemic era.
In the Taiwan scenario, Table 1 shows that the number of international tourist arrivals increased from 5.6 to 11.9 million between 2010 and 2019. However, the figure dropped to 0.3 million in 2021 and 0.9 million in 2022 due to the COVID-19 pandemic. The direct contribution of travel and tourism to Taiwan’s economy increased by 165.5% from 2010 to 2019, rising from USD 8.7 to USD 14.4 billion. The direct contribution to Taiwan’s GDP grew by 2.4% annually in the past decade (2010–2019) and 0.2% on average in 2020 to 2022 (UNWTO, 2023). Figure 1 and Appendix 3 demonstrate the number of tourist arrivals in Taiwan from 2010 to 2021, categorized by region. Based on Figure 1, Chinese tourists are the most prominent group who choose Taiwan as their destination, contributing 43.57% per year. Following that, Asian tourists represent 42.88% per year (of which 43.44% is the share of the New Southbound Policy (NSP) countries). The numbers of tourists from other countries (i.e., the Americas, Europe, Oceania, and Africa) are relatively similar, with each region contributing around 6.77% of the total number of international arrivals in Taiwan (UNWTO, 2023).

Visitor arrivals in Taiwan by nationality between 2010 and 2021 (unit: in million).
This study analyzes Taiwan’s tourism demand model from 2016 to 2021 because this period is closely associated with the New Southbound Policy (NSP) initiated in 2016. The NSP aims to strengthen Taiwan’s connections with Southeast Asia, South Asia, Australia, and New Zealand through tourism and cultural initiatives (Huang, 2018; Kironska, 2021; A. H. Yang, 2018; C. C. Yang, 2018; A. H. Yang & Chiang, 2019). The statistical figures indicate that, despite the challenges posed by the COVID-19 pandemic, the NSP significantly increased visitor numbers, especially from ASEAN countries, with 44.26% of tourists coming from these areas by 2019. Additionally, Taiwan’s introduction of visa-free or e-visa access for select NSP countries was crucial in boosting arrivals. In total, from 2016 to 2021, Taiwan welcomed 46.49 million tourists, with 47.67% from Asia (of which 44.26% is the share of NSP countries) and 40.92% from mainland China (excluding Hong Kong and Macau). This study provides insights into the NSP policy’s impact on tourism amid the pandemic, which is essential for developing effective post-pandemic tourism policies that ensure Taiwan’s recovery and growth.
Tourism demand is influenced by a variety of factors, including economic and non-economic factors. Traditional economic theories have identified income, price, substitute price, advertising, and supply constraints as the primary factors affecting tourism demand (Goh, 2012; Law et al., 2019; Wasaya et al., 2023). Recent studies based on conventional economic theories have highlighted that non-economic factors such as psychological, anthropological, and sociological factors also play a significant role in demand variation (T.-S. Chen et al., 2022; Nicolau et al., 2023; Selvanathan et al., 2024; Yeh & Liou, 2024). These include social status, personal interests, cultural background, and geographic features of the destination country.
Travel-related factors (i.e., travel distance, length of stay, travel experience, and planning time) significantly influence tourism demand. Travel distance refers to the geographical span between a tourist’s home and destination. Some studies show a positive correlation between travel distance and tourist expenditure, especially since longer distances typically incur higher transportation costs (García-Sánchez et al., 2013; Lee et al., 2015; Phan et al., 2024). The length of stay refers to the duration of a tourist’s visit to a destination. The impact of length of stay on expenditure remains mixed, with some studies suggesting a positive correlation between the two (Atsız et al., 2022; Ferrer-Rosell et al., 2015; Gemar et al., 2022; Jackman et al., 2020), while others propose a negative correlation (García-Sánchez et al., 2013; Massidda et al., 2022; Park et al., 2020; Smolčić Jurdana & Soldić Frleta, 2017). Travel experience refers to a tourist’s familiarity with a destination or their overall travel history. Repeat visitors spend less (Alegre & Cladera, 2010; Phan et al., 2024), while others indicate a positive correlation (Ferrer-Rosell et al., 2015) or an insignificant one (Y. Ahn et al., 2018; Chang et al., 2013). Planning time refers to the duration between trip planning and the actual travel dates. The previous findings show that tourists with more extended planning periods tend to spend more on their trips, possibly due to advanced bookings and access to discounts (Massidda et al., 2022; Pak, 2020; Park et al., 2020; Phan et al., 2024).
Individual socioeconomic characteristics (i.e., gender, income, age, and education) significantly influence tourism expenditure. Gender represents the social and cultural characteristics of males or females. Some studies suggest that male tourists tend to spend more (Atsız et al., 2022), while others find a positive relationship between female visitors and expenditure elasticity, indicating potential price sensitivity among women (Y.-J. Ahn et al., 2020; Atsız et al., 2022; Phan et al., 2024). Income reflects the monetary earnings of the traveler, consistently correlating positively with tourist expenditure. Higher-income travelers allocate more resources to accommodation, dining, transportation, and leisure activities (Balcilar et al., 2021; Inchausti-Sintes et al., 2021). Age represents chronological age. Some research suggests that older tourists spend more (Jackman et al., 2020; Z. Li et al., 2020), while others have contradictory findings (Aguiló et al., 2017; Orea-Giner & Fusté-Forné, 2023). Education, reflecting the level of formal education attained, higher education levels correlate positively with tourism expenditure (Sahoo et al., 2022).
According to Anderson (2010), travel expenditure is the total amount of money spent by travelers at a particular location. Y.-J. Ahn et al. (2020) and Bernini and Galli (2022) define expenditure elasticity as a crucial concept in tourism demand, which refers to tourists’ spending habits changing due to changes in price or income. A higher expenditure elasticity for a specific factor means tourists are more likely to change their spending in response to changes in that factor. Econometrics investigates causal relationships between tourist expenditure and other factors in related studies (Y.-J. Ahn et al., 2020; Balcilar et al., 2021; Jayasooriya & Bandara, 2024; Rosselló-Nadal & He, 2020; Selvanathan et al., 2024).
According to D’Urso et al. (2020) and Bernini and Galli (2022), tourist satisfaction measures how well their expectations during travel are met and significantly influences positive feedback and repeat visits. Dissatisfied visitors spend less and provide negative feedback, while satisfied tourists spend more, revisit, and recommend the destination to others (Nicolau et al., 2023; Skare et al., 2023; Smolčić Jurdana & Soldić Frleta, 2017). Despite substantial progress, critical gaps remain in the tourism demand literature. First, while satisfaction is recognized as a determinant of spending behavior, its moderating role in expenditure elasticity models—such as the Almost Ideal Demand System (AIDS)—remains underexplored. Satisfaction impacts not only immediate spending but also long-term outcomes, such as repeat visits and destination loyalty (Nicolau et al., 2023; Skare et al., 2023). The integration of satisfaction into elasticity models is vital for understanding its broader economic implications. Second, limited studies examine how travel-specific factors (like travel distance, planning time, and trip experience) interact with socioeconomic variables (like gender, income, and education) to influence elasticity across expenditure categories (Y. Ahn et al., 2018; Bernini & Galli, 2022). Past studies, such as Ferrer-Rosell et al. (2015) and Phan et al. (2024), highlight differences in spending patterns among demographic groups but do not delve into these dynamics within a comprehensive demand elasticity framework. The evolving preferences of generational cohorts—such as Gen Z’s sensitivity to value-oriented travel or Gen X’s preference for personalized services—offer untapped opportunities for segment-specific strategies (Lin et al., 2023). Third, from a methodological perspective, existing literature predominantly employs static models to assess tourism demand, often neglecting the nuanced, dynamic effects of satisfaction and travel-related factors (Nicolau et al., 2023; Yeh & Liou, 2024). We argue that it is crucial to address these shortcomings for a more informed understanding of tourism demand dynamics.
This study first aims to estimate expenditure and price elasticities for key tourism categories, including accommodation, food, transportation, shopping, and miscellaneous expenses. Second, this study examines the moderating role of satisfaction in shaping demand elasticity by integrating psychological and behavioral factors into traditional economic models. Additionally, the study analyzes the combined effects of travel-related and socioeconomic factors on expenditure elasticities, providing a holistic understanding of tourist behavior. Finally, this study delivers actionable insights for post-pandemic recovery, enabling businesses to optimize pricing strategies and service delivery while assisting policymakers in designing effective tourism policies.
This study expects to add academic contributions significantly to the field by integrating tourist satisfaction with the AIDS model. We analyze how factors like trip length, distance, and booking behavior influence price and expenditure elasticity, addressing a gap in the literature. Additionally, we explore the impact of income, education, and demographics on price and expenditure elasticity, enhancing our understanding of consumer behavior in tourism. We improve the accuracy of demand models in tourism economics by introducing new moderating variables. The practical implications of our findings are also noteworthy. Businesses can optimize pricing strategies based on satisfaction-driven price sensitivity to maximize revenue and build customer loyalty. Understanding how different tourist segments respond to price changes enables targeted marketing efforts. This study also expects to add practical contributions that help policymakers develop strategies for sustainable tourism by demonstrating how satisfaction can promote the demand of international tourists. Our findings assist businesses in creating services that cater to both premium and budget-conscious tourists, and policymakers can design initiatives that promote economic growth while maintaining visitor satisfaction. The study is structured into several sections. Section 2 comprises the literature review and hypothesis formulation. Section 3 includes Data and Methodology, which overviews the observation sample, variables, empirical models, and methods. Section 4 presents the empirical results. Section 5 consists of the discussion and implications. Finally, Section 6 presents conclusions, limitations, and future research.
Literature Review
Antecedent Theories of Tourism Demand
In almost all of the tourism demand antecedents, tourism demand is often analyzed using traditional economic theories (i.e., utility theory and consumption behavioral theory; Law et al., 2019; Song et al., 2023; Wasaya et al., 2023). These theories suggest that economic factors such as income, price, substitute price, advertising, and supply constraints are the primary factors affecting demand. In recent times, non-economic factors (i.e., psychological, anthropological, and sociological factors) have been used to analyze tourism demand studies. In addition, economic theory determines tourism demand based on its association with the source market, and tourism demand can be affected by push, pull, and resistance determinants. Pull factors, such as the quality of natural resources and diplomatic relations, attract visitors (Meleddu & Pulina, 2016). While push factors include entertainment time, income, consumer attitude, and mood (Martins et al., 2017). On the other hand, resistance aspects are the barriers that limit travel to the destination, such as administrative procedures and consumer prices (Poprawe, 2015; Saha & Yap, 2015).
Many tourism literature investigations show that economic and non-economic factors are significant antecedents that affect expenditure behavior. However, the existing literature has a significant gap in showing how these factors impact the elasticity of tourism expenditure. This is particularly crucial for evaluating the tourism demand model and making informed decisions related to the tourism industry. Thus, the relationship between these factors and tourism expenditure elasticity is one of the interesting topics that can further fill this gap.
Conventional economic theories suggest that both quantitative and qualitative economic factors influence tourism demand (Goh, 2012; Law et al., 2019). Several studies have highlighted that a combination of quantitative and qualitative data represents key features of the tourism industry. Quantitative data refers to numerical economic data, whereas qualitative data comprises non-economic information that is normally non-numeric. Although traditional economic theories govern tourism demand analysis, it is clear that social, political, and technological factors also influence demand. Factors other than price and income contribute to 30% of the variation in demand for products and services (Law et al., 2019).
Recently, researchers have begun to recognize that non-economic factors (i.e., social status, personal interests, cultural background, and geographic features of the destination country) influence a tourist’s decision to choose a destination. Unfortunately, few studies have analyzed economic and non-economic factors in tourism demand and forecasting analysis (especially expenditure elasticities). Future research should integrate both economic and non-economic perspectives to understand how travel-related factors interact with socioeconomic characteristics to influence tourist expenditure elasticities. These empirical studies can examine the mediating or moderating effects of economic and non-economic factors on tourism expenditure elasticities, as well as the complex dynamics of tourism demand.
The Almost Ideal Demand System Model
Different models are used to analyze demand systems, such as the Linear Expenditure System (LES) model (Stone, 1954), the Rotterdam model (Barten & Turnovsky, 1966; Theil, 1965), the Indirect Translog System (ITS; Christensen et al., 1975), and the Almost Ideal Demand System (AIDS) model (Deaton & Muellbauer, 1980). The LES model can analyze normal and luxury commodities but cannot describe consumer demand behavior (Anindita et al., 2022). Similarly, the Rotterdam model is inconsistent with the function of maximizing utility (Anindita et al., 2022; Delavar et al., 2021). The ITS and LA-AIDS models are appropriate alternatives for tourism analysis. However, the ITS model is unsuitable for secondary data because it requires many independent parameters for analysis (Anindita et al., 2022). The AIDS model is the most suitable system demand model for tourism analysis due to its simplicity in analysis and linear parameters (Sam et al., 2021; Selvanathan et al., 2024). Moreover, the resulting price coefficient in the AIDS model can also be used to calculate three elasticity types: own price elasticity, cross-price elasticity, and expenditure elasticity (Y. Ahn et al., 2018; Y.-J. Ahn et al., 2020; Boto-García & Baños Pino, 2024; Jayasooriya & Bandara, 2024; Pai, Lee et al., 2024). Therefore, the AIDS model is widely accepted and estimated in the demand system literature. This model is particularly used to estimate the matrix of cross-price compensated elasticities used to approximate the compensating variation.
The AIDS model, first proposed by Deaton and Muellbauer (1980), is widely used to measure equations. Its flexible, functional structure includes enough parameters to estimate direct and indirect utility functions. The model has been widely used in previous empirical studies to analyze the demand for foreign tourism expenditure (Y. Ahn et al., 2018; Y.-J. Ahn et al., 2020; Chang et al., 2013; Disegna et al., 2017; Jayasooriya & Bandara, 2024; Lee et al., 2015; Pai, Lee et al., 2024; Usman et al., 2023). According to several studies in the literature, different travel expenses (e.g., lodging, food, shopping, and entertainment) are interconnected because of tourists’ budget allocation (Chang et al., 2013; Lee et al., 2015). Therefore, determining cross-price elasticities, where single equation models have proven ineffective, has become valuable. Additionally, travel-related factors (e.g., distance, gender, age, experience, travel duration, and travel agencies) are significant indicators influencing tourism expenditure (Y. Ahn et al., 2018; Chang et al., 2013; C. M. Chen & Chang, 2012; Lee et al., 2015).
Price and Expenditure Elasticities of Tourism Demand
The AIDS model is a commonly used tool in tourism research that helps determine price and expenditure elasticities. Chang et al. (2013) and Jayasooriya and Bandara (2024) apply the AIDS model to calculate expenditure elasticity for essential travel items such as transport, accommodation, food, shopping, and entertainment. They find positive coefficients for both first-time and repeat travelers, except for shopping. Lee et al. (2015) and Y.-J. Ahn et al. (2020) also demonstrate positive expenditure elasticity coefficients for all categories but negative own-price elasticities and positive cross-price elasticities (except for transportation and recreation, which are negative). The budget allocation for transportation, leisure, and shopping tends to increase with travel distance while the lodging share decreases. Previous studies (Y. Ahn et al., 2018; Chang et al., 2013; García-Sánchez et al., 2013; Lee et al., 2015) have used cross-sectional and multi-year datasets to identify expenditure, own-price, and cross-price elasticities with the AIDS approach. These studies find that travel budgets are closely linked to other expenditure categories and are sensitive to price fluctuations.
Overall Satisfaction and Tourism Demand Elasticities
Prior studies indicate that satisfied tourists are less price-sensitive, especially after economic downturns (Bernini & Galli, 2022). Customer satisfaction significantly impacts spending patterns, with various models showing that it directly affects how much tourists spend (Rosselló-Nadal, 2023). In luxury tourism, high satisfaction reduces price sensitivity (Smeral, 2017). Content tourists are more inclined to accept higher costs, leading to steadier demand (Boto-García & Baños Pino, 2024). Also, high satisfaction correlates with increased income elasticity, meaning satisfied tourists tend to spend more as their income rises (Inchausti-Sintes et al., 2021). This is especially true for retirees with stable incomes who continue to travel due to overall satisfaction (Pak, 2020). Satisfied travelers often extend their stays, even with price changes, which benefits both their experience and the destination’s economy (Jackman et al., 2020). High satisfaction is associated with longer visits and greater spending (Gemar et al., 2022). It also helps mitigate the negative effects of economic struggles, providing resilience for tourism destinations (Martínez-Roget et al., 2024). Ultimately, satisfied tourists demonstrate inelastic demand, which fosters loyalty and supports sustained revenue for tourism businesses (Balcilar et al., 2021).
The impact of satisfaction on tourism expenditure is intricate and can also vary based on factors like income, travel-related characteristics, and destination attributes. For instance, higher satisfaction can lead to reduced spending on food (Kim et al., 2010) while increasing spending on accommodation and transportation (Disegna et al., 2017). D’Urso et al. (2020) find a positive link between satisfaction and expenditure on accommodation and shopping, with support from studies by Boto-Garcia et al. (2021) and Skare et al. (2023). Previous studies have not factored in service satisfaction with price and expenditure elasticity. To address this, we consider service satisfaction as a potential moderator in our AIDS model, thereby providing valuable insights into how satisfaction interacts with price and expenditure elasticities. This approach allows us to assess whether satisfaction levels strengthen or weaken the relationship between price and expenditure in terms of the differences in the consumption portfolios of different tourists. Therefore, our study provides the hypotheses as shown:
Travel-Related Characteristics and Tourism Demand Elasticities
Numerous previous studies (Athanasopoulos et al., 2014; García-Sánchez et al., 2013; Guillet et al., 2011; Ho & McKercher, 2014; Lee et al., 2015; Phan et al., 2024) have examined the relationship between distance traveled and travel expenditure. They show that travel expenses are positively associated with the distance from home to the destination. Especially in transportation, with an increase in the distance traveled, there would be a corresponding rise in transportation expenses. Some studies, such as those by Ho and McKercher (2014) and Lee et al. (2015), explore differences in how long- and short-distance travelers allocate budgets. In addition, prior studies show a complex relationship between travel duration and expenses. Some studies (Atsız et al., 2022; Ferrer-Rosell et al., 2015; Gemar et al., 2022; Jackman et al., 2020) indicate a positive correlation between trip length and total spending, influenced by factors such as household income, accommodation type, and past travel experiences. Longer stays often lead to higher overall expenditures, but daily spending tends to be lower, with travelers focusing more on accommodation costs rather than leisure activities (Bernini & Galli, 2022; Boto-García & Baños Pino, 2024). In contrast, other studies suggest that shorter trips can result in higher daily expenses, as short-term visitors may splurge on luxury experiences, as supported by García-Sánchez et al. (2013), Massidda et al. (2022), and Smolčić Jurdana and Soldić Frleta (2017).
According to Alegre and Cladera (2010) and Phan et al. (2024), repeat visitors spend less than first-time visitors. In contrast, Ferrer-Rosell et al. (2015) identify that tourists with more travel experience are willing to pay for various aspects of their trip (i.e., accommodations, shopping, or activities). Chang et al. (2013) and Y. Ahn et al. (2018) suggest that prior travel experiences generally do not significantly affect the amount tourists spend during their trips. Revisiting a destination or being a first-time visitor does not necessarily determine spending responsiveness to pricing or other factors. These findings note that repeat visitors’ expenditures can vary depending on individual characteristics. In addition, past studies demonstrate that early planners tend to invest more in their travels and prefer pre-booked services (Kozak et al., 2008; Massidda et al., 2022; Pak, 2020; Park et al., 2020; Phan et al., 2024). In contrast, last-minute travelers often have higher daily spending, but their total costs are usually lower (Boto-García & Baños Pino, 2024; Gemar et al., 2022; Jackman et al., 2020). The planning duration significantly influences spending between pre-booked and discretionary expenses (Martínez-Roget et al., 2024; Massidda et al., 2022).
Based on the previous literature, travel-related characteristics positively/negatively influence travel expenditure behavior. However, the limitation of this literature is that it does not thoroughly examine how these factors affect tourism demand elasticities. Therefore, our study aims to fill this gap by testing the following hypothesis:
Individual Socioeconomic Characteristics and Tourism Demand Elasticities
Some studies indicate that male tourists spend more (Saayman et al., 2012) or insignificant (Abbruzzo et al., 2014; Bernini & Cracolici, 2015; Brida & Scuderi, 2013). Phan et al. (2024) indicate that women are more responsive to price changes. Y.-J. Ahn et al. (2020) further confirm that women generally have lower price elasticity in their purchasing decisions. Previous studies clearly show a strong link between income levels and consumer behavior in tourism. Higher-income leads to lower price sensitivity and greater responsiveness to income changes (Balcilar et al., 2021; Inchausti-Sintes et al., 2021). Additionally, strong employment numbers boost demand for outbound tourism, connecting job availability with travel trends (Balcilar et al., 2021). Aguiló et al. (2017) find that higher-income travelers generally spend more on accommodation, food, and transportation and have longer stays. However, measuring income in tourism studies can be challenging due to respondents’ reluctance to disclose earnings. Thus, some databases use ordinal categorical variables like income classes, allowing for the consideration of non-linear effects using dummy variables.
While some studies suggest that older tourists spend more (Abbruzzo et al., 2014; Lin et al., 2023; Saayman et al., 2012) due to higher disposable income and established travel habits, others report contradictory findings (Aguiló et al., 2017). Older travelers are less price-sensitive and prefer longer stays, supported by Z. Li et al. (2020) and Jackman et al. (2020). Generation Z travelers prioritize ethical and eco-friendly food choices for well-being (Orea-Giner & Fusté-Forné, 2023). Higher-educated individuals spend more on travel products (Aguiló et al., 2017; Saayman et al., 2012). These educated consumers also exhibit greater income elasticity, leading to more responsiveness to income changes in their travel spending (Sahoo et al., 2022). In contrast, larger families are usually more price-sensitive, which makes them cautious about travel expenses (Usman et al., 2023). Additionally, cultural differences also play a significant role in price sensitivity, highlighting the need to understand varied consumer behaviors in the travel market (Gemar et al., 2022). Based on the previous literature, socioeconomic characteristics positively/negatively influence travel expenditure behavior. However, the limitation of this literature is that it does not thoroughly examine how these factors affect tourism demand elasticities. Therefore, our study aims to fill this gap by testing the following hypothesis:
We develop a conceptual framework, as illustrated in Figure 2, that consists of two main stages. In the first stage, we employ the AIDS model to estimate expenditure and price elasticities by using the travel budget allocation across five major travel products (i.e., accommodation, food, transportation, shopping, and miscellaneous). We also consider the impact of overall satisfaction on the AIDS model. In the second stage, we employ the OLS regression to investigate the influence of various factors (i.e., overall tourism satisfaction, travel-related factors, and individual socioeconomic characteristics) on expenditure elasticities. This approach provides a more thorough understanding of the tourism demand model, which can be useful for decision-makers when formulating tourism policies. The definitions of the research variables are in Appendix 1.
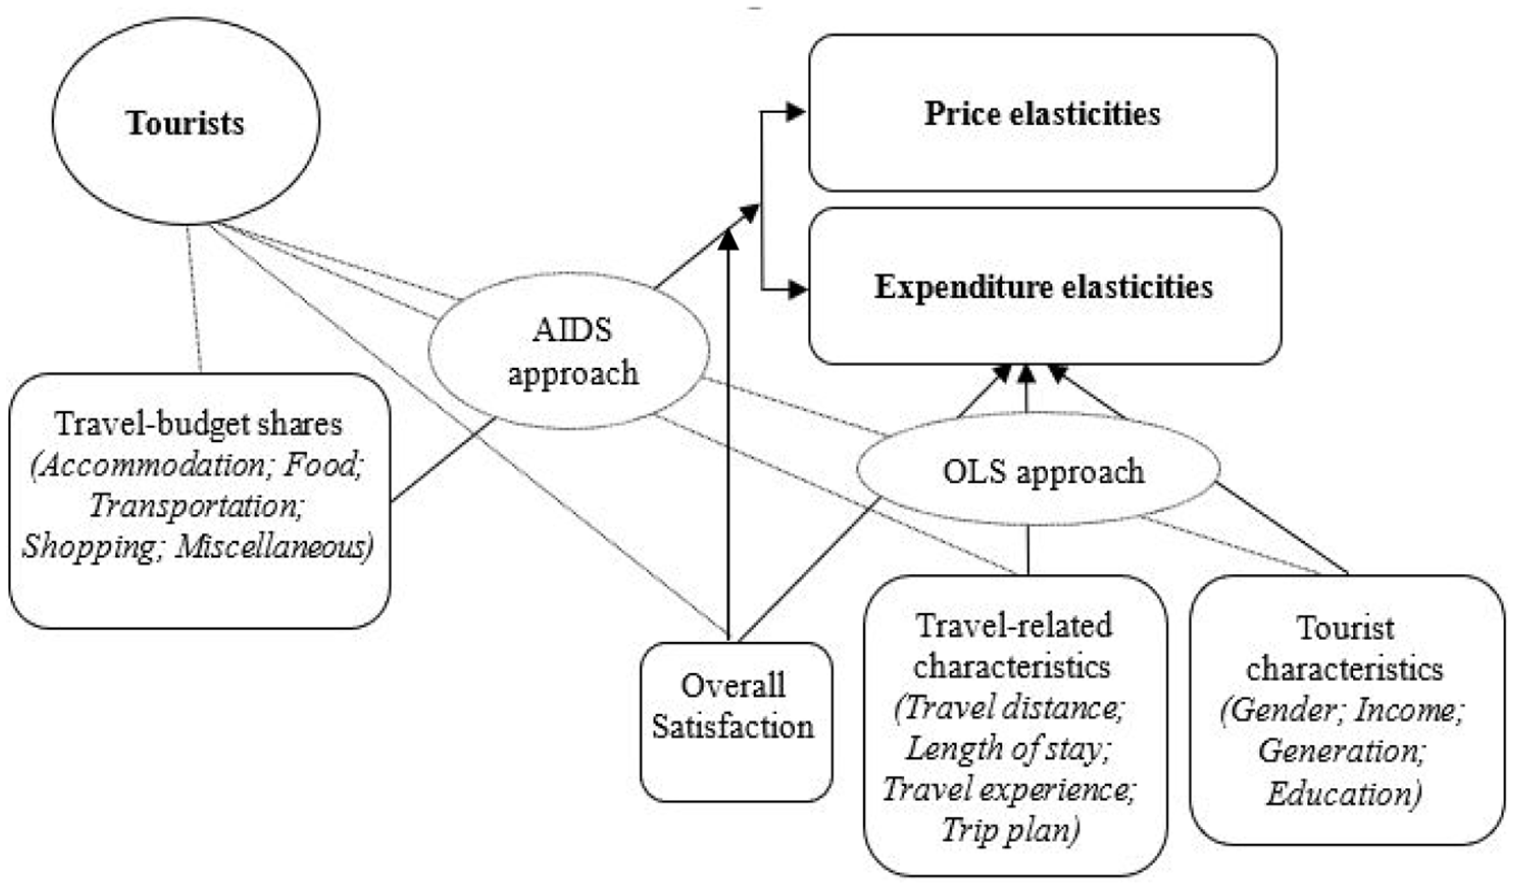
Conceptual framework.
Data and Methodology
Sample and Data Collection
We employed the secondary database provided by the Taiwan Tourism Bureau (TTB; https://admin.taiwan.net.tw) to study foreign tourists’ spending habits in Taiwan from 2016 to 2021. The Tourism Bureau of Taiwan conducts an annual survey to understand foreign visitors’ behavior, preferences, and spending habits. This survey employed quota sampling to ensure representative samples of independent tourists arriving from overseas between January 1 and December 31 (except for transit visitors) departing from four international airports in Taiwan (i.e., Taiwan Taoyuan International Airport, Taipei Songshan Airport, Kaohsiung International Airport, and Taichung International Airport). The brief questionnaire used for data collection is shown in Appendix 2.
This study focuses on foreign tourists to support economic growth, cultural exchange, and diplomacy, aligning with the NSP’s objectives. Taiwan with advanced infrastructure, cultural heritage, and natural landscapes, has become a popular destination, particularly for young tourists seeking unique experiences. Our analysis covers 2016 to 2021, including the COVID-19 period, offering insights into tourism demand and informing policy decisions on tourism management, pricing, and visa regulations for the post-pandemic period. We use the Tourism Bureau survey database of tourists who visited Taiwan from 2016 to 2021, with a total of 30,953 valid responses (5,509 in 2016, 5,919 in 2017, 5,822 in 2018, 6,993 in 2019, 3,833 in 2020, and 2,876 in 2021). Our study focuses on group and individual tourists who planned their trips independently, as they could estimate their exact expenditures. We excluded respondents with missing expenditure data, resulting in a final sample size of 20,574 observations (3,293 in 2016, 3,907 in 2017, 4,012 in 2018, 4,837 in 2019, 2,597 in 2020, and 1,928 in 2021). The respondents came from countries such as Japan, China, Korea, the Philippines, Thailand, Vietnam, Malaysia, Singapore, Indonesia, the United States, Canada, and Europe. Travel expenditures were calculated based on visitor consumption and the consumer price indices for international visitor regions in Taiwan, with detailed variables provided in Appendix 1.
The data records the spending of each tourist across five main categories as defined by Stynes and White (2006): (1) Accommodation, encompassing stays in places such as hotels and motels; (2) Food and beverages, including expenses on meals, snacks, and groceries; (3) Shopping, covering purchases of items like clothing, jewelry, souvenirs, and local specialties; (4) Local transportation, involving costs related to travel within Taiwan, including various modes like trains, buses, taxis, and rental cars; (5) Miscellaneous, accounting for other expenditures such as entertainment activities (e.g., movies, nightlife, golf). The calculation of travel expenditure is based on visitor spending patterns and the consumer price indices specific to regions visited by international tourists in Taiwan.
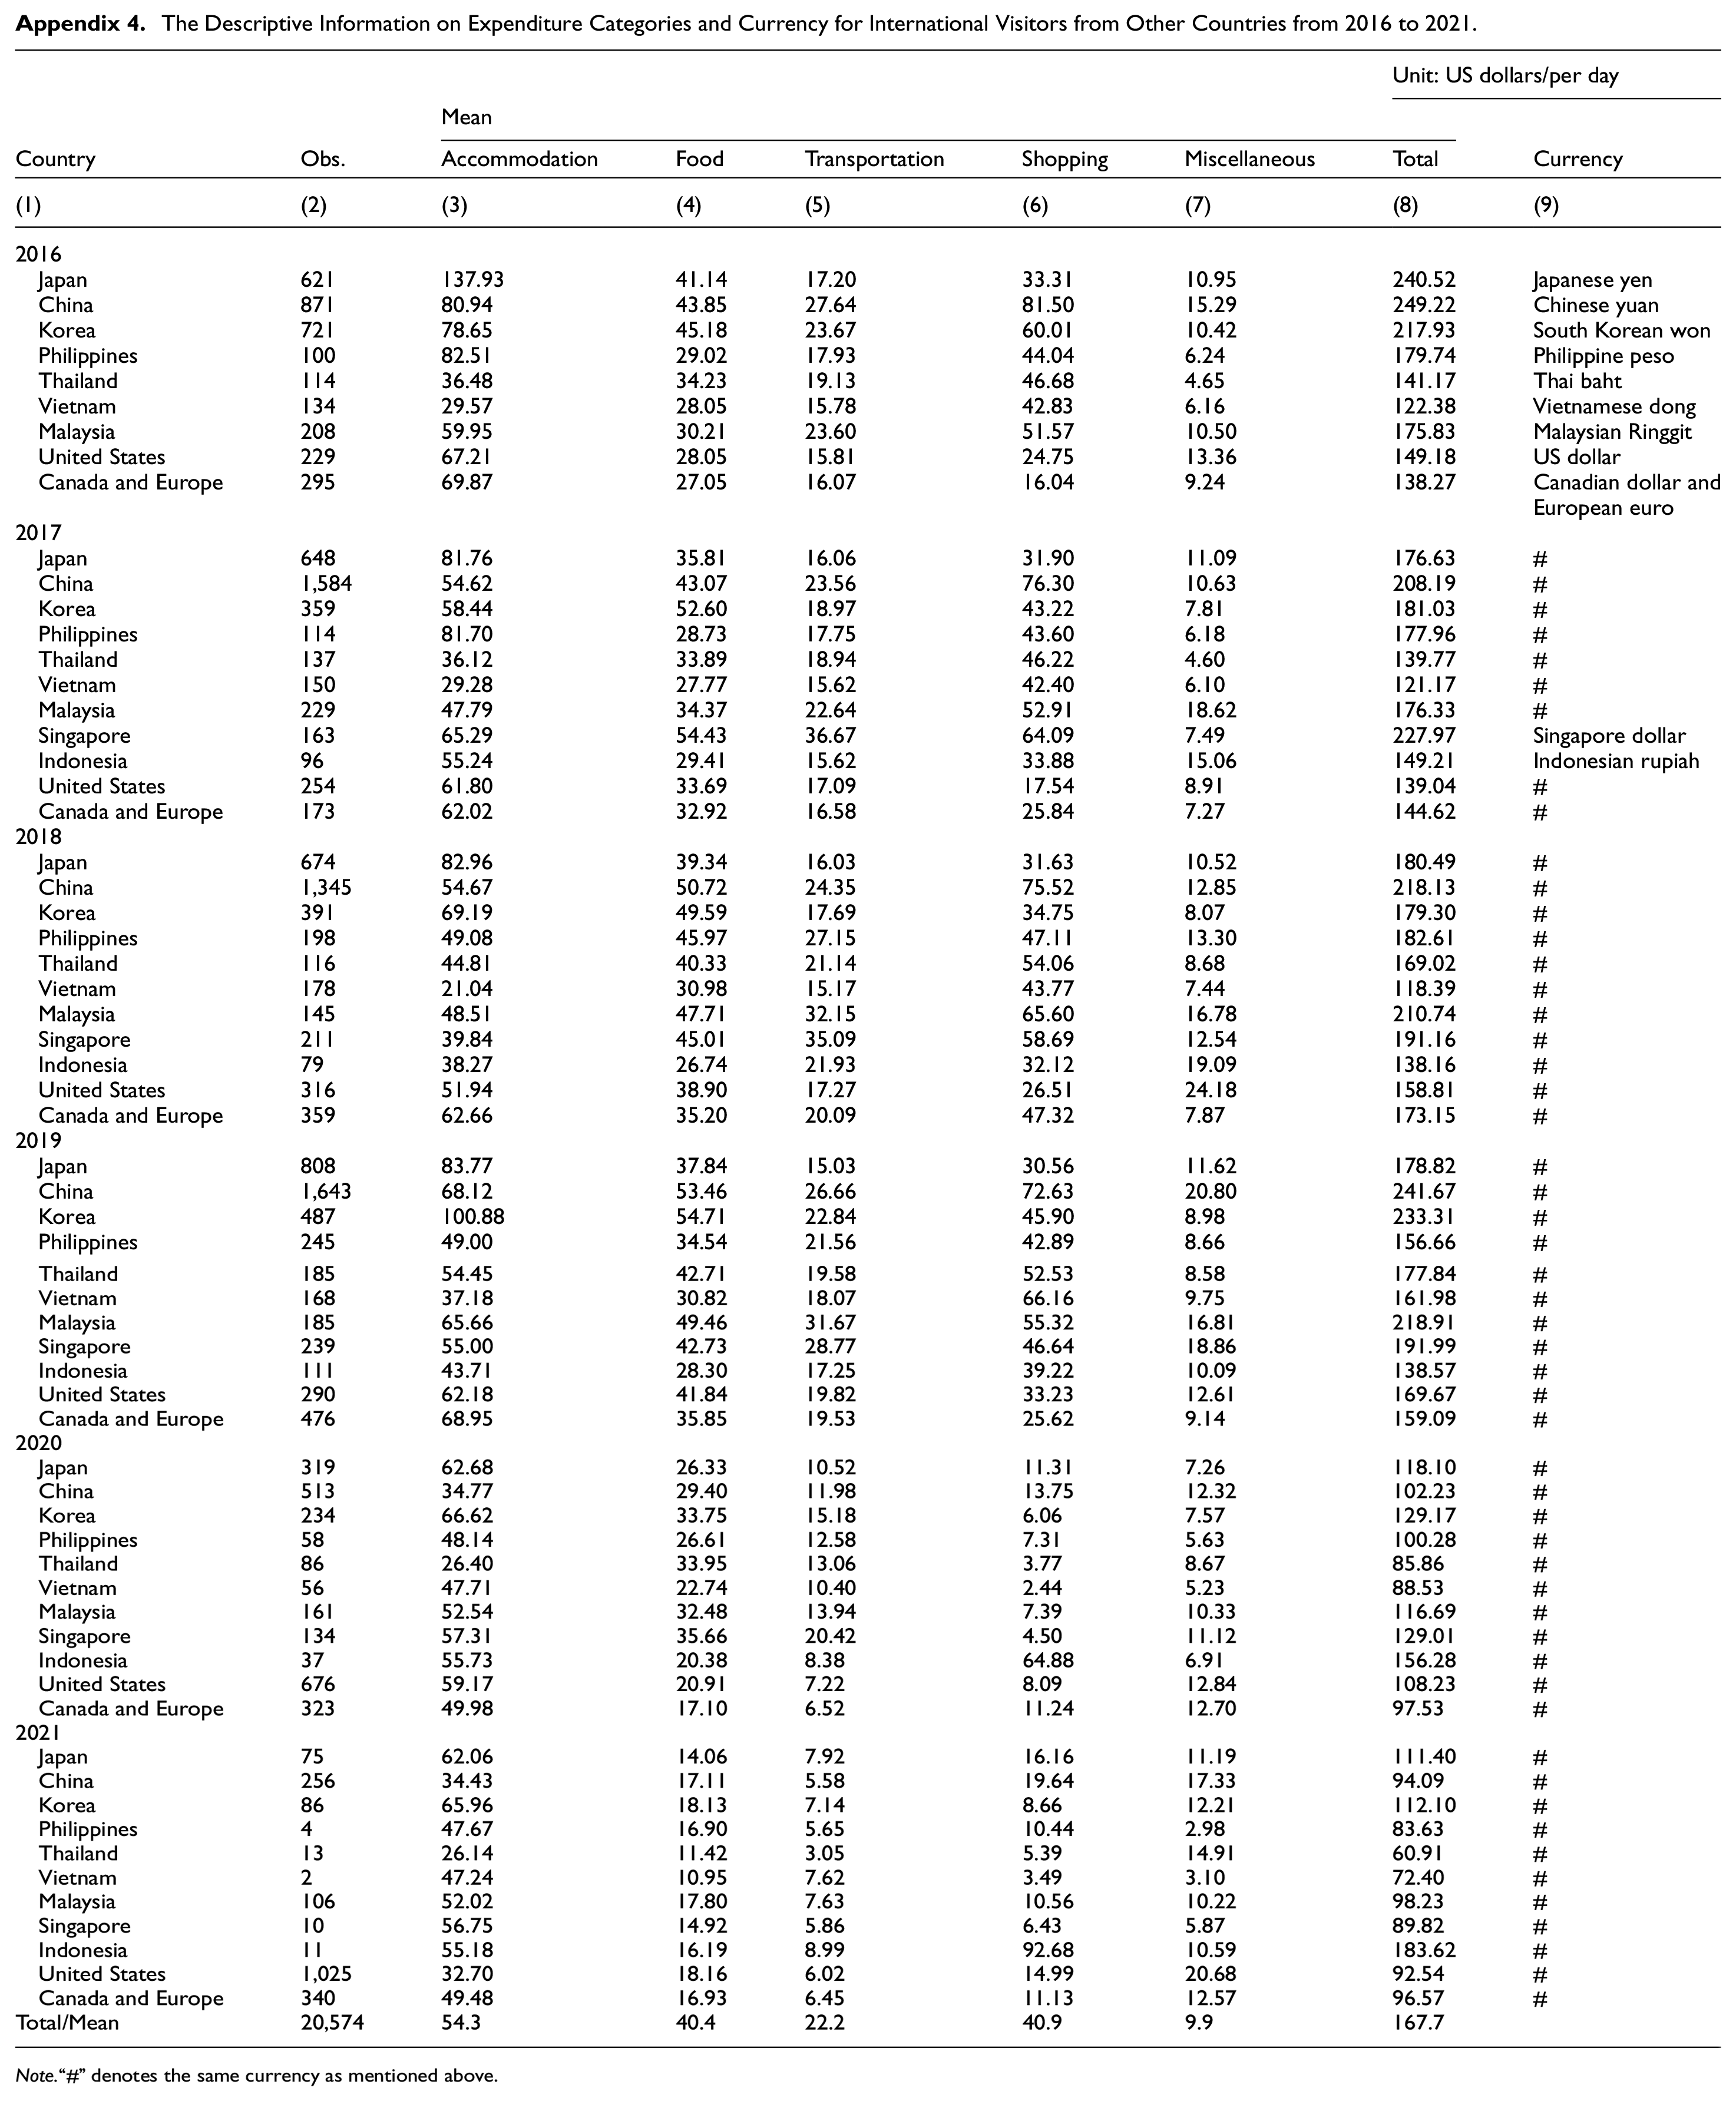
Table 2 shows the definitions of expenditure category and the consumer price index (CPI) classification used in our analysis. The CPI is issued by the Directorate-General of Budget, Accounting, and Statistics, Taiwan (https://eng.dgbas.gov.tw/). We standardized the daily expenditure figures by dividing the expenditure on each product by the total number of travel days in the trip. Inbound tourist expenditures are initially measured in New Taiwan dollars. The local currency for each country is converted to the New Taiwan dollar based on the prevailing currency exchange rate in the current year. In this study, we convert all expenditures by New Taiwan dollars to US dollars, which allows us to standardize measurements and facilitate comparability across all countries. Appendix 4 (Column 9) shows the currency information for international visitors from other countries.
Expenditure Category Definitions and the Consumer Price Index (CPI) Classification.

Source. CPI classifications are obtained from the Directorate-General of Budget, Accounting and Statistics, Taiwan (https://eng.dgbas.gov.tw/).
Methodology
This study employs the AIDS and Ordinary Least Squares (OLS) models to analyze tourism demand. The AIDS model estimates price and income elasticities, capturing interdependencies between travel products and consumer behavior (Mangion et al., 2012; Syriopoulos & Thea Sinclair, 1993). Meanwhile, the OLS model examines the linear relationships between tourism demand and factors like travel characteristics and socioeconomic variables (Song & Li, 2008). The AIDS model provides insights into demand shifts due to price changes and competition (Athanasopoulos et al., 2014; Chang et al., 2013; Sam et al., 2021). Unlike alternative approaches, such as discrete choice modeling, the AIDS model allows for a deeper understanding of tourism demand dynamics (Anindita et al., 2022; Boto-García et al., 2022; Selvanathan et al., 2024).
We use the Almost Ideal Demand System (AIDS) proposed by Deaton and Muellbauer (1980) to examine the differential expenditure decisions made by tourists. The AIDS framework describes the shared equations of an n-product system as follows:

and,
Where wi is the proportion of the overall expenditure spent on the ith product; pj is the price of the jth product; X is the total cost for the complete basket of items; and pi is the price for qi. The parameters (α, β, ε, and γ) also need to be estimated. Ai is an intercept coefficient in the ith share equation; Bi is a change in the budget share of the ith product relating to a change in actual expenditure, with constant prices; Ei is the random disruption; and each γij is the slope coefficient for product j in the ith share equation.
P is a generalized price index which is defined as:

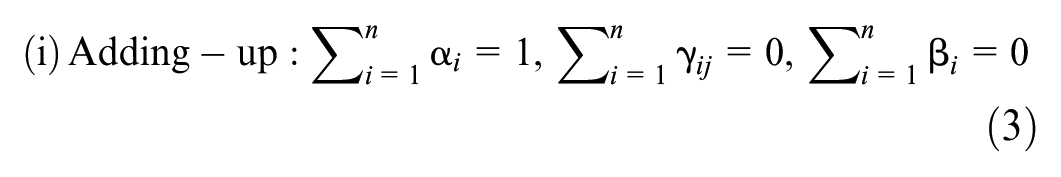
The five categories are accommodation, food, transportation, shopping, and miscellaneous (i.e., entertainment). We imposed the following constraints on the parameters of Equation 1 to conform to the basic principles of demand and utility theory:


Using the estimated parameters from Equation 1, δij is defined as the Kronecker delta (δij = 1 if I = j; otherwise, 0 if I ≠ j), the uncompensated price (εij), the compensated price (eij) and the expenditure elasticity (ƞi).


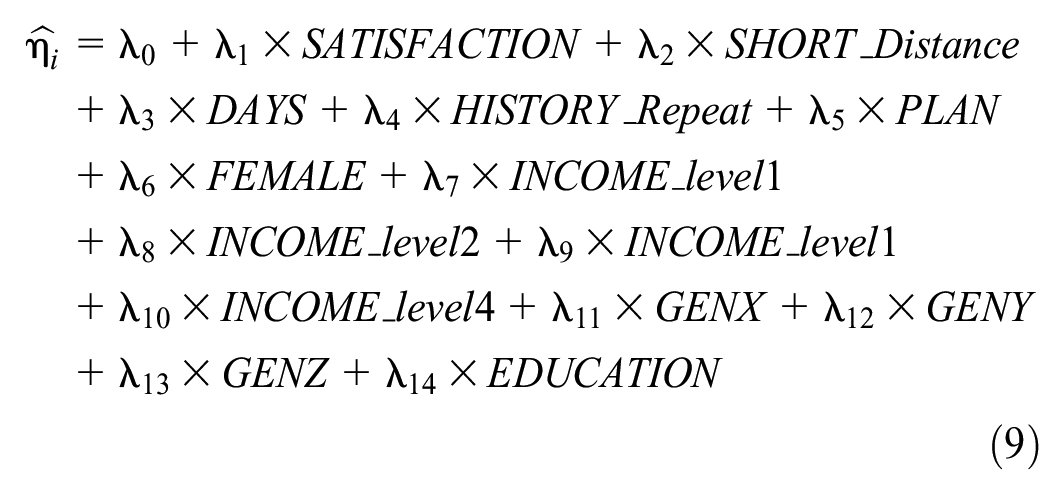
Our OLS regression analysis examines how travel-related and personal characteristics affect travel expenditure elasticity, offering a comprehensive understanding of the factors influencing expenditure responsiveness to price changes.
We used expenditure elasticity (
Empirical Results
Descriptive Statistics
According to the descriptive statistics in Table 3, the categories on which visitors spend the most are accommodation, shopping, and food, which suggests that these areas were the primary focus of the tourist survey. In contrast, relatively lower spending is found for transportation and miscellaneous expenses (which can include entertainment and other incidental costs). These findings provide valuable insights into the spending patterns of the visitors surveyed and highlight the categories where tourists tended to allocate most of their expenditures.
Descriptive Statistics on Total Expenditure and Respondent Budget Shares.

Estimation Results of the AIDS Model
We employ the AIDS formulas (1) and (2) to calculate demand system variables for tourists’ budget shares in their overall costs. The limits are set at (3) to (5). Table 4 shows that all eight predicted parameters for the own- and cross-price impacts on budget shares (γij) are statistically significant. All of the coefficients for the five spending categories are statistically significant when evaluating actual expenditure on budget shares (βi). These findings indicate a strong connection between the analyzed variables, consistent with Y.-J. Ahn et al. (2020), Balcilar et al. (2021), Sahoo et al. (2022), Boto-García & Baños Pino (2024), Massidda et al. (2022), Pak (2020), and Bernini and Galli (2022).
Estimation Results of the AIDS Model.

Note.*** indicates significance at the 1% level; ** indicates significance at the 5% level; and * indicates significance at the 10% level.
The diagonal components of Table 5, the respective own-price elasticities for accommodation, food, transportation, shopping, and other expenditures are −0.716, −1.001, −0.873, −0.787, and −0.746. As expected, all of these coefficients are negative, implying the a priori relationship based on demand theory (Y. Ahn et al., 2018; Balcilar et al., 2021; Chang et al., 2013; Lee et al., 2015; Sahoo et al., 2022). The higher absolute own-price elasticities for food suggest tourists are highly responsive to price changes in this category, indicating they have many dining options to match their budget. In addition, we find all of the coefficients on expenditure elasticity to be positive. Since the expenditure elasticities for food (1.355), transportation (1.535), and miscellaneous (1.196) are all found to be greater than 1, this indicates that these categories are relatively more sensitive to changes in total travel expenses (Y.-J. Ahn et al., 2020; Massidda et al., 2022). In contrast, accommodation and shopping have relatively lower respective expenditure elasticities of 0.747 and 0.461, suggesting that they are less sensitive to changes in total travel expenses (Y. Ahn et al., 2018; Chang et al., 2013; Pak, 2020).
Estimation Results on Uncompensated Price and Expenditure Elasticity.

Note.*** indicates significance at the 1% level; ** indicates significance at the 5% level; and * indicates significance at the 10% level.
The compensated cross-price elasticity coefficients show the reallocation effects net of the income effects. Table 6 reports the responsiveness of demand in one category to changes in the price of another category (Ağazade (2024); Balcilar et al., 2021; Jackman et al., 2020; Massidda et al., 2022).
Hicksian (Compensated) Own- and Cross-price Elasticities.

Note.*** indicates significance at the 1% level; ** indicates significance at the 5% level; and * indicates significance at the 10% level.
Multiple Regression Analysis
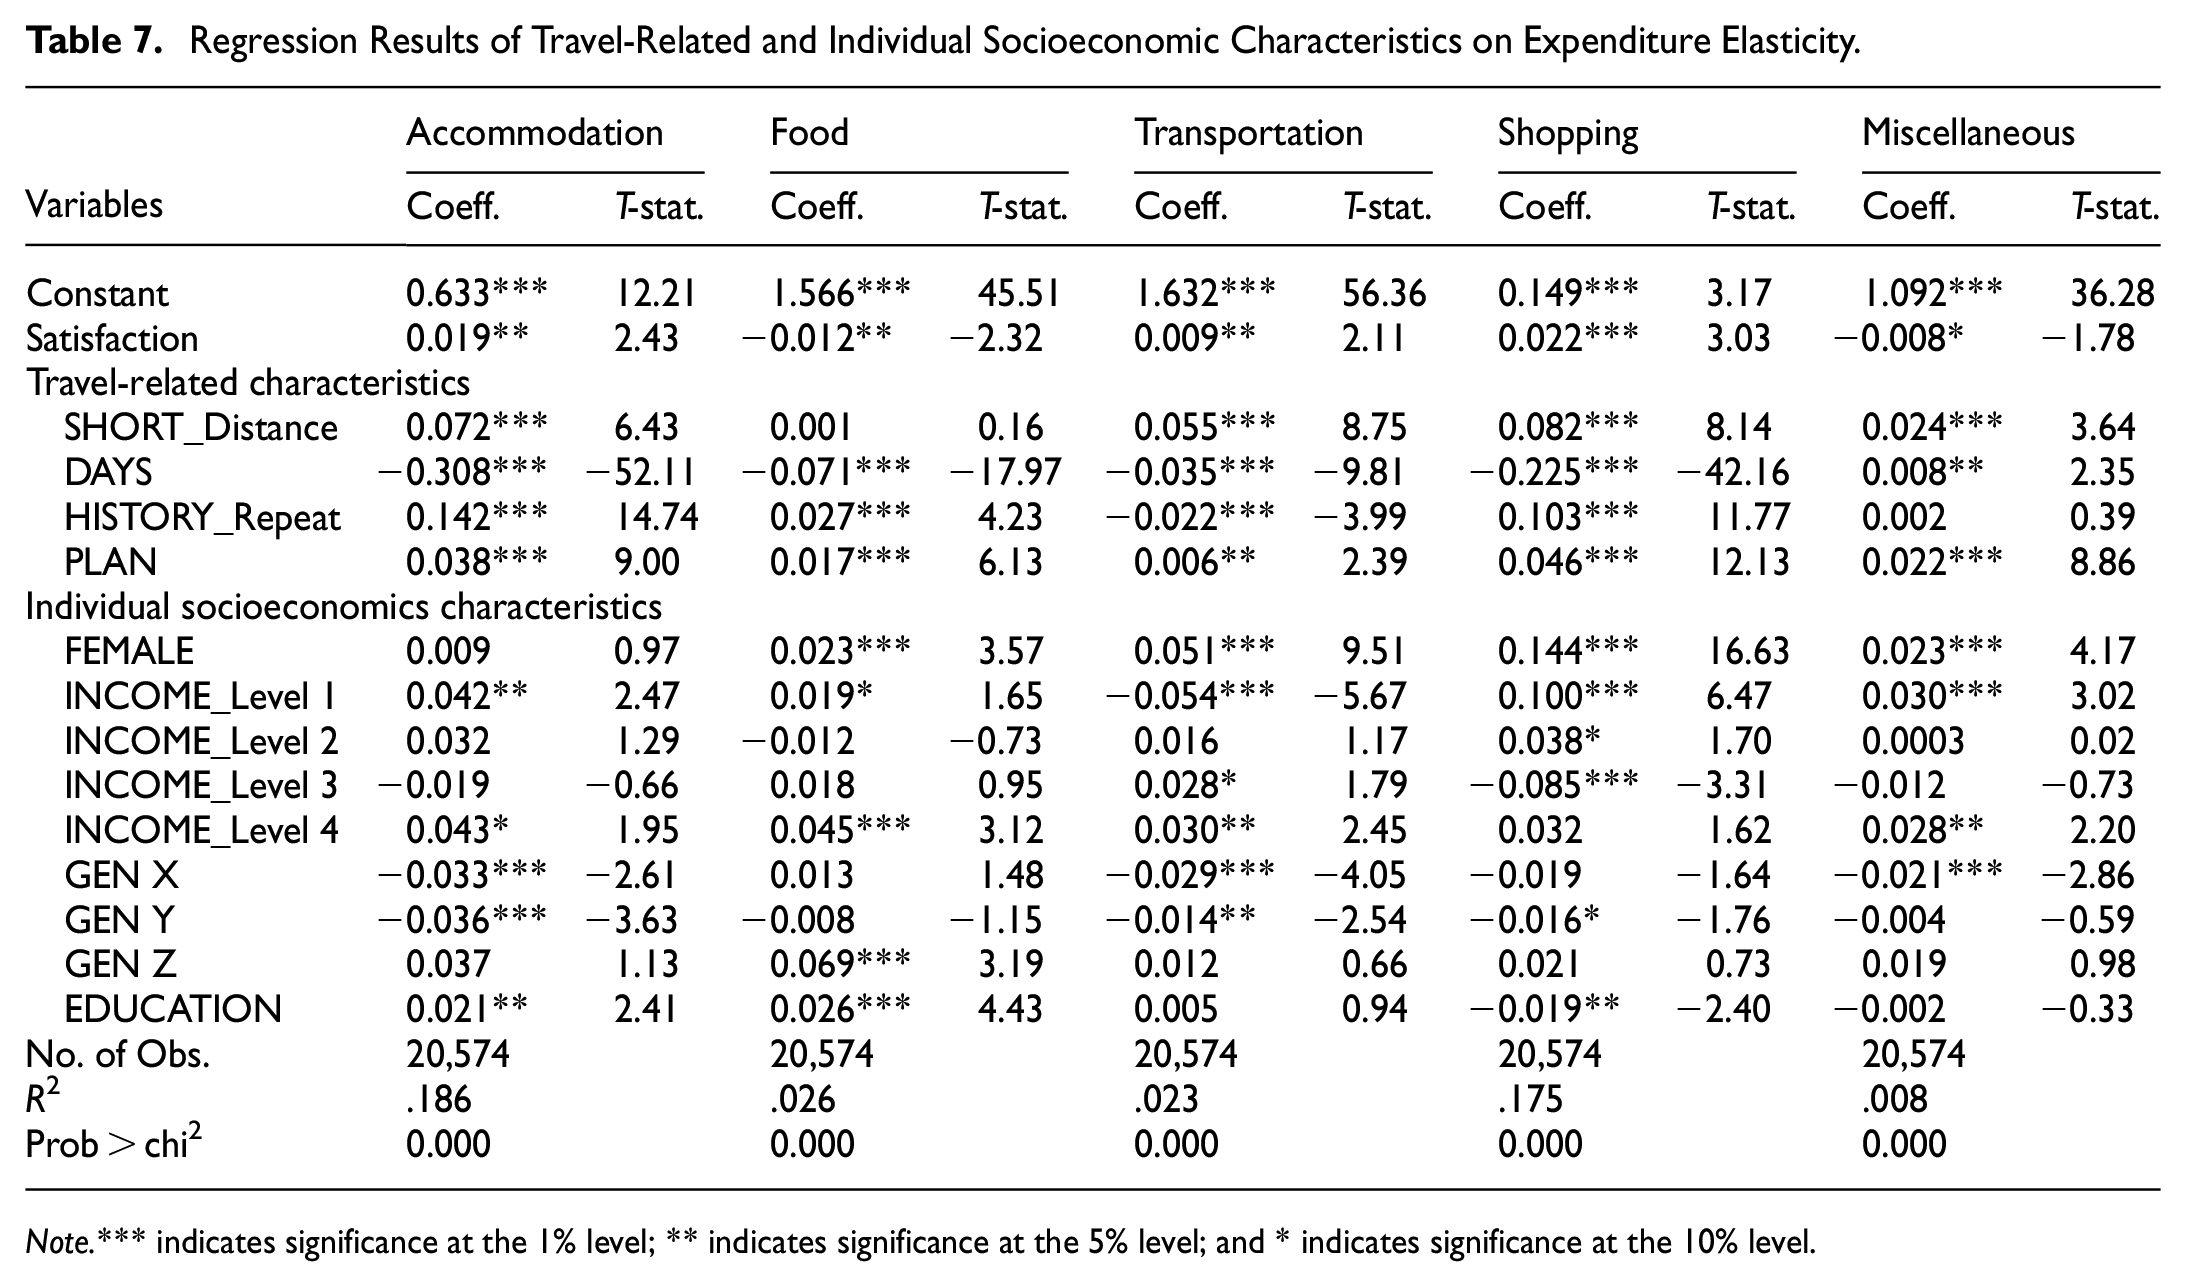
We conducted OLS regressions to examine the effects of travel-related and individual factors on expenditure elasticity for travel products. Expenditure elasticities, estimated in Equation 7, are the dependent variable. The results, presented in Table 7, offer insights into the impacts of these factors on the expenditure elasticities of travel products.
Regression Results of Travel-Related and Individual Socioeconomic Characteristics on Expenditure Elasticity.
Note.*** indicates significance at the 1% level; ** indicates significance at the 5% level; and * indicates significance at the 10% level.
The Impact of Satisfaction Levels on Travel Expenditure Elasticity
The survey respondents are asked to rate their satisfaction level with the different aspects of their destination based on a five-point Likert scale. These aspects include hotels and other accommodation (Accommodation), food and beverages (Food), quality and variety of the products offered in stores (Shopping), domestic transportation convenience (Transportation), recreation base facilities, and other services (Miscellaneous). The satisfaction levels range from 1_Very poor to 5_Excellent. The percentage satisfaction levels for each aspect are illustrated in Figure 3. The proportion of visitors who rate any aspect lower than 3 is relatively low, indicating a relatively high overall satisfaction level. Figure 3 illustrates the satisfaction levels for five categories: accommodation, food, transportation, shopping, and miscellaneous. To be specific, five levels show 100% of the visitors’ overall satisfaction. Out of the sample visitors, 52.1% agree that their trip is excellent, 43.8% rate it as good, 3.7% choose fair, and only 0.2% find it poor or very poor. In addition, over 80% of visitors rate their experience with accommodation, food, transportation, shopping, and other services as good or excellent (95.3%, 87.6%, 92.6%, 97.8%, and 80.5%, respectively).
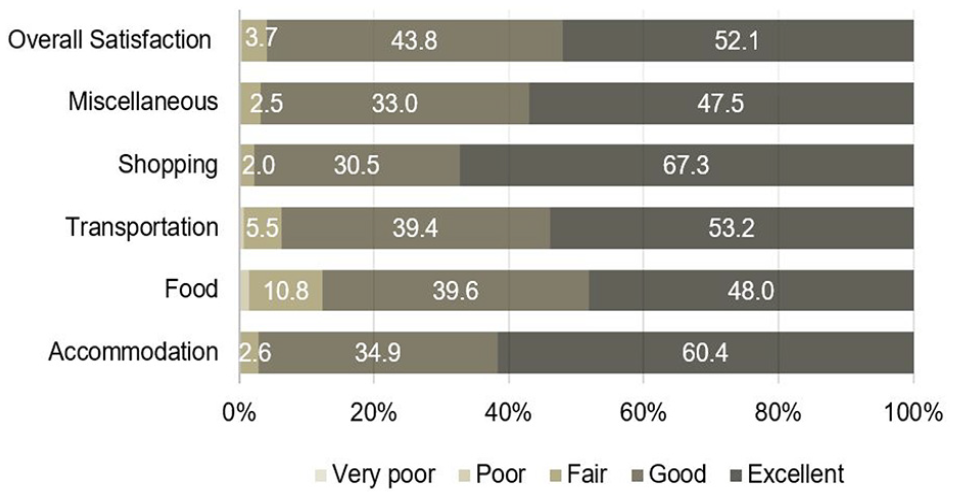
Percentage distribution of satisfaction levels for each category.
According to Table 7, our findings indicate a significantly positive correlation between satisfaction levels and their overall expenditure on accommodation, transportation, and shopping, with coefficients .019 (p < .05), .009 (p < .05), and .022 (p < .01), respectively. These results support hypothesis 2, suggesting that tourists spend more when satisfied with these specific areas (Bernini & Galli, 2022; Pak, 2020; Smeral, 2017). Conversely, satisfaction levels negatively correlate with food and miscellaneous expenses, with respective coefficients of −.012 (p < .05) and −.008 (p < .1). With an increase in satisfaction levels, there is a tendency for tourists to spend less on food and miscellaneous items, possibly as a result of prioritizing other aspects of their travel experience or being more budget-conscious (Y.-J. Ahn et al., 2020).
The Impact of Travel-Related Characteristics on Travel Expenditure Elasticities
Our regression analysis shows that the distance between tourists and their destinations significantly impacts their spending patterns. Shorter distances (SHORT_Distance) positively correlate with expenditure elasticities in accommodation, transportation, shopping, and miscellaneous categories. The respective coefficients for these categories are 0.072 (p < .01), 0.055 (p < .01), 0.082 (p < .01), and 0.024 (p < .01), indicating the strength of these correlations (the one exception being the insignificance found for food). These results support hypothesis 3 and are consistent with previous studies. They suggest that tourists are more likely to adjust their spending in response to price changes when traveling shorter distances (Ho & McKercher, 2014; Lee et al., 2015; Pai, Phan et al., 2024).
Tourists staying (DAYS) longer are less sensitive to accommodation, food, transportation, and shopping price changes. The respective coefficients are −0.308 (p < .01), −0.071 (p < .01), −0.033 (p < .01), and −0.225 (p < .01). These results also support hypothesis 3, suggesting that tourists prefer convenience, comfort, and immersive experiences (Atsız et al., 2022; Bernini & Galli, 2022; Boto-García & Baños Pino, 2024; Gemar et al., 2022; Jackman et al., 2020). Travel planning (PLAN) has a significant positive impact on expenditure elasticities in accommodation, food, transportation, shopping, and other expenses. The respective coefficients are 0.038 (p < .01), 0.017 (p < .01), 0.006 (p < .01), 0.046 (p < .05), and 0.022 (p < .01). Furthermore, tourists who plan for a longer trip to Taiwan tend to be more flexible in their spending, making them more responsive to price changes in various categories (Kozak et al., 2008; Massidda et al., 2022; Pak, 2020; Park et al., 2020; Phan et al., 2024). This flexibility enables tourists to make more informed decisions about where and how they spend their money.
Our findings again reveal a positive correlation between travel history (HISTORY_Repeat) and expenditure elasticities on accommodation, food, and shopping. The respective coefficients are 0.142, 0.027, and 0.103, with significance at p-values of <.01. Repeat visitors adjust their spending based on price fluctuations as they better understand the market and pricing trends. However, a negative correlation exists between travel history and expenditure elasticities in transportation (coefficient of −.022, p < .01). These results also support our hypothesis 3 and align with Jackman et al. (2020), Nowak et al. (2024), Pai, Lee et al. (2024), and Phan et al. (2024). As tourists visit Taiwan more frequently, they become less responsive to changes in transportation prices, possibly due to loyalty to specific providers, familiarity with routes and schedules, or willingness to pay for convenience or comfort (Gemar et al., 2022).
The Impact of Individual Socioeconomic Characteristics on Travel Expenditure Elasticity
Female visitors (FEMALE) have higher expenditure elasticities than male visitors on food, transportation, shopping, and miscellaneous items. The respective coefficients are .023, .051, .144, and .023, with significance at p-values of <.01. These results support hypothesis 4, suggesting that female tourists may respond more to price changes and adjust their travel spending to get the best value (Y.-J. Ahn et al., 2020; Atsız et al., 2022; Phan et al., 2024). They may also be more proactive in seeking deals, comparing prices, and making informed decisions about where to allocate their travel budget. Low-income tourists significantly and positively impact expenditure elasticities on accommodation, food, shopping, and miscellaneous. The respective coefficients are .042 (p < .01), .019 (p < .01), .100 (p < .01), and .030 (p < .01). However, a negative correlation exists between low-income and transportation expenses (coefficient of −.054, p < .01). High-income tourists have higher expenditure elasticities for accommodation, food, transportation, and miscellaneous expenses. The respective coefficients are .043 (p < 0. 1), .045 (p < 0. 01), .030 (p < .05), and .028 (p < .05). These results also support hypothesis 4, indicating that wealthier tourists tend to spend more across all categories (Aguiló et al., 2017; Balcilar et al., 2021; T.-S. Chen et al., 2022; Inchausti-Sintes et al., 2021). Gen X significantly and negatively impacts expenditure elasticities on accommodation, transportation, and miscellaneous (Aguiló et al., 2017). The respective coefficients are −.033, −.029, and −.021, with p < .01. Gen Y significantly and negatively impacts expenditure elasticities on accommodation, transportation, and shopping (Lin et al., 2023). The respective coefficients are −.036 (p < .01), −.014 (p < .05), and −.016 (p < .1). Gen Z correlates positively with food expenditure (Orea-Giner & Fusté-Forné, 2023) and has no significant influence on accommodation, transportation, shopping, and other expenses. These results support hypothesis 4, highlighting that Gen Z prefers food experiences, while Gen X and Y are more budget-conscious (Boto-García & Baños Pino, 2024; Z. Li et al., 2020).
A significantly positive correlation is discernible between the educational level of tourists and their expenditure elasticities on accommodation and food (respective coefficients of .021 (p < .05) and .026 (p < .01). These results support hypothesis 4. This implies that with an increase in their educational level, tourists may become more sensitive to changes in accommodation and food expenditure elasticities. Thus, educated tourists are more likely to adjust their accommodation and food spending based on price changes. However, we also find a negative correlation between educational level and shopping expenditure elasticity, with a coefficient of −.019 (p < .05). This indicates that educated tourists may be less likely to adjust their shopping spending based on price changes (Bernini & Galli, 2022; Sahoo et al., 2022). Whilst the expenditure elasticity of transportation is insignificant, it is still positively correlated with educational levels.
Discussion and Implication
According to Y. Ahn et al. (2018) and Lee et al. (2015), some items are more sensitive to price changes, making them luxury items (or high-price items), while others are less sensitive, making them budget items (or affordable-price items). Our findings show that accommodation and shopping are budget items, as their elasticity is less than 1. This highlights that inbound tourists’ demand for accommodation and shopping in Taiwan is inelastic or unaffected by expenditure and price changes (Y. Ahn et al., 2018; Chang et al., 2013; Pak, 2020). This indicates that tourists consider accommodation and shopping to be standard goods or neccessative goods. They prioritize location, amenities, and comfort prices when choosing their accommodation (e.g., luxury hotels) over budget-friendly hostels and guesthouses. In terms of shopping, they are willing to pay more for authentic and local items, enjoying unique shopping experiences in night markets and malls. As the price elasticity of accommodation and shopping is low, the tourism industry can increase the prices and quality of these items. Our findings contradict those of Lee et al. (2015), who also studied data spanning six consecutive years. However, they only observed the changes in expenditure patterns in an annual event rather than reflecting national tourism demand.
On the other hand, our study finds that food, transportation, and miscellaneous are luxury items, as their elasticity is greater than 1. This indicates that international tourists are elastic expenditures for food, transportation, and entertainment (Y.-J. Ahn et al., 2020; Massidda et al., 2022). Accommodation and shopping spending are relatively inelastic compared to total expenditures or price changes compared to food, transportation, and other expenses. Our findings suggest that budget and luxury tourists (or high-price groups) have different spending patterns, with budget tourists (or affordable-price groups) being more likely to spend on budget items (e.g., accommodation and shopping) and luxury tourists being more likely to spend on luxury items (e.g., food, transportation, and entertainment). Tourists are more price-sensitive with food expenses, prioritizing cheaper options like street food and local eateries. Thus, price promotions could significantly increase consumer demand. Finally, improving transportation convenience and enhancing service satisfaction in entertainment can stimulate consumption.
Travel categories such as food, transportation, and miscellaneous expenses demonstrate higher price elasticity. Our findings are consistent with Sun et al. (2023) and Knollenberg et al. (2021), which indicate that tourists are more inclined to modify their spending in these areas in response to price fluctuations. Specifically, food spending exhibits the highest elasticity, implying that tourists are sensitive to price changes in their dining choices, often favoring local, affordable options like street food over more upscale dining experiences Massidda et al. (2022). Likewise, transportation expenses show increased elasticity, aligning with Tan and Soon (2023) and Balcilar et al. (2021), who note that transportation spending is particularly sensitive to changes in overall travel expenses. Our findings also reflect emerging trends in tourism expenditure elasticity, especially during post-COVID-19 recovery. Recent studies, such as Song et al. (2023) and Sharma and Khanna (2023), highlight that price sensitivity has intensified following the pandemic, with budget-conscious tourists recalibrating their spending habits, particularly in food and transportation. This trend aligns closely with our results, which reveal a greater responsiveness of these categories to price changes. Furthermore, the findings support broader research on tourism economics, indicating that external shocks—such as COVID-19—disrupt global travel and lead to long-term implications for recovery strategies (Assaf et al., 2022; Yeh & Liou, 2024). Both policymakers and tourism businesses should create resilient frameworks capable of absorbing external shocks and facilitating recovery. Our results also underscore the significance of personalized experiences in tourism. Research by Sun et al. (2023) and Yeh and Liou (2024) suggests that long-stay tourists and repeat visitors are less sensitive to price fluctuations, as their familiarity with the destination fosters more flexible spending behaviors. Tourism businesses should leverage this insight by offering tailored services and loyalty programs to attract returning visitors and encourage extended stays.
Importantly, overall satisfaction significantly impacts the five spending categories, with p-values <.05. We note that satisfaction significantly influences the estimation of price and expenditure elasticity in the AIDS model. Our findings are supported entirely by the study of Chang et al. (2013), which explored the tourism demand of repeat visitors in Taiwan in 2019. This indicates that tourism demand elasticities will likely remain consistent between 2016 and 2021. The current tourism policies and the New Southbound Policy (NSP) have greatly impacted Taiwan’s tourism industry. Satisfaction levels are crucial in the tourism demand model as a moderator of travel experiences or repeat visitors. This study finds that overall satisfaction positively affects travel expenses in categories like accommodation, shopping, and transportation. This finding aligns with Boto-Garcia et al. (2021) and Skare et al. (2023), who note that satisfied tourists are more likely to spend on higher-value items. Conversely, dissatisfaction leads to lower spending, especially in food and miscellaneous categories, reinforcing the pivotal role of satisfaction in influencing consumer behavior (D’Urso et al., 2020). Tourist satisfaction, highlighted by D’Urso et al. (2020) and Bernini and Galli (2022), significantly impacts expenditure patterns. Repeat visitors, or those with high satisfaction, allocate more resources to specific categories, such as shopping and transportation (Boto-García et al., 2022). Dissatisfaction increases price sensitivity, especially in food-related expenditures. Businesses should focus on personalized services and memorable experiences, as emphasized by Cazorla-Artiles and Eugenio-Martin (2023). Skare et al. (2023) highlight that the importance of satisfaction extends beyond repeat visitors—it also influences the broader perceptions of destinations. Travel satisfaction is a key driver in the decision-making process, as satisfied tourists share their experiences through social media, further boosting demand. This result aligns with the broader trend where tourism satisfaction became a key metric in post-pandemic recovery strategies (Yeh & Liou, 2024).
Tourists who have had memorable travel experiences prioritize comfort, convenience, and luxury in their choice of accommodation over price (Boto-Garcia et al., 2021; D’Urso et al., 2020; Skare et al., 2023). Satisfied tourists allocate more of their budget to shopping and prioritizing convenience transportation (Boto-Garcia et al., 2021; Disegna et al., 2017; Skare et al., 2023) whilst reducing the expenditure elasticity of food Sahoo et al. (2022). Dissatisfaction can make tourists more price-sensitive (Disegna & Osti, 2016; D’Urso et al., 2020). These findings are valuable for both tourism businesses and policymakers. First, the tourism sector can continuously provide high-quality accommodation and shopping places while simultaneously adjusting the increased prices. Second, the sector can innovate the food and beverage experience by offering unique dining experiences that do not leave tourists feeling overly full. Food tourism is a growing trend, with visitors emphasizing unique culinary experiences and destination choices (Knollenberg et al., 2021; Okumus, 2021; Orea-Giner & Fusté-Forné, 2023). Local cuisine can significantly preserve cultural traditions and agricultural practices (Boluk et al., 2021) and is a major tourist attraction (Rong-Da Liang et al., 2013). For instance, self-cooking or cooking with locals using fresh ingredients. Third, Taiwan’s local transportation system is a key strength in the tourism industry. Finally, collaborating with international travel agencies can optimize the sector and increase spending from neighboring markets such as Japan, China, Hong Kong, Vietnam, Korea, and the Philippines.
Regarding travel-related characteristics, the length of stay is also linked to tourists’ sensitivity to price changes in accommodation, food, transportation, and shopping. For longer-stay tourists, premium services at higher prices may be appealing, while competitive pricing could attract shorter-stay tourists (Atsız et al., 2022; Bernini & Galli, 2022; Boto-García & Baños Pino, 2024; Gemar et al., 2022; Jackman et al., 2020). Marketing strategies should highlight the value of more extended stays or cost-effective options based on the length of stay. Repeat visitors, especially within the transportation industry, are responsive to price changes, making it beneficial to design loyalty programs, personalized offers, and targeted marketing to encourage return visits (Jackman et al., 2020; Nowak et al., 2024; Pai, Lee et al., 2024; Phan et al., 2024). Since travel planning can significantly impact the spending preferences of tourists visiting Taiwan, business travel providers within the tourism industry can use this information to create pricing strategies and promotional offers catering to those planning their trips; they can also develop flexible and customizable products and services to meet the needs of these travelers (Kozak et al., 2008; Massidda et al., 2022; Pak, 2020; Park et al., 2020; Phan et al., 2024).
Recent studies, such as Y. Li et al. (2024) and Phan et al. (2024), offer a more nuanced perspective by integrating digital financial inclusion and economic growth into tourism demand forecasting. These elements may affect tourists’ price sensitivity in ways that differ from traditional models, particularly considering the global economic uncertainties and the continuing impacts of the pandemic on travel behaviors (Falk et al., 2023). For example, Y. Li et al. (2024) propose that advancements in digital financial inclusion could increase price sensitivity among younger, tech-savvy tourists regarding “luxury” items like food and transportation. Recent research underscores shifting spending patterns influenced by evolving tourism trends, particularly in the post-pandemic landscape. Skare et al. (2023) and Orea-Giner and Fusté-Forné (2023) highlight the growing significance of personalized and unique tourism experiences, which resonates with our findings that tourists prioritize comfort, authenticity, and convenience. Similarly, Okumus (2021) notes that food tourism is becoming increasingly important, aligning with our observation that food is a luxury item for international tourists. Furthermore, some studies, including those by Sharma and Khanna (2023), Song et al. (2023), and Orea-Giner and Fusté-Forné (2023), reveal a rising price sensitivity in categories such as food and transportation in the post-pandemic context. These insights corroborate our findings, particularly concerning the price elasticity in food and transportation expenditures. This comparison enhances the relevance of our results by ensuring they align with current trends in tourism expenditure elasticity.
Regarding individual socioeconomic characteristics, gender significantly correlates with tourist spending habits (Y.-J. Ahn et al., 2020; Atsız et al., 2022; Phan et al., 2024). To attract more female tourists, businesses should develop targeted marketing strategies by offering discounts and special deals on food, transportation, shopping, and entertainment. Importantly, cultural sensitivity and inclusivity should be considered when developing new travel strategies. Since not all female tourists have the same preferences, businesses must tailor their offerings to each income segment by considering the relationship between income levels and expenditure elasticity. When developing marketing strategies and pricing structures, businesses within Taiwan’s tourism industry must consider the relationship between income levels and expenditure elasticity. Businesses can provide budget-friendly options and promotions for low-income tourists, along with luxury experiences and high-end amenities for high-income tourists (Aguiló et al., 2017; Balcilar et al., 2021; T.-S. Chen et al., 2022; Inchausti-Sintes et al., 2021).
Expenditure elasticities differ among age groups. Gen X and Y tourists emphasize quality, convenience, and personalized experiences, while Gen Z tourists tend to focus on affordability, value, and a range of dining options (Lin et al., 2023; Orea-Giner & Fusté-Forné, 2023). Higher-educated tourists have more influence on expenditure elasticities of accommodation and food (Aguiló et al., 2017). This group prefers to enjoy eco-friendly products and services, such as accommodation and farm-to-table dining experiences or cultural immersion activities. This study aligns with recent findings by Phan et al. (2024), which highlight that socioeconomic factors such as gender, income, and age significantly influence consumer spending habits. For example, female tourists tend to spend more on food and entertainment, while younger tourists, especially those from Generation Z, prioritize affordability and an array of options. Additionally, higher-income tourists generally exhibit less sensitivity to price changes and are more willing to invest in luxury experiences. Recent studies, such as Skare et al. (2023) and Lin et al. (2023), emphasize the growing importance of targeted marketing strategies based on demographic segmentation to effectively engage specific tourist segments, including Generation Z and affluent tourists seeking high-end experiences. This study recommends that businesses create targeted marketing campaigns for different demographics, such as promotions for women and budget-conscious tourists while showcasing luxury services for high-income and older tourists. Policymakers should work with businesses to develop inclusive tourism experiences that attract diverse groups, including women, Gen Z travelers, and wealthy international visitors.
For policymakers, the findings underscore the necessity of designing tourism strategies that enhance overall visitor satisfaction while addressing the needs of budget-conscious travelers. Policies should focus on providing value-oriented services, particularly in price-sensitive areas such as food and transportation, to ensure greater accessibility and appeal to diverse segments of tourists. This aligns with studies by Assaf et al. (2022) and Skare et al. (2023), which emphasize that recovery strategies in tourism must remain flexible to adapt to external economic uncertainties and market fluctuations. Recognizing these economic challenges enables policymakers to design resilient and adaptive measures that mitigate risks during periods of uncertainty. Furthermore, policymakers should acknowledge the growing influence of digital technologies—such as mobile payment systems and online booking platforms—on tourist behaviors, particularly in shaping price sensitivity and expenditure decisions. Some studies, such as Y. Li et al. (2024) and Okumus (2021), indicate that digital integration enhances convenience, leading to shifts in spending patterns and enabling businesses to capture greater demand through targeted promotions and seamless booking systems.
In order to foster sustainable growth, policymakers should prioritize initiatives that enhance tourist satisfaction through investments in infrastructure improvements, superior service quality, and enriched visitor experiences. For instance, governments should improve public transportation systems, urban amenities, and cultural attractions. These improvements can contribute to more favorable tourist perceptions and increased expenditure, supported by Disegna and Osti (2016) and Boto-Garcia et al. (2021). Additionally, attractive policies that promote longer stays—such as streamlined visa extension programs or promotional travel packages—can generate significant economic benefits by encouraging tourists to allocate higher budgets for accommodation, dining, and cultural activities. This approach resonates with findings by Barros and Machado (2010) and Smolčić Jurdana and Soldić Frleta (2017), who highlight the positive economic impact of extended visitor stays. Inclusive tourism strategies should also prioritized, focusing on catering to the preferences of diverse traveler demographics. Both policymakers and businesses can design tailored tourism experiences for groups such as women travelers, Gen Z tourists, and high-income international visitors. Phan et al. (2024) demonstrate that gender, age, and income levels significantly influence spending behaviors, necessitating customized approaches to meet the expectations of these segments. For example, offering luxury packages for high-income travelers, promoting eco-friendly tourism options for educated visitors, and providing affordable, inclusive experiences for Gen Z tourists could enhance destination competitiveness.
For businesses, sectors such as accommodation, shopping, and transportation exhibit differing levels of price elasticity, as noted by Massidda et al. (2022), Y.-J. Ahn et al. (2020), Y. Ahn et al. (2018), and Chang et al. (2013). Businesses should adopt targeted strategies to optimize revenue while maintaining customer satisfaction. For instance, the accommodation and retail sectors can adopt gradually increased prices by delivering high-quality services and emphasizing value-added offerings that justify higher costs. Leveraging digital financial solutions, such as mobile payment systems and dynamic pricing models, can help attract younger, tech-savvy tourists who are particularly responsive to price promotions and digital convenience (Y. Li et al., 2024; Okumus, 2021). Businesses ensure critical service excellence across key touchpoints, particularly in sectors like food and transportation, where satisfaction directly influences expenditure elasticity. Some studies, such as Boto-Garcia et al. (2021) and D’Urso et al. (2020), demonstrate that satisfied tourists allocate a larger share of their budgets to these categories. Businesses can capitalize on the growing demand for food tourism by offering unique experiences, such as farm-to-table dining, interactive cooking classes, or local culinary tours (Knollenberg et al., 2021; Orea-Giner & Fusté-Forné, 2023). Similarly, transportation businesses can stimulate demand by enhancing convenience and comfort, offering services such as premium transfers and seamless connectivity, particularly for repeat visitors.
Digital marketing strategies, particularly on social media platforms, can amplify demand by encouraging satisfied tourists to share their experiences, driving organic growth and improving brand visibility. User-generated content positively influences perceptions of quality and value, as highlighted by Skare et al. (2023) and Disegna and Osti (2016). In order to optimize revenue, businesses can create tailored packages for different traveler segments—for example, discounted deals for budget-conscious tourists and premium offerings for high-income or long-stay travelers. Highlighting extended stays, for instance, can attract value-oriented tourists, while exclusive amenities appeal to higher-spending demographics (Aguiló et al., 2017; Barros & Machado, 2010). Businesses should also implement personalized marketing campaigns based on demographic factors such as gender, income level, and generational preferences. Targeting female tourists with curated shopping experiences, transportation discounts, or group travel packages can drive spending (Phan et al., 2024). Simultaneously, Gen Z tourists, who prioritize affordability, can be reached through budget-friendly promotions, while Gen X and older travelers respond better to personalized, high-quality services (Lin et al., 2023).
Conclusions, Limitations, and Future Research
Our study estimates price and expenditure elasticities across five categories (i.e., accommodation, food, transportation, shopping, and miscellaneous). We also consider the influence of tourism satisfaction, travel-related factors, and socioeconomic characteristics on expenditure elasticities. We employ the TTB’s dataset over 2016 to 2021 with a sample size of 20,574 international visitors by using the AIDS and OLS approaches.
The AIDS analysis reveals that inbound tourists in Taiwan are highly price-sensitive, particularly regarding food, transportation, and miscellaneous (e.g., entertainment) items. This implies that even small price changes can significantly impact the expenditure elasticity of demand, leading to adjustments or exploring alternative options. Due to interdependencies, price changes in one expenditure category can affect demand in others. To be specific, food, transportation, and miscellaneous items are highly price-sensitive, while accommodation and shopping are less elastic. For instance, tourists prioritize affordable dining and discounted transportation but may spend more on unique shopping experiences.
The OLS analysis shows that expenditure elasticities are influenced by satisfaction, travel distance, length of stay, income, education, and age. Higher satisfaction leads to increased spending on accommodation, transportation, and shopping, while food and entertainment are budget-friendly. Female tourists are more elastic in their expenses, especially food, transportation, shopping, and miscellaneous items. Low-income tourists prioritize accommodation, food, and miscellaneous items, while high-income tourists spend more on all categories. Generational differences exist in price sensitivity, with Gen Z being more sensitive to food expenses. Education positively correlates with spending on accommodation and food. Overall, tourism demand is impacted by overall satisfaction, travel factors, and socioeconomic traits. Positive experiences, accommodation quality, and available activities influence tourists’ decisions to recommend or revisit a destination.
The findings provide key implications for policymakers and businesses to improve tourism strategies. Policymakers should manage prices in highly elastic areas, such as food and transportation, to keep them affordable. Offering subsidies or discounts during off-peak times can help reduce price sensitivity and stabilize demand. Investing in service quality, infrastructure, and diverse cultural offerings can boost tourist satisfaction, leading to increased spending and loyalty. Policies that encourage repeat visits or target high-income tourists can maximize economic benefits due to their higher spending habits. For businesses, it’s important to create offerings for specific demographics, such as budget-friendly options for younger visitors and premium experiences for those with higher spending capacity. Businesses can employ advanced analytics to support dynamic pricing and personalized travel packages that cater to varying tourist preferences. Additionally, businesses can offer discounts or flexible pricing for younger, budget-conscious tourists while providing unique experiences for older, wealthy tourists to attract a wider audience. Stakeholders can strengthen the tourism sector’s sustainability and competitiveness by addressing price sensitivity and enhancing satisfaction with targeted strategies.
Our study has limitations, including potential memory bias in expenditure reports that could affect generalizability. Participants may not accurately remember or report their actual expenses, which could lead to inaccuracies in the data; nevertheless, the relatively brief average stay in Taiwan should minimize the impact of memory bias. Future research could implement innovative data collection methods, such as real-time expenditure tracking through mobile applications or in-trip surveys, to ensure the accuracy and reliability of the data.
Future research could apply the AIDS model in tourism demand analysis, extending to areas like substitution effects, forecasting, market segmentation, and policy analysis, providing valuable insights for strategic decision-making and destination marketing strategies. Additionally, examining expenditure patterns among diverse tourist segments—such as repeat visitors, budget-conscious visitors, and those on extended stays—could provide a more nuanced understanding of their spending behaviors and motivations. Notably, future research expands this topic to include various destinations, particularly across different Asian countries, which would not only validate our findings but also compare regional or cultural differences in tourism demand. This broader approach would enhance the generalizability of the results and contribute to the global applicability of tourism demand models. Future research can significantly advance the field of tourism demand analysis and effectively address current limitations.
Footnotes
Appendix
The Descriptive Information on Expenditure Categories and Currency for International Visitors from Other Countries from 2016 to 2021.
| Unit: US dollars/per day | ||||||||
|---|---|---|---|---|---|---|---|---|
| Mean | ||||||||
| Country | Obs. | Accommodation | Food | Transportation | Shopping | Miscellaneous | Total | Currency |
| (1) | (2) | (3) | (4) | (5) | (6) | (7) | (8) | (9) |
| 2016 | ||||||||
| Japan | 621 | 137.93 | 41.14 | 17.20 | 33.31 | 10.95 | 240.52 | Japanese yen |
| China | 871 | 80.94 | 43.85 | 27.64 | 81.50 | 15.29 | 249.22 | Chinese yuan |
| Korea | 721 | 78.65 | 45.18 | 23.67 | 60.01 | 10.42 | 217.93 | South Korean won |
| Philippines | 100 | 82.51 | 29.02 | 17.93 | 44.04 | 6.24 | 179.74 | Philippine peso |
| Thailand | 114 | 36.48 | 34.23 | 19.13 | 46.68 | 4.65 | 141.17 | Thai baht |
| Vietnam | 134 | 29.57 | 28.05 | 15.78 | 42.83 | 6.16 | 122.38 | Vietnamese dong |
| Malaysia | 208 | 59.95 | 30.21 | 23.60 | 51.57 | 10.50 | 175.83 | Malaysian Ringgit |
| United States | 229 | 67.21 | 28.05 | 15.81 | 24.75 | 13.36 | 149.18 | US dollar |
| Canada and Europe | 295 | 69.87 | 27.05 | 16.07 | 16.04 | 9.24 | 138.27 | Canadian dollar and European euro |
| 2017 | ||||||||
| Japan | 648 | 81.76 | 35.81 | 16.06 | 31.90 | 11.09 | 176.63 | # |
| China | 1,584 | 54.62 | 43.07 | 23.56 | 76.30 | 10.63 | 208.19 | # |
| Korea | 359 | 58.44 | 52.60 | 18.97 | 43.22 | 7.81 | 181.03 | # |
| Philippines | 114 | 81.70 | 28.73 | 17.75 | 43.60 | 6.18 | 177.96 | # |
| Thailand | 137 | 36.12 | 33.89 | 18.94 | 46.22 | 4.60 | 139.77 | # |
| Vietnam | 150 | 29.28 | 27.77 | 15.62 | 42.40 | 6.10 | 121.17 | # |
| Malaysia | 229 | 47.79 | 34.37 | 22.64 | 52.91 | 18.62 | 176.33 | # |
| Singapore | 163 | 65.29 | 54.43 | 36.67 | 64.09 | 7.49 | 227.97 | Singapore dollar |
| Indonesia | 96 | 55.24 | 29.41 | 15.62 | 33.88 | 15.06 | 149.21 | Indonesian rupiah |
| United States | 254 | 61.80 | 33.69 | 17.09 | 17.54 | 8.91 | 139.04 | # |
| Canada and Europe | 173 | 62.02 | 32.92 | 16.58 | 25.84 | 7.27 | 144.62 | # |
| 2018 | ||||||||
| Japan | 674 | 82.96 | 39.34 | 16.03 | 31.63 | 10.52 | 180.49 | # |
| China | 1,345 | 54.67 | 50.72 | 24.35 | 75.52 | 12.85 | 218.13 | # |
| Korea | 391 | 69.19 | 49.59 | 17.69 | 34.75 | 8.07 | 179.30 | # |
| Philippines | 198 | 49.08 | 45.97 | 27.15 | 47.11 | 13.30 | 182.61 | # |
| Thailand | 116 | 44.81 | 40.33 | 21.14 | 54.06 | 8.68 | 169.02 | # |
| Vietnam | 178 | 21.04 | 30.98 | 15.17 | 43.77 | 7.44 | 118.39 | # |
| Malaysia | 145 | 48.51 | 47.71 | 32.15 | 65.60 | 16.78 | 210.74 | # |
| Singapore | 211 | 39.84 | 45.01 | 35.09 | 58.69 | 12.54 | 191.16 | # |
| Indonesia | 79 | 38.27 | 26.74 | 21.93 | 32.12 | 19.09 | 138.16 | # |
| United States | 316 | 51.94 | 38.90 | 17.27 | 26.51 | 24.18 | 158.81 | # |
| Canada and Europe | 359 | 62.66 | 35.20 | 20.09 | 47.32 | 7.87 | 173.15 | # |
| 2019 | ||||||||
| Japan | 808 | 83.77 | 37.84 | 15.03 | 30.56 | 11.62 | 178.82 | # |
| China | 1,643 | 68.12 | 53.46 | 26.66 | 72.63 | 20.80 | 241.67 | # |
| Korea | 487 | 100.88 | 54.71 | 22.84 | 45.90 | 8.98 | 233.31 | # |
| Philippines | 245 | 49.00 | 34.54 | 21.56 | 42.89 | 8.66 | 156.66 | # |
| Thailand | 185 | 54.45 | 42.71 | 19.58 | 52.53 | 8.58 | 177.84 | # |
| Vietnam | 168 | 37.18 | 30.82 | 18.07 | 66.16 | 9.75 | 161.98 | # |
| Malaysia | 185 | 65.66 | 49.46 | 31.67 | 55.32 | 16.81 | 218.91 | # |
| Singapore | 239 | 55.00 | 42.73 | 28.77 | 46.64 | 18.86 | 191.99 | # |
| Indonesia | 111 | 43.71 | 28.30 | 17.25 | 39.22 | 10.09 | 138.57 | # |
| United States | 290 | 62.18 | 41.84 | 19.82 | 33.23 | 12.61 | 169.67 | # |
| Canada and Europe | 476 | 68.95 | 35.85 | 19.53 | 25.62 | 9.14 | 159.09 | # |
| 2020 | ||||||||
| Japan | 319 | 62.68 | 26.33 | 10.52 | 11.31 | 7.26 | 118.10 | # |
| China | 513 | 34.77 | 29.40 | 11.98 | 13.75 | 12.32 | 102.23 | # |
| Korea | 234 | 66.62 | 33.75 | 15.18 | 6.06 | 7.57 | 129.17 | # |
| Philippines | 58 | 48.14 | 26.61 | 12.58 | 7.31 | 5.63 | 100.28 | # |
| Thailand | 86 | 26.40 | 33.95 | 13.06 | 3.77 | 8.67 | 85.86 | # |
| Vietnam | 56 | 47.71 | 22.74 | 10.40 | 2.44 | 5.23 | 88.53 | # |
| Malaysia | 161 | 52.54 | 32.48 | 13.94 | 7.39 | 10.33 | 116.69 | # |
| Singapore | 134 | 57.31 | 35.66 | 20.42 | 4.50 | 11.12 | 129.01 | # |
| Indonesia | 37 | 55.73 | 20.38 | 8.38 | 64.88 | 6.91 | 156.28 | # |
| United States | 676 | 59.17 | 20.91 | 7.22 | 8.09 | 12.84 | 108.23 | # |
| Canada and Europe | 323 | 49.98 | 17.10 | 6.52 | 11.24 | 12.70 | 97.53 | # |
| 2021 | ||||||||
| Japan | 75 | 62.06 | 14.06 | 7.92 | 16.16 | 11.19 | 111.40 | # |
| China | 256 | 34.43 | 17.11 | 5.58 | 19.64 | 17.33 | 94.09 | # |
| Korea | 86 | 65.96 | 18.13 | 7.14 | 8.66 | 12.21 | 112.10 | # |
| Philippines | 4 | 47.67 | 16.90 | 5.65 | 10.44 | 2.98 | 83.63 | # |
| Thailand | 13 | 26.14 | 11.42 | 3.05 | 5.39 | 14.91 | 60.91 | # |
| Vietnam | 2 | 47.24 | 10.95 | 7.62 | 3.49 | 3.10 | 72.40 | # |
| Malaysia | 106 | 52.02 | 17.80 | 7.63 | 10.56 | 10.22 | 98.23 | # |
| Singapore | 10 | 56.75 | 14.92 | 5.86 | 6.43 | 5.87 | 89.82 | # |
| Indonesia | 11 | 55.18 | 16.19 | 8.99 | 92.68 | 10.59 | 183.62 | # |
| United States | 1,025 | 32.70 | 18.16 | 6.02 | 14.99 | 20.68 | 92.54 | # |
| Canada and Europe | 340 | 49.48 | 16.93 | 6.45 | 11.13 | 12.57 | 96.57 | # |
| Total/Mean | 20,574 | 54.3 | 40.4 | 22.2 | 40.9 | 9.9 | 167.7 | |
Note.“#” denotes the same currency as mentioned above.
Funding
The author(s) received no financial support for the research, authorship, and/or publication of this article.
Conflicting Interests
The author(s) declared no potential conflicts of interest with respect to the research, authorship, and/or publication of this article.
Data Availability
Data will be made available on request.