
Abstract
This study aims to explore how and why human resource analytics, which involves using data analysis for HR-related decisions, is being adopted by Indian IT companies. It also seeks to understand the challenges faced in implementing these analytics and which analytical tools are commonly used. To achieve these goals, researchers collected and analyzed 478 responses from individuals working in the Indian IT industry. They used a software called AMOS version 21.0 to test their ideas. This software helps researchers understand relationships and patterns in data. The study found that certain factors, called “antecedents,” influence the adoption of HR analytics in IT organizations in India. It also revealed that problems with data, such as not having enough data or having data of low quality, were significant challenges in using HR analytics. Additionally, the research showed that many professionals in the Indian IT industry prefer using analytical tools like R and Power BI for HR analytics. The results of this study have important implications for businesses and HR professionals. By understanding the factors that influence the adoption of HR analytics, companies can make better decisions about how to implement these practices. Recognizing the challenges related to data quality and quantity can help organizations address these issues. Knowing which analytical tools are popular can guide companies in selecting the right tools for their HR analytics needs. Overall, this research provides valuable insights that can facilitate the adoption of HR analytics in various industries, not just in India. It’s important to note some limitations of this study. The research focused specifically on the Indian IT industry, so the findings may not apply equally to other sectors or regions. Additionally, the study used a specific software (AMOS version 21.0) and analyzed a specific number of responses (478), which could limit the generalizability of the results. Further research in different contexts and with larger samples may be needed to confirm these findings more broadly.
Introduction
Analytics is a course of action to draw insights from the data and support evidence-based decision-making (Shahbaz et al., 2019). The large volume of flow of data, irrespective of its nature, type, or structure has grown multi-fold times and challenged the resources to make it useful (Roberts, 2013). Many IT/ITES organizations in India made their mark and started to gain an advantage from analytics. Analytics Indian Magazine (AIM, 2021), stated in their reports that the market share for analytics increased to $45.4 billion in the financial year 2021 from $ 35.9 billion in the financial year 2020. Indian IT/ITES has also increased its share in the domain of analytics accounting for 23.4% of the total share. As per the reports, IT/ITES will contribute 41.5% market by 2026. The surveys related to analytics revealed that companies who adopted analytics in their work routine are generating higher returns (Narula, 2015). The benefit of adopting analytics is viewed from the decision-making processes of the organization extended to each functional unit (Davenport, 2013; Tanure & Gonzalez-Duarte, 2007).
The adoption of HR analytics has become increasingly crucial for organizations aiming to optimize their workforce, enhance decision-making, and maintain competitive advantage in today’s data-driven business environment (Álvarez-Gutiérrez et al., 2022; Debrah, 2002; Divestiture Implementation Committee, 2004). HR analytics refers to the use of data analysis techniques to make informed human resource decisions, impacting areas such as talent acquisition, performance management, and employee retention (Falletta, 2014; Marler & Boudreau, 2017; Tanure, 2005). In the Indian context, the potential for HR analytics is especially significant given the country’s diverse and rapidly expanding workforce across sectors like IT, MSMEs, and manufacturing (Bhardwaj & Mishra, 2021).
Background and Context
The modern business landscape is undergoing a profound transformation, driven by the exponential growth of data and the increasing reliance on technology to drive decision-making. Within this shifting paradigm, human resource (HR) management has not remained immune but has instead embraced the concept of HR analytics with open arms (Boxall & Purcell, 2003). India, as an emerging economy, presents unique challenges and opportunities for the adoption of HR analytics. Many organizations still struggle with poor data quality, lack of structured data, and resistance to technological changes (Gupta et al., 2020). These challenges are compounded by variations in the technological proficiency of employees and differing levels of organizational support for analytics initiatives (Vargas et al., 2018). As organizations in India transition toward a more digital-first approach, HR analytics is becoming a strategic tool for unlocking productivity and employee engagement (Verma & Bhatia, 2020).
Emergence of HR Analytics: HR analytics, also known as people analytics or talent analytics, represents a significant departure from traditional HR practices. It involves the systematic gathering and analysis of employee data to inform HR decisions and strategies. This data-driven approach allows organizations to make more informed decisions regarding hiring, talent management, performance evaluation, and workforce planning.
Global Adoption of HR Analytics: The global business community has recognized the potential of HR analytics in transforming HR from a support function to a strategic business partner (Bryman & Bell, 2007). HR analytics has been widely adopted across different industries and regions, with organizations reaping substantial benefits in terms of improved recruitment, retention, and overall workforce effectiveness.
The Indian Context: In the context of India, a rapidly growing economy and a burgeoning IT industry are particularly significant. India has emerged as a global IT hub, attracting both domestic and international companies. This growth has resulted in increased competition for talent, making HR analytics an imperative for companies looking to optimize their workforce. HR analytics plays a crucial role in improving talent acquisition, employee performance, workforce planning, and engagement. Predictive analytics enhances recruitment by identifying candidates most likely to succeed, thereby reducing turnover (Kaur, 2020; Mishra & Garg, 2015; Minbaeva, 2018). It also enables real-time analysis of employee productivity and supports personalized development programs (Saha et al., 2020). HR analytics provides predictive insights for workforce planning, helping organizations adapt to fluctuating demands, particularly in volatile industries (Bhargava & Bansal, 2018). Furthermore, it fosters employee engagement by analyzing feedback to implement targeted interventions (Khatun et al., 2019), while ensuring compliance with India’s complex labor regulations and promoting diversity (Gupta et al., 2020). Verma and Bhatia (2020) stated that analytics aids in optimizing labor costs by identifying inefficiencies, contributing to cost-effective workforce management, and supports strategic decision-making in areas such as promotions and restructuring (Kumar et al., 2020). The Indian scenario presents a unique blend of opportunities and challenges for HR analytics adoption, making it a compelling area for study.
The wave of analytics has influenced the working in every segment of the organization but has largely transformed the role of human resource (HR) practitioners from daily task handlers to strategic partners (Success Factors, 2015; Vargas et al., 2018). HR executives started to make use of data to form strategies and create a competitive edge in their work (Angrave et al., 2016). The contributions made by HR professionals through analytics help them in evidence-based decision-making and support the organization in its performance (Brown & Gottlieb, 2016). In 2005, Levenson stated that HR professionals exercise a shift from metrics to the analysis of critical issues of human capital. In present times, top-performing organizations have moved to Analytics 3.0 where HRs exert themselves for quick adoption of analytics by overcoming the challenges (Nocker & Sena, 2019). Despite all great efforts, the adoption of analytics needs deep thought to make it comfortable for its users.
The studies and research on HR Analytics showed a lack of scientific evidence concerning the adoption of analytics among HRs (Levenson, 2011; Marler & Boudreau, 2017). The introduction of numbers, statistics, technology, and machine learning created an unknown fear to use among its users (Deiser, 1994; Vidgen et al., 2017). Pre-requisites of adoption demanded attention for ease in adoption (Analytics et al., 2010). While considering the various aspects of adoption, the tools to be used created a wave of concern in their way (Chalutz Ben-gal, 2019). The strong fear has created predetermined notions among the users of analytics making the process of adoption delayed in many cases. Studies stated that there lie some necessities like structured data (Rogers, 2013), tool availability (Chalutz Ben-gal, 2019), planned managed support (Lian et al., 2014), empowerment and inclination to adopt (Rasmussen & Ulrich, 2015).
In India, HR analytics adoption is still in its nascent stages, particularly in MSMEs (Micro, Small, and Medium Enterprises) and large IT firms. Bhardwaj and Mishra (2021)highlight that Indian organizations face significant challenges related to data infrastructure, organizational culture, and resource constraints, which can hinder the successful implementation of HR analytics. However, despite these challenges, the increasing reliance on data-driven HR processes presents an opportunity for organizations to leverage HR analytics as a competitive advantage. Gupta et al. (2020) found that Indian firms that successfully adopt HR analytics experience improvements in workforce optimization and employee satisfaction.
This empirical study focuses on verifying the antecedents of analytics adoption, tools adopted, and challenges in the implementation of HR analytics. In an attempt to clarify the acceptance or rejection of any technology Davis (1989) through the Technology Acceptance Model (TAM) focused on perceived usefulness and ease of use. Many years of research in the field of information technology and systems stem from many competing models and Venkatesh et al. (2003) formulated, tested, and validated, the Unified Theory of Acceptance and Use of Technology (UTAUT) which was a combination of the Theory of Reasoned Actions (TRA; Ajzen and Fishbein, 1980) TAM and Theory of Planned Behavior (TPB; Ajzen, 1991).
The UTAUT model (Venkatesh et al., 2003) posits that four key constructs—performance expectancy, effort expectancy, social influence, and facilitating conditions—influence an individual’s intention to use technology. This theory has been widely applied in studies on technology adoption and is particularly relevant for examining how organizational and social factors drive HR analytics adoption in the Indian context. Indian employees, for instance, may be heavily influenced by social factors, such as the opinions of senior management and peers, in their decision to adopt new technologies (Gupta et al., 2020). The Technology Acceptance Model (Davis, 1989) explains technology adoption by focusing on perceived usefulness and ease of use. In the context of HR analytics, this model helps us understand how HR professionals perceive the complexity and potential benefits of analytics tools. As Indian organizations implement HR analytics, effort expectancy (how easy the technology is to use) plays a critical role in determining adoption rates (Marler & Boudreau, 2017). Theory of Planned Behavior (Ajzen, 1991) adds another layer of understanding by emphasizing behavioral intentions and perceived behavioral control. In the context of this study, TPB helps explain how HR professionals’ beliefs about their ability to use HR analytics (self-efficacy) affect their intention to adopt the technology. In India, the lack of digital skills among HR professionals can limit their self-efficacy, making organizational support even more critical (Verma & Bhatia, 2020). These theoretical models not only provide insight into the antecedents of adoption but also highlight the barriers that organizations must overcome to facilitate the successful implementation of HR analytics. To develop a better understanding of the adoption of HR Analytics, we delve into the antecedents of HR Analytics, critically investigating the peculiar challenges in implementation in the Indian context process and later proposing the model of adoption of HR analytics.
Research Gap and Rationale
Despite the global popularity of HR analytics, a significant research gap exists when it comes to understanding the specific factors that influence its adoption in the Indian context. Several compelling reasons underscore the need to address this gap:
Diverse Business Ecosystem: India’s business landscape is characterized by its diversity, with organizations ranging from startups to multinational corporations. This diversity raises questions about the universality of HR analytics adoption factors identified in studies conducted in other regions.
Socio-Cultural Factors: India's rich cultural diversity and unique workplace dynamics necessitate an exploration of how socio-cultural factors influence HR analytics adoption. Factors such as hierarchical structures, communication norms, and leadership styles may significantly impact the adoption process.
Economic Considerations: Economic factors play a crucial role in HR analytics adoption. Understanding how cost considerations, budget allocations, and resource constraints affect the adoption process is essential for both practitioners and policymakers.
Lack of Indian-Specific Research: While there is an abundance of global research on HR analytics, there is a dearth of Indian-specific studies that delve into the challenges, opportunities, and antecedents of adoption in the Indian business context.
Research Objectives
The primary objectives of this research study are to:
Identify Antecedents: Explore and identify the key antecedents, that is, the factors that influence the decision of Indian organizations, especially those within the IT industry, to adopt HR analytics. Antecedents may include organizational, cultural, and economic factors.
Analyze Adoption Impact: Examine the impact of these identified antecedents on the adoption of HR analytics in Indian organizations. Understanding which factors have a substantial influence can guide organizations in their adoption strategies.
Examine Implementation Challenges: Investigate the primary challenges faced by Indian organizations when implementing HR analytics. Special attention will be given to unique challenges specific to the Indian context.
Identify Common Analytical Tools: Identify and analyze the most commonly used analytical tools for HR analytics in the Indian IT industry. This information can guide organizations in selecting appropriate tools for their needs.
Propose a Model: Develop a model that encapsulates the antecedents of HR analytics adoption specific to Indian IT organizations. This model can serve as a valuable resource for organizations aiming to adopt HR analytics effectively.
Literature Review
This study uses the Unified Theory of Acceptance and Use of Technology to examine the adoption of HR adoption. Venkatesh et al. (2003) describe the user’s intention to use the technology and thus define perceived usefulness for the adoption. He further augmented the concept and added performance expectancy, effort expectancy, social influence, and current situation as constructs. Applying the studies and research, HR analytics was identified and related to the availability of data and tools. Based on past studies and research these constructs hold relevance as authors have noticed and reported that HR professionals fall short in acceptance of new technology and innovation (Cartwright & Cooper, 1996; Cartwright & Schoenberg, 2006; Dahlom et al., 2020; LaValle et al., 2011)and together with machine learning, artificial intelligence and data modeling added the complexity in the working and adoption process of analytics for HR users (Locke, 2001; Rogers, 2013).
Initiating the use of analytics requires the engagement of individual users that develops their thoughts on acceptance or rejection. Some pre-requisites are associated with the adoption process (George & Kamalanabhan, 2016; Levenson, 2005; Rogers, 2003). Rejection of adoption is not only a decision for not adopting rather it holds a view where the user has a positive attitude but uncertainties like exposure to new technology, risk of unknown responsibilities, accountability, and lack of training hold the interest back. Adoption is a full course of decision action associated with the uncertainties and limitations for its users (Vargas et al., 2018).
The availability of structured data, tools, training modules and management support usually increases the adoption rate (Gilham, 2000; PWC, 2014; Thomas & Davenport, 2015). An individual’s decision is influenced by many factors, as Venkatesh et al. (2003) stated, the new technology adoption involves factors like self-push, comfort with quantitative aspects of working, society and social groups, efforts required and expected performance expectations, and availability of resources. These factors are associated with the adoption of analytics and a user will accept the change if it’s institutionalized to use. Figure 1 represents the proposed model for the adoption of HR analytics and its relationship with the identified antecedents. Figure1 shows the proposed framework representing identified antecedents of HR analytics adoption and its relationship with the adoption of HR Analytics.

Proposed research framework.
General Self-Efficacy
In 2001, Ajzen stated in his studies that perceived behavioral control is different from self-efficacy. The use of any technology is not related to what a person has done in past or is willing to do in the future (Ajzen, 2001; Compeau & Higgins, 1995; Shahbaz et al., 2019). The factor is related to attitude, acceptance to change, and willingness to find solutions. Davenport (2013) stated that adopting analytics is like adopting technology.
We included this as a factor to study as the complexities of analytics are derived from the integration of technology and the usefulness of the information. This factor has the potential to study the impact of attitudes, convenience, and willingness to use HR analytics. The difficulty and ease to adopt vary from person to person. A study by Vargas (2015) researched and identified self-efficacy as an antecedent to HR analytics adoption.
Quantitative Self-Efficacy
Understanding the complexities of the adopting the new technology and the need to widen the scope of knowledge, quantitative self-efficacy is included in to study as an antecedent of HR analytics adoption (Gibbs, 2007). Studies have shown that attitudes are influenced by knowledge and self-efficacy is dependent on the belief that a person can perform (Ajzen & Fishbein, 2000). Every person has different abilities to learn and practice. Mathematics is one of the subjects which holds the interest of some, and some consider it to be difficult. Many surveys reported that people had experienced anxiety about numbers, many find mathematics a difficult subject, and many expressed fears of mathematics. Mathematical proficiency and knowledge vary from person to person and are attitudinal (Chitra & Srivaramangai, 2018).
Adoption of HR analytics is impacted by quantitative self-efficacy as users’ acceptance of numbers will determine the success of analytics. We studied mathematics impact as quantitative self-efficacy in the paper to know the individual attitude toward numbers. We studied quantitative self-efficacy to know if there is any relation between numbers with the adoption process of HR analytics (Brown et al., 2015, Vargas, 2015). The analytics majorly deal with numbers in form of metrics and scoreboards, if users expressed fear or stress toward the data, it could show a negative impact on adoption (Björkman & Søderberg, 2003).
Effort Expectancy
Venkatesh et al. (2012) postulated individual inclination for persuasion or adopting new as a factor of acceptance of technology. Learning attitude makes a big difference in the adoption of analytics for those who are not technology inclined. The readiness to learn, adopt new, and accept changes in the work with commitment is a new dimension to knowing the impact on adoption (Brockbank, 2018).
The acceptance of analytics is influenced by attitudes, a user with a positive approach to work and acceptance will show positive results and the user with a negative attitude might not be able to perform as expected (Ajzen & Fishbein, 2000). It may also reflect the conflicting interest and opinions related to technology. Behavior and approach to looking shows relevance to the adoption process (Lee, 2012). Attitude and behavior toward learning are taken as effort expectancy to determine if there is any relation with HR analytics adoption (Vargas, 2015; Venkatesh et al., 2012).
Performance Expectancy
Johnston and Warkentin (2010) and Venkatesh et al. (2012) stated that every individual has their career plan and aspirations, where they seek if adoption can improve their job performance. Individuals will be inclined to adopt any new technology only if they see a better performance or improved job quality. Although the new concept might not be easy to use, resulting in more learning sessions by the users. This may give negative results as all individuals might not think alike and refuse for upcoming challenges.
The difficulties and challenges not only have an impact on learning but on job performance also. The individuals may believe that the application will give them good results but that does not imply that the technology is easy to put into use and derive results. The user, team, and organization must structure or restructure themselves to make the application result oriented. Performance expectancy is another name for perceived usefulness (Davis, 1989). Performance expectancy is studied as an antecedent to the adoption of HR analytics to determine if it has any impact on adoption.
Data Availability
Data is a basis on which analytics is performed. Structured data is a constructive mode to draw insights (Venkatesh et al., 2012). HR has storage of data related to people, projects, and processes that they wish to administer for drawing insights and better decision making (Søderberg & Vaara, 2003; van der Togt & Rasmussen, 2017). Each department store data in its working format and metrics looks entirely different. This makes integration a difficult process (George & Kamalanabhan, 2016). Since efforts are required to streamline data to make it useful for analytics. The studies have recommended that the organizations need to structure their data and provide scope for analyzing after integration.
The half battle to analytics is to win with the right availability of accurate data. Davis (1989) mentioned that meeting the pre-requisites of new technology is a core element even before thinking of the knowledge required or the perception of its users. We study data availability as an antecedent of HR analytics adoption as the right data will lead to the right decision-making. We made an attend to study the data availability and adoption relationship (Johnston, 2006).
Tool Availability
To deploy new technology as practice the organization must make use of the appropriate systems, software, and tools. The efforts are required to provide the necessary skill sets to work on these tools to analyze the data, visualize, and make feasible decisions. Carlson and Kavanagh (2011) postulated that a new technique for viewing data has changed the organization’s evaluation process for human capital. The right application of knowledge and tools has become a necessity to make the best use of analytics on HR data. The studies have claimed that we are short of the skilled analyst in the HR domain and we need to train HR professionals.
The practice of new technology is feasible if have access to the tool at its dispersal else resulting in innovation with limitations. Every innovation would be a success if allowed to explore though analytics is not an innovation but a technology complexity for its users who come with many predetermined notions for its use (Johnston, 2006; Rogers, 1995; Vargas, 2015). We study tool availability to understand if it has an association with HR analytics adoption.
Social Influence
Individual thoughts, actions, and decisions are easily influenced by society and social circles. The adoption of HR analytics can be influenced by peer groups, social media, society, and annual reports of the organizations. If the HR practitioners consider the benefits, the adoption will be convenient but adversely if they reject then it will negatively impact the process. The desire to work on new tools can be just an attraction gained from the buzz created by the media but that necessary does not mean that it will be a success for all (Johnston, 2006).
The local, national and global reach of HRs in their work processes may create a medium to diffuse acceptance of the new technology. The adoption process has an impact on the peers and the organization directly. We study social influence as an antecedent of HR analytics to know its association with the adoption of HR analytics. This antecedent is subject to the degree to which users’ behavior and decisions are influenced by the social environment. The user can observe more value addition in their roles, jobs, and designations (Antila, 2005; Johnston & Warkentin, 2010; Venkatesh et al., 2012).
Challenges in Implementation of HR Analytics
Angrave et al. (2016) postulated in their research that HR professionals lagged in the race of data and insight. Many organizations still observe analytics as a cost rather than an investment for the future which has a definite outcome (Ransbotham & Kiron, 2017; Margherita, 2022; United Nations Conference on Trade and Development, 2004). The user stands toward a low skill-set and low desire to play with data (Hamilton & Sodeman, 2019). The research identified that the data security, operational risk, and lack of training created strong hurdles in the adoption process (Marsh, 2014; Naasz & Nadel, 2015; United Nations Conference on Trade and Development, 2000). HR practitioner age and education exposure also influenced the process. Reports expressed that the elderly HR experts denied practice new. Many thought its mathematics and difficult for them to cope with numbers in the workplace (Data and Analytics Global Executive Study and Research Report, 2014).
The analytics process itself turns into a challenge when not supported by symmetric data for integration. The necessary steps an organization must advocate to streamline the data in one format and make it accessible to the authorized person. The fear to take up new responsibilities and be accountable for the act is the next level. Studies have shown that HR users of analytical tools expressed discomfort and fear of failure (Angrave et al., 2016).
Analytical Tools
The user’s ability to discover insights from the data is largely dependent on the tool used (Massis, 2012). Some tools are totally coding-related (R and Python), some needs click work (Power BI), and some require drag and drop feature (Tableau). All these tools are supportive in analyzing and preparing meaningful dashboards and are completely dependent on the competence of the user. These tools gained importance lately for unique applications and artificial intelligent interfaces in data study and maintenance (Chalutz Ben-gal, 2019).
Research Methodology
Process of Research
The study was initiated by defining the problem and setting objectives. The review of the literature was done to identify gaps in the study and develop the constructs and the hypothesis for the adoption of HR analytics. The pivot study was done with 50 experts from the industry. Their suggestions and feedback were included in the study and thus questionnaire was circulated via social network sites for the collection of data from the HRs of the IT industry who are using HR analytics in their jobs. AMOS version 21.0 was used for analysis and testing.
Measure Development
The measures we adopted for the study were previously established. We used the same context with little modification to suit the purpose of the study. All the constructed antecedents of adoption of HR analytics were measured on a 7-point Likert scale which has a scoring range from 1 (strongly disagree) to 7 (strongly agree) (Marshall & Rossman, 1999). Seven items of general self-efficacy were adopted (Davis, 1989; Vargas, 2015), six-items of quantitative self-efficacy, four-items of effort expectancy and performance expectancy were adopted (Venkatesh et al., 2012; Vargas, 2015), five-items of social influence were adopted (Johnston & Warkentin, 2010), five-items of tool availability were adopted (Johnston, 2006; Vargas, 2015), four -items of data availability were adopted from (Johnston, 2006; Vargas, 2015). We have asked multiple choice on applications of HR analytics in a real work situation (Heuvel & Bondarouk, 2017; Lal, 2015). The challenges were asked with scoring of 1 (no), 2 (to some extend), and 3 (yes) which were adopted and modified (Mahalakshmi, 2018). Multiple response statement was used for analyzing the analytical tools and applications of HR analytics in the IT industry.
Research Design
The research adopted a quantitative, descriptive, and cross-sectional design, utilizing a survey-based approach to collect data (Miles & Huberman, 1994). This design was selected to empirically examine the antecedents, analytical tools, and challenges in the adoption of HR analytics, focusing on the Indian IT industry, specifically MSMEs and large organizations. The survey method allowed for the measurement of associations between constructs and the level of adoption of HR analytics. This design is instrumental in exploring relationships and gaining insights into behavioral intentions and organizational practices, aligning with the objectives of the study.
Data Collection Method
Data was collected using a structured questionnaire designed in Google Forms and distributed online. This method enabled efficient data collection from respondents spread across India, providing a geographically diverse sample. The questionnaire was developed based on established scales in the literature, adapted to the context of HR analytics in India. It consisted of multiple sections aimed at measuring the respondents’ views on the adoption, challenges, and tools used for HR analytics, as well as organizational characteristics and demographic information.
Pilot Study
Prior to the full-scale data collection, a pilot study was conducted with 50 prospective users of HR analytics. The purpose of the pilot study was to refine the questionnaire by assessing the reliability and validity of the scales and ensuring that the questions were clear, relevant, and unambiguous. Based on the feedback and results of the pilot study, minor adjustments were made to the wording and structure of the questionnaire. Construct validity was confirmed, and the measurement scales were further refined for the main study.
Survey Instrument and Constructs
The questionnaire was structured to measure various constructs related to the adoption of HR analytics, such as perceived ease of use, perceived usefulness, organizational readiness, data quality, and technological infrastructure. All the constructs were based on established theoretical frameworks and supported by previous studies (e.g., Gupta et al., 2020). The constructs were measured using Likert scales to quantify respondents’ agreement or disagreement with statements related to the adoption of HR analytics.
Sampling Strategy
The study targeted prospective end-users of HR analytics across the IT industry in India, both from Micro, Small, and Medium Enterprises (MSMEs) and large organizations. A non-probability purposive sampling method was employed to identify and select individuals who were directly involved with HR analytics within their organizations. A total of 520 respondents were initially approached, and 492 responses were received. After eliminating incomplete responses, 478 valid responses were retained for the final analysis. The choice of this sampling technique was driven by the need to obtain insights from respondents who had practical experience in using HR analytics, thereby ensuring the relevance and quality of the data.
The study appreciates the responses from 478 respondents of which females were 326 and males were 152. Among the data 266 were less than 40 years of age and 212 were above 40 years. Thirty-two respondents were holding doctorate degrees, 238 respondents were post-graduates, 154 were graduates and 54 had professional certifications. The respondents are working across MSME (Micro, Small, and Medium enterprises) and large organization of the IT industry in India. Two hundred eighty-nine respondents have experience of working on HR analytics and 189 respondents underwent training on HR analytics before putting data into practice, details are presented in Table 1.
Respondent’s Profile.

Results and Analysis
We used IBM-AMOS version 21.0 software to study the proposed model by applying structural equation modeling (SEM). The research and studies have proved that AMOS is a reliable and powerful tool to perform factor analysis and SEM (Gupta et al., 2020; Shahbaz et al., 2019). AMOS being a user-friendly interface enables the easy handling of graphical analysis and is suitable for confirmatory factor analysis (CFA) and SEM. We used SPSS version 21.0 to validate the data and test the reliability before SEM.
Analytical Tools Adopted by HR Professionals
We asked multiple response questions to our respondents about the analytical tools they are using at their workplaces. The results were analyzed on dichotomous analysis by counting “yes.” As per the results, R language is the most accepted and used analytical tool with 32.2% of response rate followed by Power BI (22.1%), Tableau (17.5%), Python (15.8%), SPSS (7.9%), and Visier (4.1%).
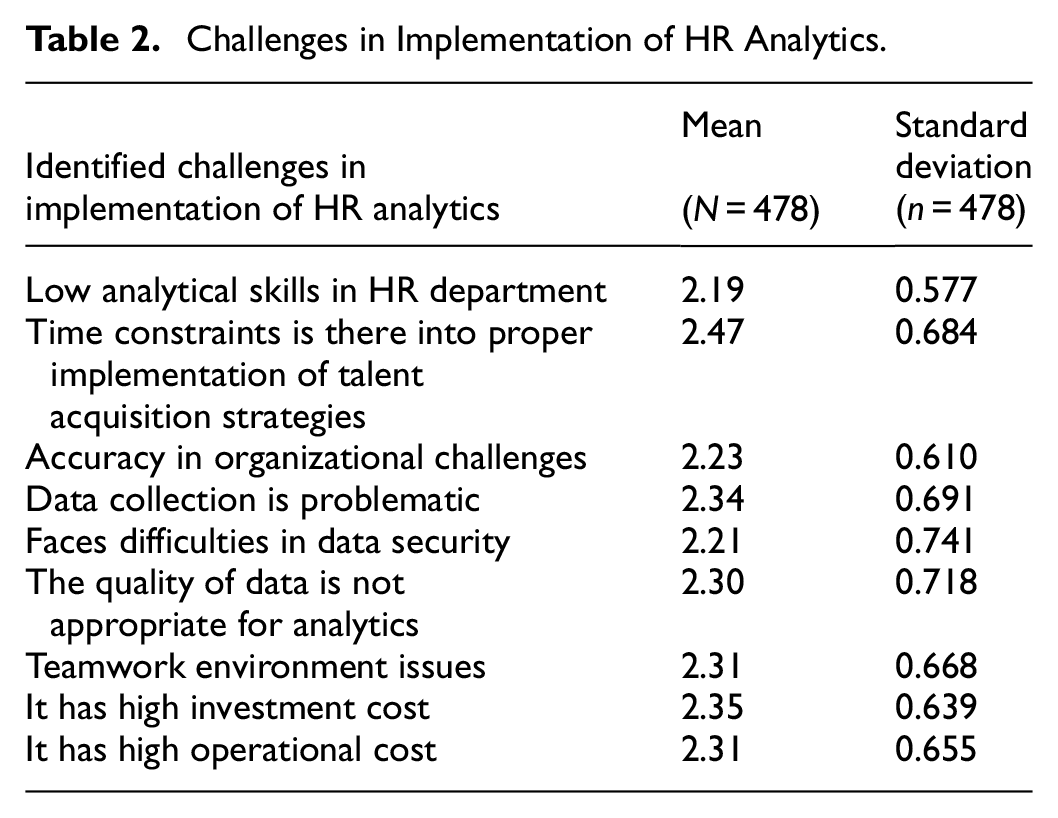
Challenges in Implementation of HR Analytics
Every new concept, technology or innovation invites some challenges. The case with HR analytics adoption is similar as the HR practitioners found them struggling with the numbers, systems, and technology (Rogers, 1983). Table 2 shows the mean values and standard deviation of the challenges in the implementation of HR analytics. All mean values are more than 2, which depicts HRs working in the IT industry in India agreeing that these challenges are their in adopting analytics. The HR professionals consider time constraints in the proper implementation of talent acquisition strategies as the biggest challenge (Mean = 2.47) followed by investment cost (Mean = 2.35) and problems in data collection (Mean = 2.34).
Challenges in Implementation of HR Analytics.
Common Bias Method
Podsakoff (2003) stated the challenge in form of common method variance to validate the results. Data is collected from all over India which passes by the effects of common method variance (CMV) in the data. The collection of data was made in different time periods, initially, the data was collected for the general self-efficacy, quantitative self-efficacy and effort expectancy as the antecedents of HR analytics adoption and later the data on tools, data availability, performance expectancy and social influence as the antecedents were collected. The receiving of suggestions from the experts were in different periods during the pilot study which resulted in the different time periods for the collection of data. Harman’s single factor test addresses the CMV issue stating that if one factor accounts for most of the covariance in the measures shows that the significant CMV exists. In the study, seven factors were identified whereas the first factor accounted for 43% of the variance which is less than 50%. Thus, the data approves that there is no CMV and is good for further analysis.
Reliability Test
The confirmation of antecedents of HR analytics is made through the reliability and validity of each variable. Cronbach’s alpha was conducted on the collected data. Table 3 represents the summary of Cronbach’s alpha test on each antecedent. Petersen Glen (1997) and Kataria et al. (2017) stated that the alpha > .7, accepts the data as reliable and finds it suitable for further study. Table 3 shows the values of all the variables above .7 and hence we accept the variables for further analysis.
Cronbach’s Alpha and KMO-Bartlett’s Test Results.

KMO and Bartlett’s Test
The KMO and Bartlett’s test was conducted to know the proportion of variance in the variables and to tests the hypothesis that the correlation matrix is an identity matrix. P-value less than .05 shows factors could be useful on the data. Table 3 shows the results of KMO and Bartlett’s test.
Correlation Matrix and Square Root of AVE
Table 4 shows the correlation matrix and square root AVE using AMOS to know the consistency and validate the proposed constructs of the model. According to the rule, square root of AVE should be greater than the correlation between the construct (Hair et al., 2010; Kataria et al., 2018). All the values are as per the threshold values.
Correlation Matrix and Square Root of AVE.
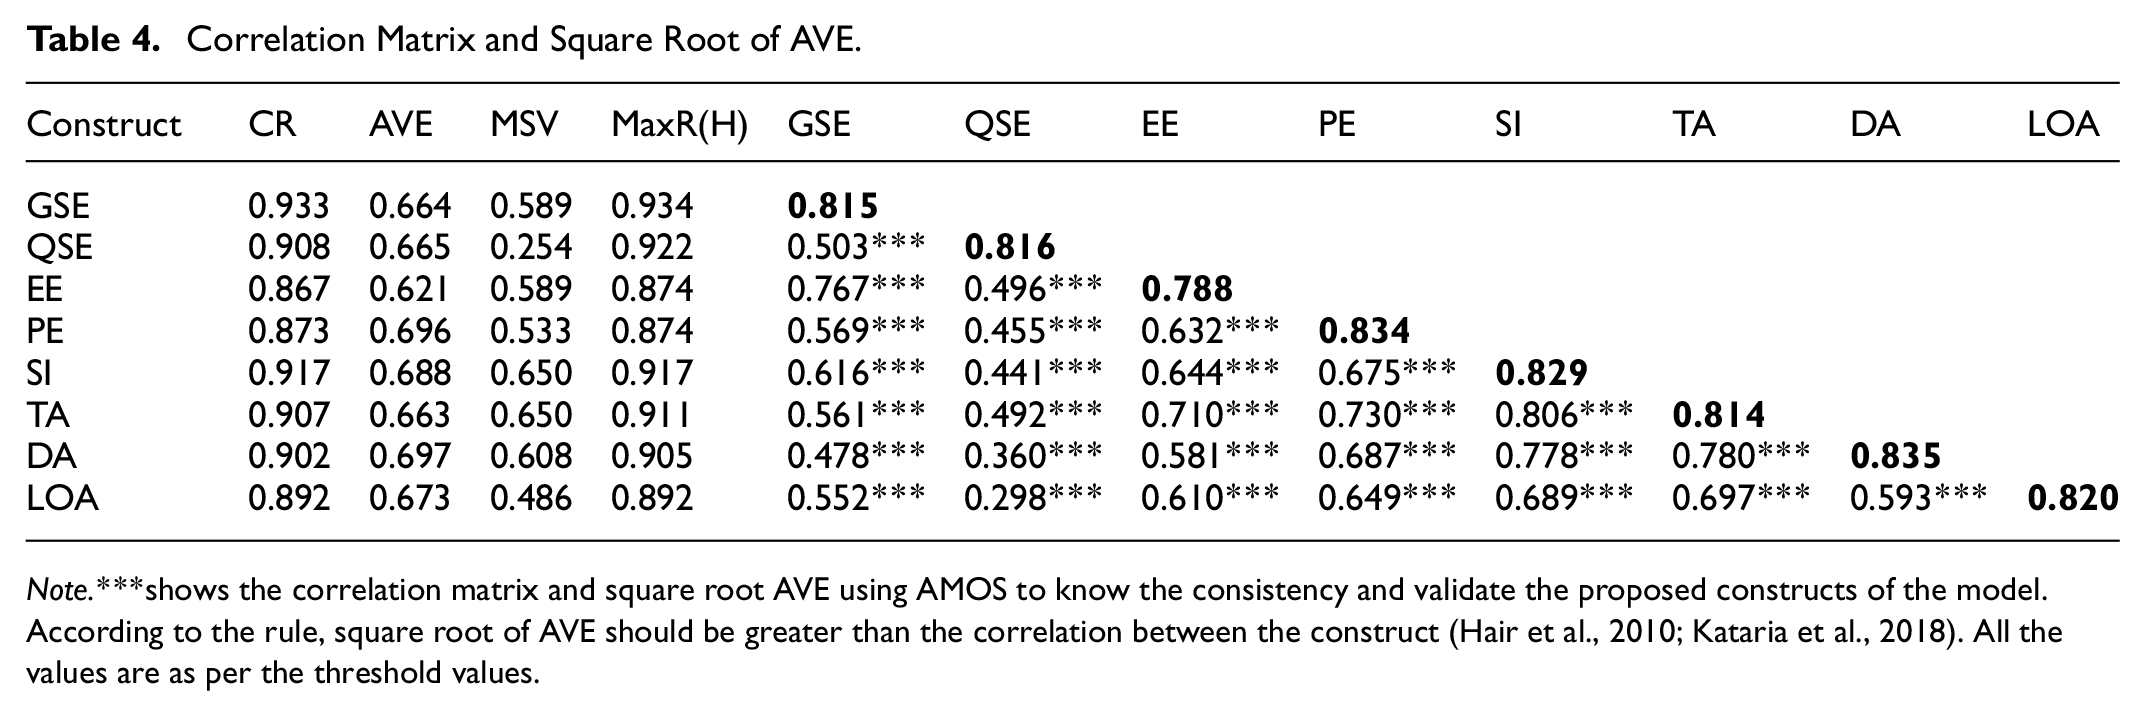
Note.***shows the correlation matrix and square root AVE using AMOS to know the consistency and validate the proposed constructs of the model. According to the rule, square root of AVE should be greater than the correlation between the construct (Hair et al., 2010; Kataria et al., 2018). All the values are as per the threshold values.
Confirmatory Factor Analysis
Brown and Moore (2012) explained that confirmatory factor analysis (CFA) deals with the measurement model and is considered a type of structural equation modeling. It defines the relationship between the observed indicators and the latent variables. CFA was conducted on all the identified variables of the study. The convergent and discriminant validity was checked to validate the scale. The convergent validity was made as all the loadings are above 0.5 and the average variance extracted for the entire above are more than 0.5 which accepts the first order discriminant validity (Serrano-Arcos et al., 2021). For the second-order test of discriminant validity, CR and Max R(H) should be greater than 0.7 as a reliability measure. The results show all the values are greater than 0.7 and even MSV<AVE (Milfont & Duckitt, 2004), thus, proving discriminant validity is there.
Table 5 shows the standardized regression weights on each construct were made to test the reliability and validity as it is considered a better measure (Kanyongo et al., 2006; Said et al., 2011). All regression weights are significant and greater than 0.5, thus, accepting the reliability and validity of the constructs. All the values for each construct have a value of more than 0.7 which indicates the fitness of the good.
Standardized Regression Weights on each Construct.

Note. “***” indicates that the regression weight is statistically significant at a p-value of less than 0.001.
Structural Equation Modeling
The results derived show that the data was accepted on the reliability and validity test. Therefore, we initiated the SEM analysis. In SEM analysis, the chi-square statistics were found to be within the threshold values and were found to be a good fit for all indexes of goodness-of-fit (Shahbaz et al., 2019). CMIN/DF = 3.075, RMSEA = 0.066, and RMR = 0.66 along with this the preliminary model has Tucker-Lewis Index as .903 and Comparative Fit Index as .913 which was found statistically fit., which proved that the model was a good fit.
For hypothesis testing, we executed path analysis. Table 6 shows the standardized regression weights between the adoption of HR analytics and the constructs. QSE and DA have negative values but p-values for both the constructs are less than .5 which shows it is significant. Figure 2 shows the SEM test for hypothesis testing. The results demonstrated that general self-efficacy, quantitative self-efficacy, effort expectancy, performance expectancy, tool availability, data availability, and social influence have a p-value less than .05 and have a significant relationship with the adoption of HR analytics. The R 2 value for the adoption of HR analytics is 0.549 which shows there is a significant impact of the construct on the adoption of HR analytics. Thus, H1, H2, H3, H4, H5, H6, and H7 are accepted and show a significant relation. Therefore, we exerted that the model was accepted.
Standardized Regression.

Note. “***” indicates that the regression coefficient is statistically significant at a p-value of less than 0.001.

Path model.
Discussions
The integration of technology into HR practices has revolutionized the domain, presenting immense opportunities for organizations that effectively adopt HR analytics. However, successful adoption depends on addressing the antecedents, challenges, and tools required while assessing their impact and proposing a framework for seamless integration. Drawing on Venkatesh et al.’s (2003) UTAUT model, underpinned by TPB, TRA, and TAM theories, this study investigates these dimensions within the Indian IT sector.
Antecedents and Their Impact on Adoption The study identifies several antecedents that significantly influence HR analytics adoption. Quantitative self-efficacy (−0.23) and data availability (−0.20) emerged as negative predictors, with significant p-values (p < .05). These findings suggest that HR professionals, often from non-technical backgrounds, perceive analytics tools as overly complex, exacerbating adoption challenges (Vargas et al., 2018). Data issues, such as unstructured formats and ambiguous metrics, further hinder adoption. Conversely, general self-efficacy (0.12, p = .000), performance expectancy (0.33, p = .000), and tool availability (0.41, p = .000) positively influence adoption. General self-efficacy reflects individual confidence in navigating analytics, while performance expectancy highlights the perceived value of analytics in enhancing decision-making and productivity (Lismont et al., 2017). Tool availability, particularly when tools are accessible and easy to trial, bolsters user willingness to adopt. Additionally, social influence (0.38, p = .000) plays a significant role, reflecting the importance of hierarchical and interpersonal dynamics in Indian workplaces (Saha et al., 2020).
These findings illustrate that in the Indian context, performance expectancy and social influence play pivotal roles in technology acceptance. The drive for efficiency and competitive advantage in a rapidly growing economy underscores the importance of performance-related benefits (Gupta et al., 2020). Meanwhile, the hierarchical structure of Indian workplaces, where leadership endorsement and peer advocacy shape perceptions, underscores the relevance of social influence (Khatun et al., 2019). The adoption likelihood is further enhanced when tools align with effort expectancy, providing user-friendly interfaces and requiring minimal training (Verma & Bhatia, 2020).
Challenges in Implementation Despite the promising potential of HR analytics, significant challenges impede its adoption. A recurring theme in the responses is a widespread fear of numbers, mathematics, and technology. Many HR professionals lack confidence in handling quantitative data, often stemming from limited exposure during their education or career. This mathematical anxiety leads to reluctance in engaging with data-driven approaches. Additionally, technological aversion—fueled by the rapid pace of advancements and fears of making mistakes—compounds the issue, creating psychological barriers to adoption.
Effort expectancy further emphasizes the importance of usability, as tools that are overly complex deter adoption. Resistance to change and perceived skill gaps exacerbate these challenges, particularly among employees accustomed to traditional HR practices. Furthermore, data availability issues, such as unstructured or insecure datasets, limit analytics applications and effectiveness. Addressing these barriers requires a multifaceted approach: simplifying tools, offering user-friendly interfaces, and providing robust training programs to foster confidence and skills.
Tools and Their Role in Adoption The study highlights R and Power BI as the most preferred tools for HR analytics among respondents. R’s open-source nature, extensive statistical capabilities, and strong community support make it a popular choice, particularly for complex analyses (Marler & Boudreau, 2017). Power BI’s intuitive design and seamless integration with Microsoft products appeal to organizations seeking user-friendly solutions for data visualization and reporting (Bersin, 2019). The popularity of these tools underscores the importance of balancing functionality with accessibility, ensuring that even users with minimal technical expertise can effectively engage with analytics. Emerging tools like Visier, while promising, remain less popular due to limited awareness and accessibility (Saxena et al., 2021).
The role of tools in adoption cannot be overstated. Tools that are intuitive and align with effort expectancy encourage adoption by reducing training requirements and increasing user confidence (Antila & Kakkonen, 2008). Tools like R and Power BI also address performance expectancy by providing robust analytics capabilities and insights that enhance decision-making and strategic planning. By prioritizing tools that balance usability and advanced features, organizations can foster greater adoption and maximize the benefits of HR analytics.
Proposed Framework for Adoption Building on these findings, a comprehensive framework for HR analytics adoption must address individual, organizational, and technological factors. Training programs tailored to overcome mathematical anxiety and foster technological confidence are critical. Leaders must advocate for analytics, creating an environment where experimentation is encouraged. Social influence can be leveraged through mentorship programs and success stories to demonstrate the tangible benefits of analytics.
From a technological standpoint, organizations should prioritize tools that align with effort expectancy and performance expectancy. Tools must be intuitive, with minimal training requirements, while offering advanced capabilities to meet organizational needs. Additionally, addressing data quality and security concerns is essential to ensure analytics readiness.
Managerial Implication
Sincere efforts are required to remove the barriers such as quality of data or time constraints. The observed challenges when combined with the barriers of self-efficacy can delay the process or might turn costly to the organization. The right directions, clear objectives, tool applications, and tasks should be defined properly. Each of them in its own self is a barrier to meeting the implementation process of HR analytics. These activities can also be supported with positive words, a positive attitude, and the right training before executing analytics in a routine workflow. The fear of numbers or mathematics should be dealt with cautiously. Once the “no” factor among the employee can destroy the efforts. This lack of quantitative self-efficacy can be avoided with the training and distribution of tasks in the initial learning period. The flow of work should be considered during the learning times and employees should be made available to learning sights or experts for proper guidance in execution and working with data.
The structured data and its quality make a huge difference in the adoption process. Access to workable data of good quality improves the results and visualization multi-fold times. Managers need to focus on the daily update of working sheets in the form of the desired output from the data, that means, the columns should be well-defined and labeled before any information flow-in. The access and view rights should be granted to the authorized person. The data flow should be cross-functional, and the big picture approach is accessible to its user.
An organization needs to structure them to expect some good results from the analytics. Structuring refers to defining and recording the flow of information, ensuring regular updates on the databases, ensuring cleaned data availability for visualization, and supporting and appreciating small steps of change to experience the impact of the adoption of HR analytics.
The right decision on the tool to use makes a good difference in its working. A user-friendly and easy guide to use to boost the confidence of its user. As the sample shows the desire and use of R, as R is a statistical language that helps in deriving quick statistical and visualized results. The competence of its use should be mapped to the tool used for analytics.
Limitations and Future Scope
The data was collected primarily in India from the IT industry, but the result of this research could be applied to other countries and other industries. Since the IT industry is more open, and welcoming to technology and innovation-oriented and thus provides a push to its non-tech workforce to adopt the new and visionary approach to work. However, this might be the same for other industries or countries. In some nations HRs are working only for hiring jobs, indicating the need for detailed research to create an awareness among them and their worth in the businesses. Web-based media was utilized to target and enlist the proper subjects for the review. Survey Monkey was the device picked to regulate the overview. These are more up-to-date techniques for arriving at subjects and gathering information. While there is huge surviving writing clarifying and advancing these techniques, their utilization is the subject of some discussion among some methodologists. In the wake of endeavoring a few more customary techniques like acquiring records from designated proficient associations, this was observed to be the most practical strategy to arrive at the ideal populace since it has all the earmarks of being the strategy liked by the respondents.
Research does not study another important factor such as fear appeals as an antecedent to the adoption of HR analytics, which could possibly affect. A study could be done on the suggested measures and their effectiveness. Further researchers can study and validate the application of HR analytics in different work areas.
Conclusions
This study provides valuable insights into the antecedents of HR analytics adoption in the Indian context, analyzing key factors such as social influence, tool availability, effort expectancy, and performance expectancy. The findings suggest that these factors positively influence the adoption of HR analytics, while challenges such as data accessibility, fear of complexity, and self-efficacy can act as barriers. Interestingly, despite the availability of data, many HR professionals struggle with its interpretation and application, which impacts their ability to fully leverage HR analytics. This aligns with existing literature, which highlights the difficulty in processing complex HR data due to limited skills and confidence (self-efficacy).
The study also emphasizes the critical role of organizational support and resources in fostering HR analytics adoption. Without proper tools, training, and encouragement from organizations, individual adoption remains limited. It is crucial for organizations to create an environment that facilitates the integration of HR analytics by providing access to HR analytics champions and fostering collaboration between early adopters and less experienced users. This will help bridge the skills gap and enhance confidence among HR professionals.
Although this research did not focus specifically on gender differences, future studies could explore whether factors such as gender, age, or role within the organization influence the adoption and implementation of HR analytics. Exploring these demographic variables could provide a more nuanced understanding of the adoption challenges and opportunities.
In conclusion, the study underscores the interplay between antecedents, challenges, tools, and their impact on HR analytics adoption in Indian organizations. By addressing skill gaps, fostering a supportive culture, and leveraging accessible tools, organizations can unlock the full potential of analytics. This tailored approach ensures a smooth adoption process, enabling HR professionals to make data-driven decisions and drive strategic outcomes, aligning with the evolving demands of the modern workforce.
The study provides valuable insights into the adoption of HR analytics, it is limited to the Indian IT sector, which may not fully represent other industries or regions. Future research could expand the scope to include diverse sectors and geographical areas, providing a more comprehensive understanding of the adoption dynamics. Additionally, the study primarily relies on quantitative methods, which could be complemented by qualitative approaches to capture deeper insights into individual and organizational perspectives.
The evolving landscape of HR analytics offers opportunities for further exploration, particularly in the development of innovative tools and techniques tailored to specific organizational needs. Future studies could also examine the long-term impact of analytics adoption on organizational performance and employee outcomes, offering a holistic view of its benefits. By addressing these avenues, researchers can contribute to the continued advancement of HR analytics and its integration into organizational practices. As HR analytics continues to evolve, future research should examine how demographic factors and new technological advancements may further influence its adoption.
Footnotes
Funding
The author(s) received no financial support for the research, authorship, and/or publication of this article.
Declaration of Conflicting Interests
The author(s) declared no potential conflicts of interest with respect to the research, authorship, and/or publication of this article.
Data Availability Statement
Data sharing not applicable to this article as no datasets were generated or analyzed during the current study.