
Abstract
Issuing ESOP shares causes a lot of The Regression Results of ESOP Policies on Stock Price Crash Riskcontroversy because it not only reduces stock prices due to dilution effects but also reduces agency costs. The purpose of this study is to examine the impact of Employee Stock Ownership Plan (ESOP) policies on the risk of stock price crashes, with a focus on the role of corporate transparency. The study is set in the context of companies listed on the Vietnamese stock exchange from 2010 to 2022. Using a quantitative approach, data were collected and analyzed from financial reports and stock price performance. The findings reveal that companies with ESOP policies face varying risks of stock price crashes depending on the concentration and issuance ratio of the ESOP. Specifically, companies with an ESOP ratio exceeding 1% experience a higher crash risk, while those distributing ESOP shares to over 10% of their employees face lower risks. Corporate transparency plays a crucial role because transparent companies are better positioned to mitigate these risks. Conversely, non-transparent companies are more vulnerable to stock price crashes when issuing ESOPs. These findings have practical implications for both investors and policymakers, suggesting that ESOP issuance should be coupled with transparency to reduce financial risks.
Introduction
The risk of a stock price crash is an unforeseen issue in financial markets, often occurring when stock prices sharply decline in a short period. This not only impacts shareholders by reducing the value of their shares but can also have significant consequences for the company, including decreased asset value, damage to its reputation, and challenges in attracting investors (Deng et al., 2020). Research on the risk of stock price crash attracts the attention of investors, market managers, and organizations due to several reasons. Firstly, understanding crash risk helps protect investors by providing insights into potential downside scenarios. This information allows investors to make more informed decisions and manage their portfolios more effectively (An & Zhang, 2013). Secondly, institutions and investors can use research on stock price crash risk to develop risk management strategies, which may include diversification, hedging, and other risk mitigation techniques to safeguard portfolios against severe market downturns (Habib & Hasan, 2017; Octaviani & Utama, 2022; Wang et al., 2023). Thirdly, stock market crashes can have cascading effects on the broader financial system. Researching crash risk contributes to the overall understanding of systemic risks and helps policymakers and regulatory bodies take preventive measures to maintain financial stability (Xie et al., 2022). Moreover, analyzing crash risk contributes to a better understanding of market dynamics. This understanding can lead to improvements in market efficiency as investors incorporate risk assessments of their decision-making processes (Mensi et al., 2021). The risk of stock price collapse directly causes a series of consequences, including financial and psychological outcomes, such as leading to a decrease in the value of investment assets, creating a sell-off pressure in the market, eroding investors’ confidence in the financial market and generating negative psychological impacts for investors. They may experience anxiety, stress, and fear about the future of their investments, especially retirees (Wu et al., 2021).
Employee Stock Ownership Plans (ESOPs) are company-sponsored programs that provide employees with an ownership stake in the company through the allocation of shares. In 2023, National Center for Employee Ownership (NCEO) estimates there are roughly 6,500 employee stock ownership plans (ESOPs) at 6,322 companies in USA, covering 14.7 million participants and holding over $2.1 trillion in assets. ESOPs have both advantages and disadvantages. The advantages of ESOPs are as follows: ESOPs not only create incentives for employees to work harder but also establish an environment in which employees feel that they are truly a part of the company’s growth. When they become shareholders, they often have a vested interest in the performance and return of the stocks they hold (Kurland, 2018). ESOPs, as such, not only foster a close relationship between employees and the company but also motivate them to effectively participate in the management and monitoring of the company (Mazibuko & Boshoff, 2003). However, shareholders do not always support the company issuing the ESOP because if the ESOP policy is abused or if it is unreasonable, it can reduce the benefits for existing investors due to the dilution effect caused by ESOP issuance. This can exacerbate the conflict between shareholders and the CEO (known as the Agency problem). In addition, ESOPs have some disadvantages as follows: setting up and maintaining an ESOP can be complex and costly, requiring legal and financial expertise. Ongoing administrative expenses can also be significant. Furthermore, employees may have limited control over the company’s strategic decisions, as the majority of shares may be held by a few key individuals or entities (Buxton & Gilbert, 2004; Knoll, 2009; McDaniel et al., 1995).
Meanwhile, transparency is an important management principle that requires companies to provide clear and fair information about every aspect of their business operations. Transparency helps foster trust among shareholders, investors, and employees (Jahansoozi, 2006). Stakeholders can rely on this information to make critical decisions, such as investments, buying and selling stocks, or supporting the company’s business strategy. Transparency not only eliminates doubt and prevents fraud or misinformation but also plays a crucial role in ensuring that all stakeholders understand the true state of the company (Kane, 2004).
The relationship between ESOP, transparency, and the stock price crash risk is closely intertwined. The ESOP policy can impact the stock price crash risk in several ways. When employees become shareholders, they often gain better knowledge of the company’s operations and performance. This knowledge allows them to identify the challenges and opportunities facing the company and participating in making shareholder management decisions based on this information, thereby influencing the price of the company’s stock (Li et al., 2019). However, transparency in ESOP management is crucial to ensure that employees understand their rights and their influence on the company. Without transparency, lack of information, misinformation, or deception that prevents employees from making informed decisions and leads to an increased risk of stock price crash.
Transparency is a crucial aspect of ESOP management that helps control the risk of stock price crash. When companies provide clear and fair information about their financial position, business strategy, and operating performance, employees can assess the risk associated with their stocks based on transparent information. This transparency helps them understand the actual situation of the company, easily identify and assess the stock price crash risk, and make informed decisions about holding or selling shares (Li et al., 2019; Wu et al., 2023).
Most previous studies investigate the impact of CEO power, CEO compensation, and CEO overconfidence in stock price crash risk (Kalia, 2024; Kim et al., 2016; Shahab et al., 2020). Or some papers examine the relationship between Employee Stock Ownership Plans (ESOP) and stock price crash risk have mainly focused on comparing the stock prices and operational performance of companies that have implemented ESOPs with non-ESOP companies (Kurland, 2018; Li et al., 2019; Mazibuko & Boshoff, 2003; Wu et al., 2023). The limitation of these studies is that they neglect to analyze the relationship between ESOP and the risk of stock price collapse within the framework of company transparency. Different from previous studies, our paper seeks to make the following contributions to the existing literature. First, unlike most previous studies that only discussed the impact of ESOP on the stock price crash risk, our paper takes a different approach. We directly incorporate various variables that measure corporate transparency and ESOP policy to assess their impact on the stock price crash risk. Second, our paper contributes to the academic literature by observing ESOP from three different aspects (ESOP, ESOP issuance rate, concentration level of ESOP policy), thereby contributing more empirical evidence to clarify the previous argument on whether the ESOP policy is beneficial or harmful to shareholders. Finally, to the best of our knowledge, most of previous studies on transparency in companies have mainly been conducted in developed countries where professional ethics are promoted and there is a completely legal basis regulating responsibilities and transparency of listed companies. In contrast, there is a lack of research in emerging markets like Vietnam, where the legal system regulating transparency in listed companies is not yet complete, and professional ethics are not emphasized. Therefore, our research provides a different perspective in a completely different environment.
In our study, we investigate the negative impact of Employee Stock Ownership Plans on the risk of stock price crashes. We contend that ESOPs are predominantly influenced by CEOs’ participation in compensation decisions. Consequently, variations in CEOs’ compensation structures arise, leading to potential agency issues. Using data from companies listed on the Vietnamese stock market, we aim to clarify this relationship and provide actionable recommendations for companies to optimize their ESOP programs and transparency, thereby minimizing the risk of stock price collapse. We also emphasize the importance of fostering information sharing among stakeholders when implementing ESOP policies to create transparency within companies and ensure stable, sustainable development. Our goal is to provide a broader understanding of how these factors influence the stability and development of businesses in an increasingly complex and challenging business environment. Our findings shows that ESOP policy minimizes the stock price crash risk. But ESOP ratios exceeding 1% and concentration ESOP policies expose companies to a higher risk of stock price drops. Additionally, ESOP policies have a more pronounced impact on crash risk for firms with lower transparency.
The subsequent sections of the paper are structured as follows: Next, we delve into the literature review and formulate hypotheses. Then, we outline the research design, present empirical results, and engage in a discussion. Finally, the last section provides the paper’s conclusion.
Literature Review
There have been several previous studies investigating the relationship between ESOP policies and firm performance. The results reveal two opposing views. The first perspective posits that there is little to no relationship between ESOP policies and firm performance. For instance, Meng et al. (2011) found little difference in performance between companies implementing ESOP policies and those that do not, after examining various firm performance measures such as ROA, ROE, and Tobin’s q. To explain this issue, Meng et al. (2011) argue that ESOP policies cause ownership to become highly dispersed, leading to the emergence of free-riders. As a result, they suggest that ESOP policies are ineffective in promoting operational efficiency. Moreover, when ESOPs are allocated to low-level employees whose individual contributions have minimal influence on the overall company performance, it becomes challenging to establish a clear link between firm performance and the ESOP policy. Le and Nguyen (2023) found that the Employee Stock Ownership Plan policy can negatively impact shareholders due to share dilution. In simpler terms, when the company issues new ESOP shares, it may lead to a negative market reaction. When the market responds negatively to the ESOP policy, leading to investors selling shares, it can increase the risk of a stock price crash. Based on these arguments, we propose a hypothesis:
H1. The ESOP policy heightens the stock price crash risk.
In contrast to the above viewpoint, Jensen and Meckling (1976) believe that one reasonable method to mitigate the Agency Problem is to transform employees, including managers, into owners of the company. Consequently, the ESOP policy directly influences employee motivation to enhance company performance. This heightened motivation stems from employees’ increased interest in improving firm performance. Furthermore, it is argued that ESOPs aid in cultivating a more effective corporate culture by encouraging employee participation and promoting teamwork, further reinforcing the positive impact of ESOPs on firm performance (Ding & Chea, 2021; Townsend et al., 2024; Ying et al., 2022). Furthermore, companies with well-crafted ESOP policies often impose restrictions on share transfers. For instance, MWG’s ESOP shares can only be sold after 4 years, or like FRT, transfer restrictions are gradually lifted by 33% each year. Consequently, ESOPs serve to align employees’ interests with the company’s performance and operations. Cheng and Ji (2021) conducted a comparative analysis of ESOP policies in state-owned enterprises and non-state-owned enterprises. They argue that, in contrast to state-owned enterprises, non-state-owned enterprises operate within a more open competitive environment with fewer government regulations. The salary and performance management systems in non-state-owned enterprises are more market-oriented. Due to the need to assume their own risks and profits and losses, internal competition mechanisms in non-state-owned enterprises foster intense competition among employees, which, in turn, reduces employees’ discretion. Additionally, employees in non-state-owned enterprises are more receptive to wider salary disparities based on performance differences. Non-state-owned enterprises boast superior internal control systems, more transparent promotion mechanisms, and more decentralized ownership structures. Consequently, the implementation of ESOPs in non-state-owned enterprises can effectively mitigate agency conflicts between shareholders and executives, as well as between executives and employees while simultaneously reducing equity capital costs for firms. As a firm’s performance improves, the risk of a stock price crash diminishes. By applying event study. Li et al. (2019) found that there is a significant and negative correlation between a firm’s stock price crash risk and the announcement of an employee stock ownership plan (ESOP). The study suggests that the market receives positive signals from an ESOP announcement, indicating that insiders have high expectations for the firm’s future value. This can help decrease the risk of a stock market crash, increase investor confidence and resist pressure to conduct a fire sale. Based on these arguments, we formulate hypotheses H2 and H3:
H2. ESOP policy minimizes the stock price crash risk.
The policy of issuing an Employee Stock Ownership Plan (ESOP) to a large number of employees can lead to a higher risk of a stock price crash for the following reasons: Every time a company issues more shares to employees through an ESOP, the number of shares in the market increases, leading to the dilution of existing shares. This dilution reduces the relative ownership of existing shareholders and can result in lower stock prices in the market (Le & Nguyen, 2023). When a significant number of employees owns a company’s stock, they may wield an excessive degree of influence in the management of the company, especially through voting on critical issues. This situation can create the potential for management conflicts and lead to decisions that may not be in the best interest of the company (Blasi et al., 2018). Moreover, when a company has to allocate a substantial amount of its stock to employees through an ESOP, it can result in a financial shortfall. The company requires ample capital to sustain and expand its operations, and the issuance of an excessive number of ESOP shares could impede the company’s capacity to embark on new projects or settle existing debts (Cai, 2023). In light of these arguments, we propose hypothesis H3 as follows:
H3. Companies with a larger ratio of ESOP issuance to the total number of outstanding shares will have a higher risk of stock price decline due to shareholders selling off shares due to concerns about the effects of stock dilution.
From another perspective, Tran (2020) conducted research on the effectiveness of ESOP policies in European banks. The results revealed that ESOP policies are most effective in countries with well-established legal systems and a high level of shareholder protection. Furthermore, the study emphasizes that European countries must not only introduce supportive measures but also enhance transparency and shareholder protection to promote the adoption of ESOP policies. Tran et al. (2023) investigated whether banks with Employee Stock Ownership Programs (ESOPs) are valued more highly by the market compared to banks without such programs. Using various empirical models, they concluded that ESOPs increase the market value of banks. However, ESOPs have a significantly positive impact when banks prioritize transparency or are headquartered in countries with robust shareholder protection measures. Conversely, the ESOP policy is less effective when banks lack transparency or do not focus on safeguarding small shareholders. Implementing a decentralized ESOP policy (offering shares to many employees rather than limiting issuance to a select group of board members) enhances a company’s transparency. Agreeing with the aforementioned perspective, Scarpati (2023) also contends that widespread issuance of ESOPs to most employees fosters conditions for greater transparency in a company’s accounting books, financial reports, policies and decision-making processes. Additionally, Blasi et al. (2018) argue that employee stock ownership and profit sharing contribute to more harmonious workplaces, promoting increased corporate transparency and greater worker involvement in firm affairs. This is achieved through enhanced access to information and active participation in workplace decisions. Moreover, Chen et al. (2017) demonstrate that as the market becomes more accustomed to companies implementing ESOPs, it encourages governments to enact policies aimed at increasing market transparency, thereby mitigating the risk of stock price crash. Based on these studies, hypothesis 4 is proposed:
H4: Companies with unconcentration ESOP issuance policies will have a high level of transparency, thereby minimizing the risk of stock price crash.
Methodology
Data
In this study, the authors concentrated their attention on the largest companies within each industry that are listed on the Ho Chi Minh Stock Exchange. Data collection was carried out through a series of systematic steps: First, we identified the 15 industries with the highest market capitalization, classified according to the Vietnam Standard Industrial Classification (VSIC). Subsequently, we selected the 10 largest companies by market capitalization in each industry. If a particular industry had fewer than 10 listed companies, we opted to include five companies. In the third step, we gathered data pertaining to Employee Stock Ownership Plans (ESOP) policies and independent auditing firms by scrutinizing the annual reports of these businesses over multiple years. We sourced stock price data from Finnpro software, a reputable dataset widely endorsed by scholars researching the Vietnamese market and featured in esteemed journals. We collected data for our main dependent variable (i.e., stock price crash risk) (weekly stock return) while following previous studies (Liang et al., 2020; Wang et al., 2023). Financial metrics such as total assets, cash and cash equivalents, long-term debt, and depreciation were extracted from the companies’ financial reports. Furthermore, we procured additional data, such as transparency ratings of these companies, derived from their recognition in the “Best Investor Relations Activities” organized by Vietstock and the State Securities Commission. Information about the auditing company (Big4) is extracted from the annual report (Calderon et al., 2007). All data encompassed a timeframe spanning from 2010 to 2022. See Table 1 for the definition of all variables used in this Study. After excluding the newly listed companies due to insufficient data and companies with less than 26 weeks of trading within a given year, we amassed a total of 665 observations. To ensure consistency and mitigate the impact of outliers, we standardized all the data to have a mean of 0 and a standard deviation of 1. We also applied winsorization techniques as part of the data preprocessing.
Variable Description.

Measure
ESOP Policy
ESOP policies are consistently a topic of controversy in many markets. Some investors believe that ESOP is beneficial for shareholders in the long term, while others vehemently oppose it, citing potential harm to shareholders. Specifically, the primary objective of ESOP is to issue shares to the board of directors, thereby providing direct benefits to CEOs. However, this action can lead to the dilution of stock prices in the market, ultimately reducing shareholder benefits. Due to this ongoing debate, the authors have subdivided the ESOP policy into three distinct variables. The first variable is “ESOP,” which is dummy variable and takes the value of 1 if the company has an ESOP issuance policy, and 0 if the company does not implement one. The second variable, “ESOPC,” measures the concentration of ESOP stock issuance to employees. It is also a dummy variable, taking the value 1 if the issuance to employees exceeds 10% of the company’s total employees and 0 otherwise. 10% is calculated based on the average number of employees received ESOPs from listed companies during the research period. The third variable, “ESOPR,” is a dummy variable and is calculated based on the ratio of ESOP issuance in relation to the number of outstanding shares. ESOPR takes the value of 1 when the number of shares issued relative to the total outstanding shares is greater than or equal to 1%, and 0 if it falls below this threshold. 1% is taken based on the average ESOP ratio of listed companies issued during the research period.
Transparency
Previous studies (Dechow et al., 1995; Hutton et al., 2009) have consistently suggested that a company’s transparency level can be assessed by considering the information it publicly discloses, including items such as annual reports, investor meetings, analytical reports, voluntary disclosure information, and various other activities.
The Transparency Index for listed companies is a recognized and effective tool for assessing the transparency and information disclosure levels of companies on the stock market. As described by Hutton et al. (2009), a key indicator of a company’s transparency is its earnings quality, which is calculated based on the absolute value of discretionary accruals over the preceding 3 years. Building on the previous research conducted by Dechow et al. (1995) and Hutton et al. (2009), we measure the Transparency Index through the following steps. To begin, we calculate the total assets (TA) using the following formula:

For each industry and fiscal year, we perform a cross-sectional regression analysis using the following model:

Where, Ai,t−1 is the lagged total asset; ΔREVi,t the change in revenues; and PPEi,t is fix asset include the property, plant and equipment. Next step, we use the estimated coefficients in equation (2) to measure the discretionary accruals by equation:
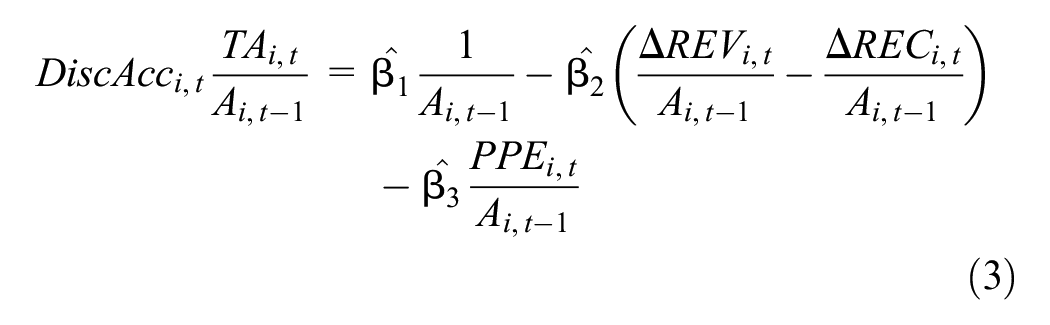
Where ΔRECi,t is the change in net account receivable. Next, follow Dechow et al. (1995), we denote SAA is the moving sum of the absolute value of discretionary accruals over the last three years (from t−1 to t−3). SAA in multiplied with −1, therefore, the higher value of SAA stands for high earnings quality.

The second method we use to measure corporate transparency is by using information about independent audit firms. According to Liang et al. (2020), financial statements audited by the Big 4 companies (PwC, KPMG, E&Y, Deloitte) have a higher level of transparency than those audited by other companies. Lang and Maffett (2011) agree that hiring the Big4 can signal a company’s willingness to undertake a rigorous audit process, which is linked with a high degree of corporate transparency. Calderon et al. (2007) believe that Big 4 audit firms often maintain independence during the audit process. This ensures that they are able to provide audit reports that are not influenced by the personal or financial interests of the company they are auditing, creating a more objective and trustworthy audit environment. In addition, large auditing firms have specific audit processes, high-quality standards, and extensive knowledge in identifying risks and errors in financial statements. They provide feedback and suggestions to improve risk management and transparency in the company’s financial processes. Based on these studies, we create the variable Big4, which is a dummy variable taking the value of 1 if the company is audited by one of the Big 4 companies, and taking the value of 0 otherwise.
The final variable we use to measure the level of corporate transparency is “IR,” which represents the company awarded with the best Investor Relations activities of the year, jointly organized by Vietstock and the State Securities Commission. The “IR Awards” include two rounds: A comprehensive survey of information disclosure in the stock market within 12 months. And an open public Investor Relationship Voting and Investor Relationship Evaluation from professional financial institutions. Companies that win IR awards will meet the following criteria: (a) Transparent and effective financial communication, creating a broad understanding of the value and prospects of the firm, and attracting groups of investors on the market. (b) Having a good financial reputation, demonstrating good management capacity, and maintain a positive reputation for the Board of Directors and Executive Board in terms of the reliability of financial data and other published documents. (c) Investor relations activities contribute to optimizing firm value, ensuring that market valuation is close to the intrinsic value of the firm, and maintaining reasonable stock liquidity. The IR variable is a dummy variable that takes the value of 1 if the company received an IR award that year, and 0 otherwise.
Stock Price Crash Risk
Following research conducted by Chang et al. (2017) and Chauhan et al. (2017), our initial procedure focuses on computing weekly returns for individual firms across different years. Our primary objective is to gain insights into firm-specific return volatility. Specifically, we define the firm-specific weekly return, denoted as “W,” as the natural logarithm of one plus the residual returns derived from an expanded index model regression.

In equation (5), Reti,t represents the return on stock i during week t, while Retm,t corresponds to the return on the weighted-value market index (VNIndex) for the same week. To account for nonsynchronous trading, we incorporate lag and lead terms for market index returns in equation (5), as suggested by Liang et al. (2020). Equation (5) requires that a minimum of 26 weekly return observations must be available for each firm and year.
To measure stock price crash risk, three different variables are used: CRASH_1, CRASH_2, and CRASH_3. CRASH_1 is measured based on the stock price crash risk in Liang et al. (2020). Specifically, CRASH_1 relies on the occurrence of firm-specific weekly returns that deviate significantly - more than 3.2 standard deviations - above or below the mean. CRASH_1 is calculated by subtracting the downside frequencies from the upside frequencies. A larger value of CRASH_1 indicates a higher frequency of stock price crashes.
Next, we measure CRASH_2 (negative skewness in the return distribution function) and CRASH_3 (the up-and-down volatility of weekly typical returns relative to the mean). These variables have been used to measure stock price crash risk in previous studies (Chauhan et al., 2017; Callen & Fang, 2015; Chang et al., 2017).

In which, CRASH2 measures the price slippage risk of stock i in year t. Wi,t represents the weekly characteristic return of stock i in year t. n is the number of transaction weeks in year t. The higher the CRASH2, the greater the risk of price crash.

CRASH3 measures stock price crash risk by calculating the difference between weeks with low yields and weeks with high yields (An & Zhang, 2013; Kim et al., 2014). nu and nd represent the number of weeks with returns higher and lower than the mean value in the return distribution set for stock i in year t, respectively. DOWN and UP denote the squares of the returns for weeks with returns lower and higher than the mean value, respectively. A larger CRASH3 indicates a higher risk of price crash.
Model
To test the impact of ESOP policy on stock price crash risk (Hypothesis 1), we apply the following regression model:

In which, CRASHt is the risk of stock price crash proxied by CRASH1, CRASH2, and CRASH3. ESOPt-1 is proxied by original ESOPt-1, ESOPCt-1, and ESOPRt-1. Other control variables are included in the model as: SIZEt-1 (lagged firm size), MBt-1 (lagged market-to-book ratio), TURNt-1 (detrended stock turnover ratio in year t−1), ROAt (return on net assets), WRETURNt-1 (average firm-specific weekly returns in year t−1), and VOLt-1 (the volatility of firm-specific weekly returns in year t−1) (Hutton et al., 2009; Liang et al., 2020). For details of the variables, see Table 1.
Next, to test Hypothesis 3,4, the equation (8) is expanded by interacting between firm transparency and ESOP variables as follows:

In which, the variable TRAN represents a company’s transparency, as measured by the four variables mentioned above (SAA, BIG4, IR). We expect that β2 will be less than 0 because as a company becomes more transparent, the impact of the ESOP policy on the company’s stock price crash risk is expected to decrease.
Result
Descriptive Statistics and Univariate Analysis
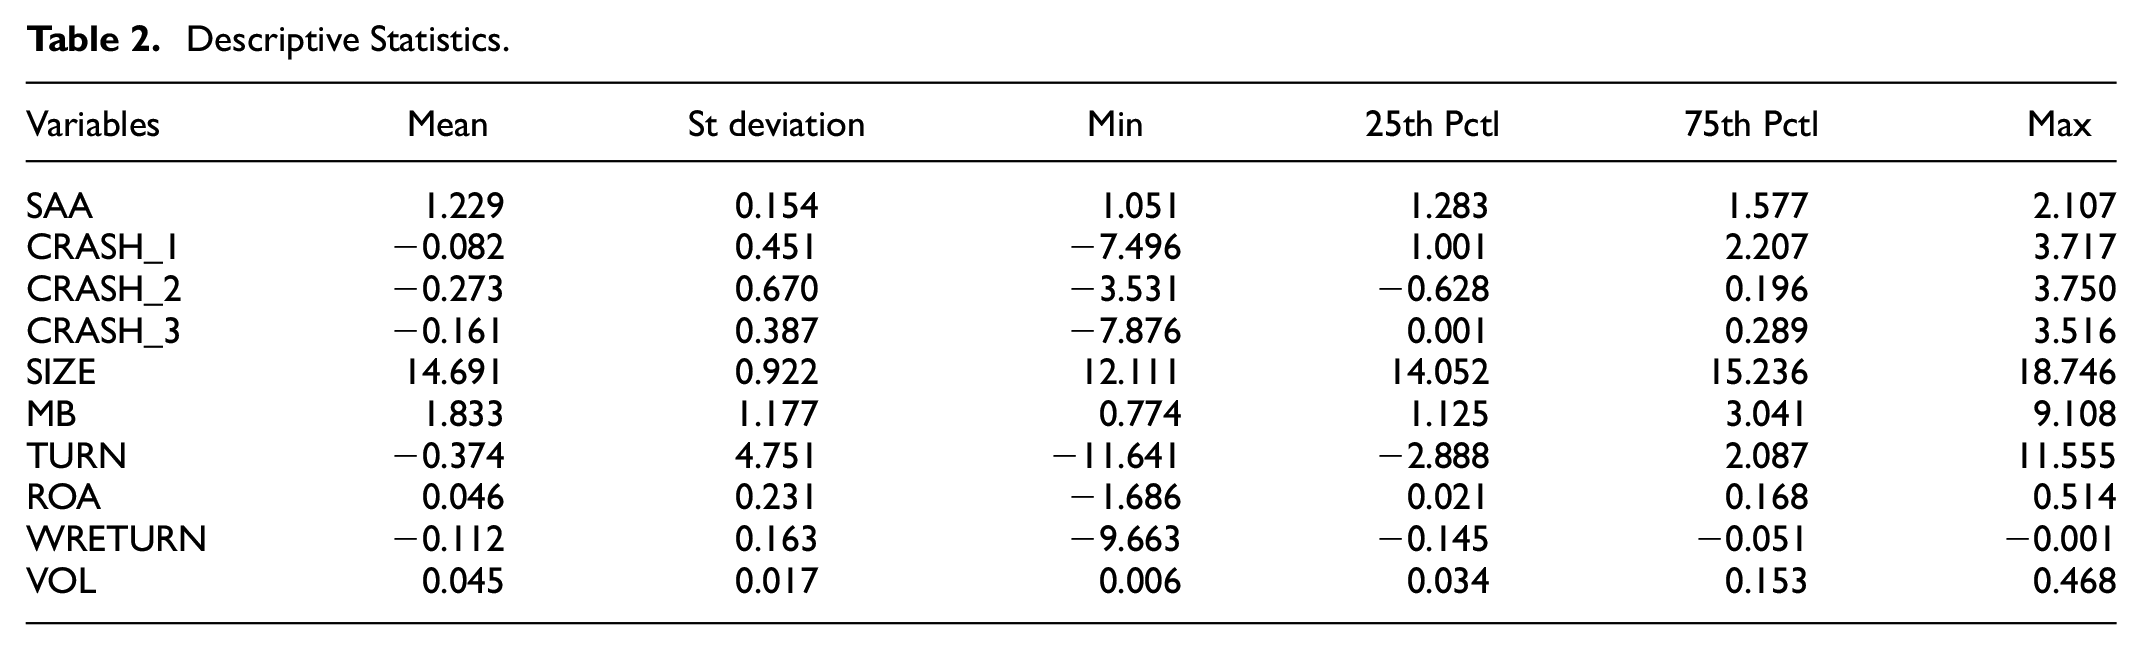
The descriptive statistics of the firm transparency, stock price crash risk, and other model-related control variables are shown in Table 2. The sample period is from 2010 to 2022. CRASH_1 has a maximum (minimum) value of 3.717 (−7.496), a standard deviation of 0.451, and a mean value of −0.082. CRASH_2 has a maximum (minimum) value of 3.750 (−3.531), a standard deviation of 0.670, and a mean value of −0.273. The mean value and standard deviation of CRASH_3 are −0.161 and 0.487, respectively. Based on these findings, a variety of stock price crash risks are present for the sample firms. With a mean SAA value of 1.229, the majority of the firms have high earnings quality.
Descriptive Statistics.
The correlation coefficient between variables are shown in Table 3. The results indicate that, in general, the correlations among the model’s variables are relatively small, with the exception of the SIZE and MB variables, which reached 0.402. However, even this value is still less than 0.5. Therefore, the model is not expected to encounter multicollinearity problems.
The Correlation Coefficient Between Variables.

The findings of the univariate test examining the relationship between crash risk and ESOP policies are displayed in Table 4. Panel A (Table 4) displays the difference in crash risk between firms with ESOP firms and without-ESOP firms. Compared with Non-ESOP firms, ESOP firms have higher levels of crash risk (mean of Non-ESOP firms higher than ESOP firms), regardless of using CRASH_1, CRASH_2 or CRASH_3 as the crash risk measure. The results of the t- and Wilcoxon rank-sum tests show that the differences are statistically significant at least at the 5% level. This finding rejects H1, but it supports H2. In Panel B of Table 4, we observe the difference between firms with ESOP rate ≥1% and firms with ESOP rate <1%. Because the all of the mean difference is positive significant at 1%, it is consistent to H3 that firms with a policy of issuing ESOPs in excess of 1% of the total number of outstanding shares will have a higher risk of stock price crash. The explanations for the increased risk associated with higher ESOP rates include the potential for significant stock dilution when a firm issues ESOPs in excess of 1% of the total number of outstanding shares. Existing shareholders may fear that their ownership percentage and voting power will be reduced, triggering a sell-off of shares and increasing the risk of a stock price crash. Additionally, a large issuance of ESOPs can be perceived by the market as a signal that the firm is compensating employees with stock instead of cash, potentially indicating cash flow or liquidity issues. This negative perception can undermine investor confidence, leading to increased selling activity and higher crash risk. Furthermore, employees who receive a significant portion of their compensation in the form of stock may be more inclined to sell their shares to diversify their personal investment portfolios, adding to the selling pressure and contributing to increased crash risk. Large ESOP issuances also increase the number of shares available in the market, potentially overwhelming the demand for the stock. This can result in lower stock prices and higher crash risk, especially if the market cannot absorb the additional shares efficiently.
Univariate Tests Between ESOP Policies and Crash Risk.

Note. This table shows the mean values of crash risk for firms with various ESOP policies. The data is collected from 2010 to 2022. Panel A shows the difference in stock price crash risk between ESOP firms and Non ESOP firms. Panel B shows the difference in stock price crash risk between firms with ESOP rate ≥1% and firms with ESOP rate <1%. Panel C shows the difference in stock price crash risk between firms with concentration ESOP and firms with unconcentration ESOP policy. Detail of variables are reported in the Table 1.
**, ***Significant at 5, and 1% levels, respectively.
In Panel C, we observe the difference between firms with concentration ESOP and firms with unconcentration ESOP policy. The result is consistent to H4 that firms with decentralized ESOP issuance (unconcentration ESOP) policies will minimize the risk of stock price crash. If ESOPs are issued to a small group of employees or executives, the impact of potential stock sales by these individuals is magnified. Large, concentrated sales can create sudden downward pressure on the stock price, leading to increased volatility and crash risk. When ESOPs are concentrated among a few individuals, their decisions to sell shares can be interpreted as a lack of confidence in the firm’s future performance. This can exacerbate negative market sentiment and contribute to a higher likelihood of a stock price crash.
Table 5 shows the results of the univariate test on the relation between transparency and stock price crash risk. Panel A of Table 5 reports the difference in stock price crash risk between firms with statements audited by the Big 4 companies and other firms. The mean differences between Big 4 and Non-Big 4 are negative and significant for all variables of stock price crash risk, at least 10%. This means that firms audited by Big 4 companies have less stock price crash risk than firms not audited by Big 4 companies. Panel B of Table 5 reports the difference in stock price crash risk between firms that received the investor relation award and other firms. The finding shows that firms that did not receive the investor relation award have higher stock price crash risk than firms that received the investor relation award.
Univariate Tests Between Transparency Policies and Crash Risk.

Note. This table shows the mean values of crash risk for firms with transparency policies. Data is collected from 2010 to 2022. Panel A reports the difference in stock price crash risk between firms with statements audited by the Big 4 companies and other firms. Panel B shows the difference in stock price crash risk between firms that received the investor relation award and other firms. Detail of variables are reported in the Table 1.
*, **, ***Significant at 10, 5 and 1%levels, respectively.
Figure 1 comprises three sub-figures: 1(a) to (c). These sub-figures illustrate the relationship between CRASH_1, CRASH_2, and CRASH_3 with the company’s transparency level, as measured by the variable BIG4. The results consistently align with the findings in Table 5 (Panel A). Over the entire period, the CRASH curve for companies with low transparency levels consistently lies above the CRASH curve for companies with high transparency levels. In simpler terms, companies with lower transparency face a higher risk of stock crash compared to those with higher transparency levels

Plot of CRASH risk and transparency. (a) CRASH_1 and transparency (BIG 4). Data from 2010 to 2022. Difference between CRASH_1 of transparent firms and Non-transparent firms, (b). CRASH_2 and transparency (BIG 4). Data from 2010 to 2022. Difference between CRASH_2 of transparent firms and Non-transparent firms, and (c). CRASH_3 and transparency (BIG 4). Data from 2010 to 2022. Difference between CRASH_3 of transparent firms and Non-transparent firms.
Multivariate Analysis
Table 6 reports the regression results of ESOP policies on stock price crash risk, which is estimated by equation (8). The dependent variables are CRASH_1, CRASH_2, and CRASH_3, respectively. For each stock price crash risk variable, we ran four models (from (1) to (4)). The t-statistics reported in parentheses are based on robust standard errors clustered at the firm level. The model regressions were conducted with industry and year-fixed effects. The model (1) of all CRASH variables show that the coefficients of ESOP are negative and significant at least 5%. This means that firms with ESOP implementation policy have lower stock price crash risk than firms without ESOP implementation policy. In model (2), we replaced ESOP with ESOPR. For CRASH_1, the finding in the model (2) shows that firms with a number of shares issued to the total outstanding shares greater than or equal to 1% have higher stock price crash risk than firms with ESOP rate <1%. The findings are similar in model (2) of CRASH_2 and CRASH_3 variables. In model (3), we replaced ESOPR with ESOPC. The coefficients of ESOPC in all models (3) are significantly negative at 5%, confirming that firms that issue ESOP to employees exceeding 10% of the company’s total employees have a lower stock price crash risk than other firms. Alternatively, firms with an ESOP concentration policy face higher crash risk than those with an ESOP unconcentration policy. In model (4), we observe that when both ESOPR and ESOPC are included in the regression model, the coefficients of ESOPR variables remain positive and statistically significant. This significantly positive association between ESOPR and crash risk is consistent with H3, implying that a high ESOP rate causes a higher risk of stock price crash because shareholders sell off shares due to concerns about the stock dilution effect. Similarly, the coefficients of ESOPC variables remain negative and statistically significant, implying that unconcentration ESOP issuance policies minimize the risk of stock price crash.
The Regression Results of ESOP Policies on Stock Price Crash Risk.

Note. This table reports the regression results of ESOP policies on stock price crash risk. The dependent variable is stock price crash risk, proxied by CRASH_1, CRASH_2, and CRASH_3. The main variables are ESOP, ESOPR, and ESOPC, which represent ESOP implementation, ESOP rate, and ESOP concentration. The sample period was collected from 2010 to 2022. The t-statistics reported in parentheses are based on robust standard errors clustered at the firm level. The model regressions were conducted with industry and year fixed effects. Details of variables are reported in Table 1.
*, **, *** indicate significance at 10%, 5%, and 1% levels, respectively.
In general, the estimated coefficients of the control variables agree with the results of the earlier research. For instance, all models have positive and significant SIZE coefficients, which is in line with Hutton et al. (2009). All coefficients of ROA are negative and significant for all three variables of stock price crash risk. The coefficients of MB are positive in all regressions. The TURN variable is significant for models measured by CRASH_1 and CRASH_2, except for CRASH_3. Other variables, such as WRETURN and VOL, are not significant in explaining stock price crash risk for all models.
Examining the Relationship Between ESOP Policy and Stock Price Crash Risk in Interaction With the Firm Transparency
Implementing an ESOP policy in a transparent company can benefit shareholders in the long term, motivating them to hold shares and reducing the risk of stock price collapse (Liang et al., 2020). Table 7 report the relationship between ESOP policy and stock price crash risk in interaction with the firm transparency. In panel A, firm transparency is proxied by SAA. The negative coefficient of ESOP × SAA shows that if the company which implements a policy of issuing ESOPs, have high level of transparency, the stock price crash risk will decrease compared to a company with a low level of transparency. All models (2) in Panel A report a negative coefficient that is significant at the 1% level. This implies that a firm with a high level of transparency, which issues an ESOP with a ratio greater than 1% of the number of outstanding shares, has a lower stock price crash risk than a company with a low level of transparency. The coefficients of ESOPC × SAA are negative and significant in all models (3), which supports the result that companies with high levels of transparency will have a lower risk of stock price crash than firms with low levels of transparency when issuing ESOP shares to more than 10% of the total number of employees in the company.
The Relationship Between ESOP Policy and Stock Price Crash Risk in Interaction With the Firm Transparency.

Note. The dependent variable is stock price crash risk, proxied by CRASH_1, CRASH_2, and CRASH_3. The main variables are ESOP, ESOPR, and ESOPC, which represent ESOP implementation, ESOP rate, and ESOP concentration. The sample period was collected from 2010 to 2022. The t-statistics are not reported because lack of space. The model regressions were conducted with industry and year fixed effects. Details of variables are reported in Table 1.
*, **, *** indicate significance at 10%, 5%, and 1% levels, respectively.
In Panel B, we report the results when IR is applied as a proxy for firm transparency. For each of the models, the coefficients of ESOP × IR, ESOPR × IR, and ESOPC × IR are all negatively significant. This indicates that if the firms received IR reward, there will be a lower risk of stock price crash when implementing ESOP policies. Transparency rewards often signify that a firm is committed to clear and open communication with its investors. When a company is recognized for its transparency, investors are more likely to trust the firm’s management and its strategies, including ESOP policies. High transparency helps reduce uncertainty about the firm's operations and financial health. This can alleviate concerns that might otherwise lead to panic selling or negative market reactions, thereby reducing the risk of stock price crashes. Transparency rewards often mean that shareholders and potential investors have access to detailed and accurate information about the ESOP’s structure and impact. This informed decision-making process helps mitigate adverse market reactions. Transparent firms are better able to align ESOP policies with shareholder interests, ensuring that the benefits of ESOPs are well-communicated and understood. This alignment can foster greater acceptance and support from investors.
Following the methods of Panel A and B, we applied BIG4 as a proxy for firm transparency in Panel C. When crash risk is measured by the CRASH_1 variable, the coefficients of ESOP × BIG4, ESOPR × BIG4, and ESOPC × BIG4 are significantly negative at least at the 5% level. This suggests that if the company is audited by the big 4 companies, there will be a lower risk of stock price crash when implementing ESOP policies. However, when we use the variables CRASH_2 and CRASH_3 to measure stock price crash risk, we do not find any statistically significant coefficients of interaction variables.
In conclusion, the degree of transparency in a company has a considerable impact on the connection between ESOP policy and the risk of a stock price crash. The effect of an ESOP policy on crash risk is more severe for companies with low earnings quality, audited by non-Big 4 companies, and got non-IR reward. These results suggest that, all other things being equal, the relationship between ESOP policy and crash risk is robust when it interacts with the transparency characteristics of the firm.
Robustness Checks
Applying Two-stage Regression
Research on corporate finance is often affected by the problem of endogeneity. We are concerned about the endogeneity problem between the risk of stock price collapse and the company’s ESOP issuance policy because we cannot rule out the possibility that companies with a high risk of collapse often choose not to issue ESOPs. To overcome the endogeneity problem, the author uses the two-stage regression model of Gul et al. (2010).
In the first stage, we use a probit model to regress ESOP implementation, ESOP ratio, and ESOP concentration denoted Pr(ESOP/ESOPR/ESOPC), respectively, on firm-specific characteristics that may influence decisions about ESOP policy. Company characteristics here include variables such as: SIZE, MB, TURN, ROA, VOL, SALE, and WRETURN.
First, we modeled Heckman’s (1979) two-stage treatment effectiveness process. Specifically, we find λ (inverse Mills ratio) by probit regression in the first stage. After finding λ, we enter λ into the second-stage regression. Second, we run the main regression with the dependent variables CRASH_1, CRASH_2, and CRASH_3, respectively. The appropriate values of Pr(ESOP/ESOPR/ESOPC), denoted PredESOP/PredESOPR/PredESOPC, are independent variables.
The first-stage probit estimations are reported in Table 8. The results show that companies implementing ESOP policies are positively related to the variables MB, WRETURN, and SALE. And negatively related to SIZE and ROA variables. And there is no statistical significance for the variables TURN and VOL.
First-stage Regression.
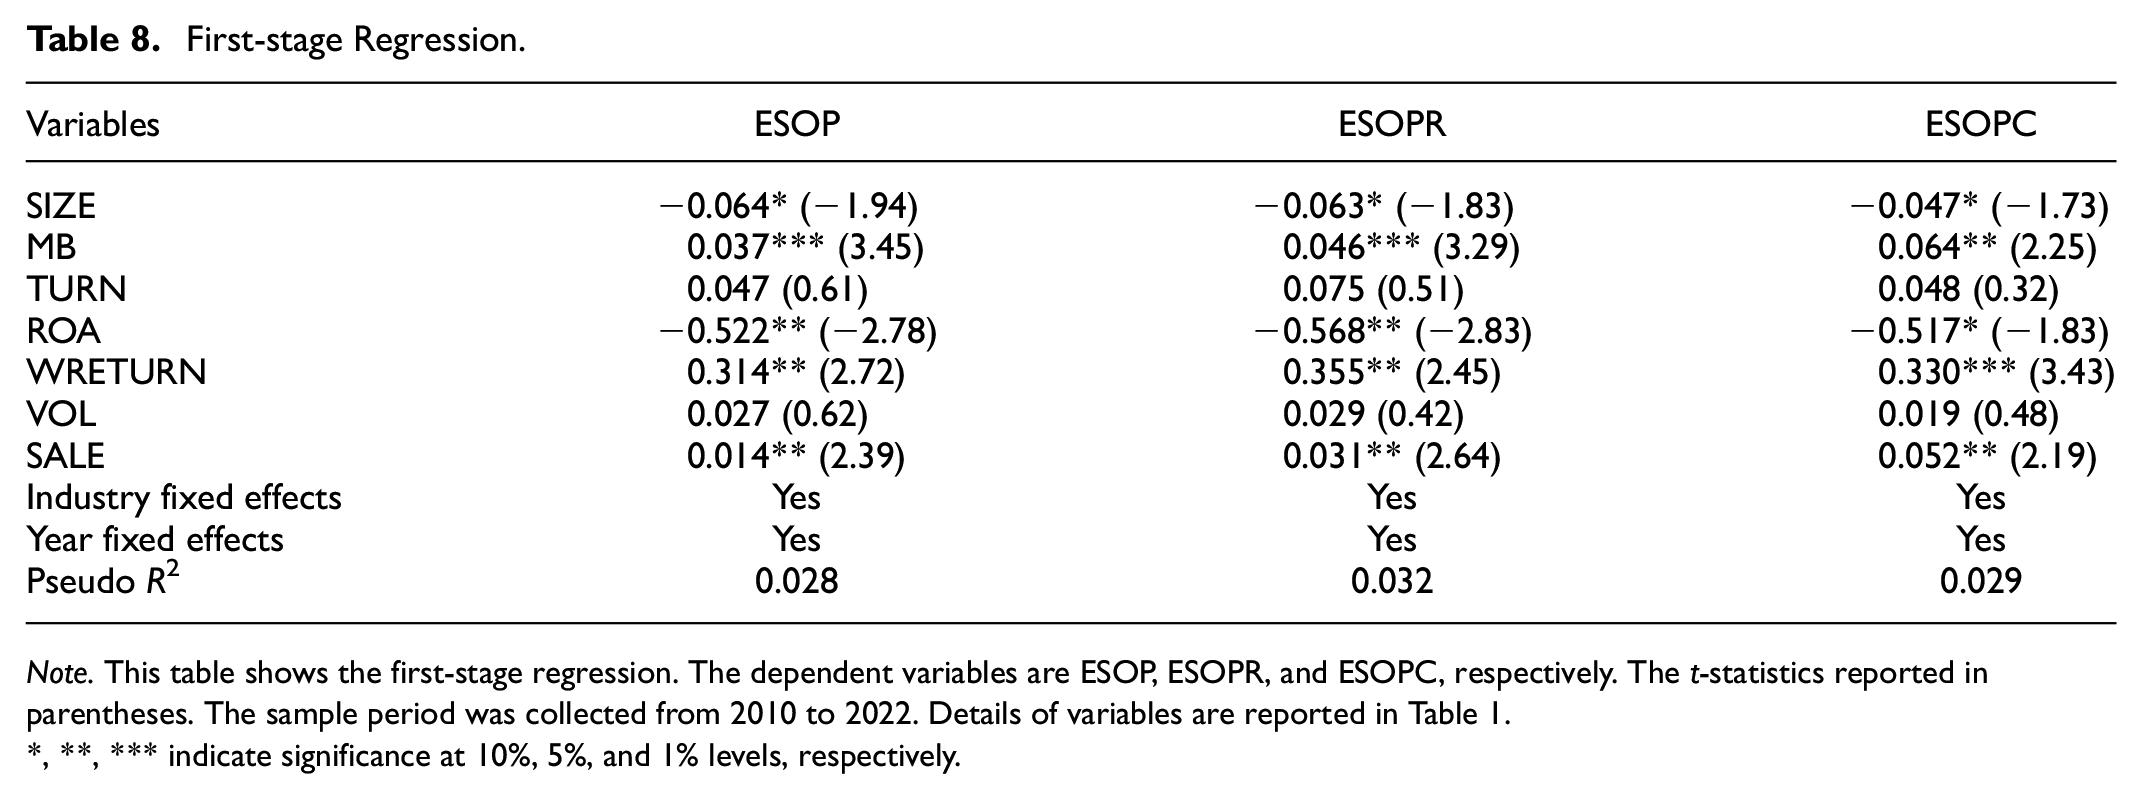
Note. This table shows the first-stage regression. The dependent variables are ESOP, ESOPR, and ESOPC, respectively. The t-statistics reported in parentheses. The sample period was collected from 2010 to 2022. Details of variables are reported in Table 1.
*, **, *** indicate significance at 10%, 5%, and 1% levels, respectively.
Table 9 reports the second-stage results with Mills’ inverse ratio included in Panel A, while Panel B reports those with PredESOP/PredESOPR/PredESOPC instead of ESOP/ESOPR/ESOPC. The results show that the coefficients of PredESOP/PredESOPR/PredESOPC and ESOP/ESOPR/ESOPC are all positively statistically significant, suggesting that correcting for self-selection bias does not change the main results presented in the previous tables.
Second-stage Regression.

Note. This table shows the second-stage regression. The dependent variables are ESOP, ESOPR, and ESOPC, respectively. The t-statistics reported in parentheses. The sample period was collected from 2010 to 2022. Details of variables are reported in Table 1.
**, *** indicate significance at, 5%, and 1% levels, respectively.
Alternative Measures of Crash Risk
In addition, following Hutton et al. (2009), we create JUMP as a binary variable. It takes the value of 1 if, during a calendar year, the weekly return specific to the firm exceeds 3.2 standard deviations from the mean, and 0 otherwise. Although we have change other measurement of crash risk, our main findings remain unchanged, as evidenced by the data presented in Table 10.
The Regression Results of ESOP Policies on Stock Price Crash Risk (JUMP).

Note. Dependent variable is JUMP. The main variables are ESOP, ESOPR, and ESOPC, which represent ESOP implementation, ESOP rate, and ESOP concentration. The sample period was collected from 2010 to 2022. The t-statistics reported in parentheses. The model regressions were conducted with industry and year fixed effects. Details of variables are reported in Table 1.
*, **, *** indicate significance at 10%, 5%, and 1% levels, respectively.
Alternative Measures of Firm Transparency
The other way to measure just the level of transparency of a company is to use the method of Jin and Myers (2006). In their study, transparency was assessed by measuring the variance between analyst earnings forecasts and the actual earnings reported by the company during the year, denoted as 'DIF'. The calculation for the DIF variable is as follows:

In which, α and µ represent the mean and standard deviation of the company’s profit forecasted by independent analysts, and N is the total number of analysts’ reports. DIF is multiplied by −1; therefore, a lower DIF value signifies high published information transparency.
The relationship between the stock price crash risk (JUMP) and the firm transparency (DIF) is displayed in Table 11. The positive and significant coefficients of ESOP × DIF, ESOPR × DIF, and ESOPC × DIF suggest that companies with significant differences between analyst earnings forecasts and actual earnings (low degree of transparency) will be at high risk of a stock price crash when implementing ESOP policies. This result is consistent to the previous findings of the Table 7.
The Relationship Between ESOP Policy and Stock Price Crash Risk (JUMP) in Interaction With the Firm Transparency (DIF).

Note. The dependent variable is JUMP. The main variables are ESOP, ESOPR, and ESOPC, which represent ESOP implementation, ESOP rate, and ESOP concentration. DIF is proxy of firm transparency. The sample period was collected from 2010 to 2022. The t-statistics are reported in parentheses. The model regressions were conducted with industry and year fixed effects.
*, **, *** indicate significance at 10%, 5%, and 1% levels, respectively.
Conclusion
This paper analyzes the impact of ESOP policies on the risk of stock price crash in interaction with company transparency. Using data collected from companies listed on the Vietnamese stock exchange from 2010 to 2022, we find that companies with ESOP policies are less likely to face the risk of stock price crash in the future. The rate of ESOP issuance and the concentration of ESOP policy are also factors that affect the possibility of stock price crash. Specifically, a company with an ESOP ratio higher than 1% will have a higher risk of stock price crash than a company with a ratio less than 1%. Conversely, a company that issues ESOPs to more than 10% of the total number of employees in the company will have a lower risk of stock price crash than a company that issues ESOPs to a small group of employees in the company
Additionally, ESOP policies have a more pronounced impact on crash risk for firms with lower transparency, as indicated by lower earnings quality, auditors who do not belong to Big4, or a large difference between the forecast and the company’s actual earnings. This finding implies that in a non-transparent information environment, ESOP policies will cause losses to shareholders rather than bring benefits to shareholders in the long term. Our main results are supported by a series of robustness tests, such as performing two-stage regressions or changing the method of measuring stock price crash risk and corporate transparency
Our study recommends that investors should consider the company’s level of transparency when it issues ESOPs to avoid the risk of stock price collapse. Similarly, regulatory agencies should only license ESOP issuance to companies with a high level of transparency to avoid affecting the risk of stock price decline in the market. Our results support those of Jin and Myers (2006), who highlight the significance of corporate transparency and investor protection in lowering the risk of a stock price crash. While various methods have been employed to measure transparency and crash risk, this research remains constrained by its sole focus on the Vietnamese stock market. Given that the Vietnamese stock market is considered a marginal market, it exhibits distinct characteristics diverging from both developed and emerging markets. Consequently, future research should extend its scope to international markets and facilitate cross-market comparisons.
Based on the findings and limitations of this study, several avenues for future research are suggested to deepen the understanding of the relationship between Employee Stock Ownership Plans (ESOPs), transparency, and stock price crash risk: Further research could compare the impact of varying levels of transparency within ESOP-implementing firms across different industries. This would help identify industry-specific dynamics and best practices for managing ESOPs to mitigate stock price crash risk. Investigating how different designs and structures of ESOPs (e.g., variations in vesting periods, eligibility criteria, and share allocation methods) affect stock price crash risk and overall firm performance could provide more detailed guidance for policymakers and corporate managers.
Footnotes
Acknowledgements
Not applicable
Authors’ contributions
The author confirms sole responsibility for the following: study conception and design, data collection, analysis and interpretation of results, and manuscript preparation
Declaration of Conflicting Interests
The author(s) declared no potential conflicts of interest with respect to the research, authorship, and/or publication of this article.
Funding
The author(s) disclosed receipt of the following financial support for the research, authorship, and/or publication of this article: This research is funded by Ho Chi Minh University of Banking
Ethics approval and consent to participate
Not applicable
Consent for publication
Not applicable
Availability of data and materials
The datasets used for this study are not publicly available as they are collected at high cost but are available from the corresponding author on reasonable request.