
Abstract
The present study examines the relationship between inclusive leadership (IL) and organization-based self-esteem (OBSE). Further, we examine the mediating role of climate for inclusion in this relationship. The authors present how inclusive leader behavior impacts employee psychological well-being through inclusion practices. From the 47 IT companies generated from Prowess IQ software, 352 IT/ITES working professionals in India were selected using purposive sampling, surveyed online, and analyzed using Smart PLS-SEM and bootstrapping methods. The study finds a significant positive relationship between IL and OBSE, partially mediated by one of the dimensions of climate for inclusion that is inclusion in decision making (DM). Inclusive leader behavior leads to an increase in the psychological well-being of an employee. Further, through climate for inclusion, the impact increases, implying that a culture that fosters inclusion is essential along with inclusive leader behavior. The study is among the few studies empirically examining the interrelationships between IL, OBSE, and climate for inclusion in an Indian context. In a diverse country like India, the study contributes to the developing area of inclusive leader behavior, leading to psychological employee well-being. The findings facilitate leaders and managers in understanding employee pulse toward leader behavior and inclusion practices and taking preventive measures if the effort is not perceived correctly. Further, through inclusive work practices, employee relations can be enhanced at the organizational level, leading to higher OBSE.
Keywords
Introduction
With globalization at its peak, the world has become one place. Today, communities and companies are characterized by a heterogeneous workforce, cross-cultural teams, multicultural organizations, foreign investments, and a diverse customer base (Kuknor & Bhattacharya, 2020; Inegbedion et al., 2020). This phenomenon has led to diversity and inclusion becoming an important business imperative to maintain harmonious employee relations. While diversity, equity, and inclusion (DEI) study and practice have been on the political and social agenda in many nations throughout the world for decades, the focus has been mostly on Western countries (Garg & Sangwan, 2021; Mor Barak, 2011; Nishii, 2013; Sabharwal, 2014). According to studies, workplace diversity and equality are not the same across cultures or nations, and more context-sensitive assessments are required, particularly in contexts that are less well-known or under-researched (Buddhapriya, 2013; Sharma & Panicker, 2022).
India has a different perspective on workplace diversity and inclusion compared to Western countries. Policies related to DEI are primarily formulated and governed by the constitution of India, established in 1950 by Congress. Article 15 of the Indian constitution prohibits discrimination based on caste, race, religion, gender, and place of birth. Furthermore, in the private sector, multinationals in India are looking for newer strategic ways to manage the diverse workforce and ensure they contribute to their full potential (Donnelly, 2015). The fundamental global change has forced Indian businesses and leaders to re-look at traditional leader behaviors and move to inclusive behavior. While early studies have linked inclusive leader behavior in the workplace with various employee outcomes like motivation, engagement, and performance (Sabharwal, 2014), the authors argue that several other related concepts to inclusion remain unexamined in theory and practice in the Asian context. For example, what is the influence of leader behavior on the perception of inclusion? Does inclusion have any impact on psychological behavior? Does the perception of inclusion vary from other countries and cultures in a diverse country like India? Because of the above background, the study intends to answer these research questions by empirically validating the evidence.
The scope of the study is the Indian Information Technology (IT) sector. As per the IBEF report in 2019, the IT industry in India alone contributed 7.7% to the GDP and led to the employment of around 4 million people. Further, the social composition of the IT sector is heterogeneous because of the nature of work (Buddhapriya, 2013). Women constitute 30% of the workforce in the IT sector. Moreover, differently-abled classes have become a part of the workforce due to positive government initiatives. Because of the scale of operations, the IT sector hires both locally and globally, leading to a diverse workforce. Hence ensuring this diverse workforce contributes to its full potential is a crucial task for organizations. The present study facilitates awareness among IT companies about the perception of inclusion amongst employees, how it benefits the organization, and the role of a leader in developing and maintaining an inclusive work environment.
Moreover, research indicates that leader behavior is an important factor in creating an ecosystem to facilitate an inclusive environment in the workplace (Carmeli et al., 2010; Sabharwal, 2014). Currently, many organizations still believe that inclusion is related only to disabled individuals (Nair & Vohra, 2015), which is misleading. A lot has been accomplished in the field of inclusion, from being concerned only with the inclusion of differently-abled people to accepting women in the workplace to accepting people in the LGBTQ community and finally acknowledging both visible and invisible diversity. Using a classical organizational setup, the authors claim that it is challenging for leaders to create variations needed to solve complex problems. Project teams, matrix structures, cross-functional teams, and other unconventional structures are different forms of collaboration. Fellow workers automatically confront employees with varying levels of education, experiences, functions, or values within such an organization. Hence, the leader’s accountability for creating mutual respect and acceptance culture among employees to ensure that employees contribute to organizational success becomes important.
Our study's contribution is threefold. Firstly, the study examines the impact of inclusive leadership (IL) on organization-based self-esteem (OBSE). The authors argue that an inclusive leader will positively influence psychological employee well-being through OBSE. Further, we examine the mediating role of climate for inclusion on this relationship. We examine how IL leads to a climate for inclusion, further leading to OBSE. Secondly, this study is unique in its approach by examining the inter-relationships between IL, climate for inclusion, and OBSE. To our knowledge, in the Indian context, this is the first attempt to investigate this association with empirical evidence. Thirdly, our study contributes to the body of knowledge, extending the understanding of employee perception toward inclusion and how it impacts organizational outcomes.
Research Question
The study attempts to answer the following research questions which further will facilitate in creating awareness and deeper understanding of organizational inclusion and inclusive leadership.
What is the impact of inclusive leadership on organization-based self-esteem?
Does climate for inclusion mediate the relationship between inclusive leadership on organization-based self-esteem?
In the Indian context, what is the interrelationship between inclusive leadership, organization-based self-esteem, and climate for inclusion?
Literature Review and Hypotheses Development
Inclusive Leadership
Several complex and multilevel constructed leadership processes are prevalent in organizations and workgroups, influencing business performance and organizational culture (Booysen, 2007; Garg & Sangwan, 2021). Different leadership theories have been identified that researchers can apply in practice. For example, in a transformational leadership environment, employers and employees share a shared vision and focus on mutual interests (Li et al., 2019); servant leaders are concerned with constituent service (Salib, 2014); transaction leaders are involved with a clear understanding of individual objectives, interests, and learning. Inclusive leadership (Randel et al., 2018) is distinct from other leadership styles like transformational and authentic leadership because it focuses on stimulating and valuing distinctiveness and on ensuring team members’ belongingness. Further, a growing body of research emphasizes the importance of leader behavior for fostering diversity and inclusion in an organization (Kuknor & Bhattacharya, 2022). Despite this, the results of IL have not always been positive. As IL increases from moderate to high level, it becomes difficult for the leader to integrate diverse views of employees. This, in turn, increases the decision-making process and personal effort and time to integrate differences (Pless & Maak, 2004). This further hampers the employee perception of the leader’s assertiveness, negatively affecting employee effort in job performance. In their study, Gotsis and Grimani (2016) investigated servant leadership as an indicator of a diverse, inclusive workplace. Salib (2014) found similarities between IL and servant leadership outcomes. Some of the other outcomes investigated were organizational effectiveness, building trust in leaders, fostering collaboration, and promoting ethical and responsible employee behavior.
Organization-Based Self-Esteem (OBSE)
OBSE is a psychological variable that demonstrates the belongingness of an employee toward the organization. OBSE is considered one of the factors impacting employee self-concept, and a leader’s role is deemed important in creating employee self-worth (Gardner & Pierce, 2015). Furthermore, the work environment is a key factor that influences OBSE followed by peer relations and direct experience of failure and success (Gardner & Pierce, 2015). The work environment includes aspects like the inclusion of ideas at work, involvement in decision-making, and an opportunity for self-regulation, which are an integral part of the concept of inclusion. Also, OBSE has shown a negative relationship with turnover intentions. Li et al. (2019) and Gardner and Pierce (2015) have studied variables that may impact OBSE: organizational commitment, turnover intention, absent intention, job satisfaction, and shared leader behavior were linked to OBSE.
Furthermore, positive employee perception of organizational support toward their aims and goals showed higher OBSE leading to a higher level of organizational performance and commitment while partially mediating OCB (Chen et al., 2005). Similarly, we predict that an inclusive leader will positively impact OBSE by encouraging psychological employee well-being. The present study explores a relatively new dimension of OBSE in the form of inclusion practices. If an organization practices inclusion, does it have any impact on OBSE? This is another area in which the study attempts to contribute.
H1: Inclusive leadership (IL) positively impacts Organization Based Self Esteem (OBSE)
Climate for Inclusion
As stated in the earlier section, inclusion is one step ahead of diversity and the endpoint of diversity. Barak (2000) defined inclusion as “A culture that recognizes, respects, values, and utilizes the talents and contributions of all the organization’s people—current and potential—across multiple lines of difference.” Inclusion revolves around feeling right in the organization. If an employee is disabled, the employee needs to feel that the organization is taking care of the disability, and at the same time, the peer group is treating the employee at par and does not feel left out. This is the feeling of inclusion. The same would apply to an individual from an LGBTQ (Lesbian, Gay, Bisexual, Transgender, and Queer) community. While the government has re-looked at laws on LGBTQ, resulting in both public and private sector companies opening up about their policies without any social taboo for the same (Kuknor & Bhattacharya, 2020). For companies to survive, it is essential to embrace the need of the hour to promote an inclusive environment at work (Sabharwal,2014). Inclusion practitioners believe the way forward to make inclusion an integral part of the culture is to start from the top management (Pless & Maak, 2004). We argue that the belief and conviction of the top leaders would make inclusion an integral part of the everyday work processes.
Further, three dimensions emerged from the literature explaining the climate for inclusion. The three dimensions relating to climate for inclusion are equitable employment practices (EE), integration of differences (ID), and inclusion in decision-making (DM) (Nishii, 2013). Foundations of employment practices enable in reduction of bias (Jaiswal & Dyaram, 2020). The authors of the present study argue that equal distribution of resources and a feeling of justice increase the normative membership of the employee group. This dimension is similar to the fairness of organizational practices relating to diversity climate, which helps to create positive employee perception.
We further predict that the three dimensions of climate for inclusion will fully mediate the relationship between IL and OBSE such that through the dimensions of climate for inclusion, IL will have a greater impact on OBSE.
Therefore, we predict that EE fully mediates the relationship between IL and OBSE.
H2: Equitable Employment practices (EE) as Organization Inclusion practice mediates the association between Inclusive Leadership (IL) and Organization Based Self Esteem (OBSE)
Secondly, the dimension of integration of differences explains the meshing together of a diverse population. Cox’s (2001) definition of a multicultural organization also indicated that an inclusive environment is characterized by integrating diverse employees and their identities to achieve competitive advantage. Furthermore, this dimension reflects the openness of employees to act and interact, being their true selves and engaging in the core aspects of their identity (Ramarajan & Thomas, 2010), eliminating undesirable consequences. Organizations that believe in integrating differences reduce negative stereotypes in the in-group and out-group members, thereby diminishing the factors that might fuel conflict (Al-Jubari et al., 2022). Therefore, we predict that ID fully mediates the relationship between IL and OBSE.
H3: Integration of Differences (ID) as Organization Inclusion practice mediates the association between Inclusive Leadership (IL) and Organization Based Self Esteem (OBSE)
Thirdly, the dimension of inclusion in decision-making explains the extent to which active participation is sort by employees irrespective of if the idea may upset the status quo. A dominant convention is treated as a value-enhancing proposition and not a threat in an inclusive environment. Moreover, such participative decision-making practice helps in reducing stereotypes and prejudice. Therefore, we predict that DM fully mediates the relationship between IL and OBSE.
H4: Inclusion in Decision Making (DM) as Organization Inclusion practice mediates the association between Inclusive Leadership (IL) and Organization Based Self Esteem (OBSE).
Conceptual Framework
Figure 1 presents the study’s conceptual framework where IL is the independent variable, climate for inclusion is the mediating variable, and OBSE is the dependent variable. The three dimensions to measure climate for inclusion are EE, ID, DM. Through the hypothesized relationships explained in the earlier section, the study examines in the model the direct and indirect relationship between IL, climate for inclusion, and OBSE.
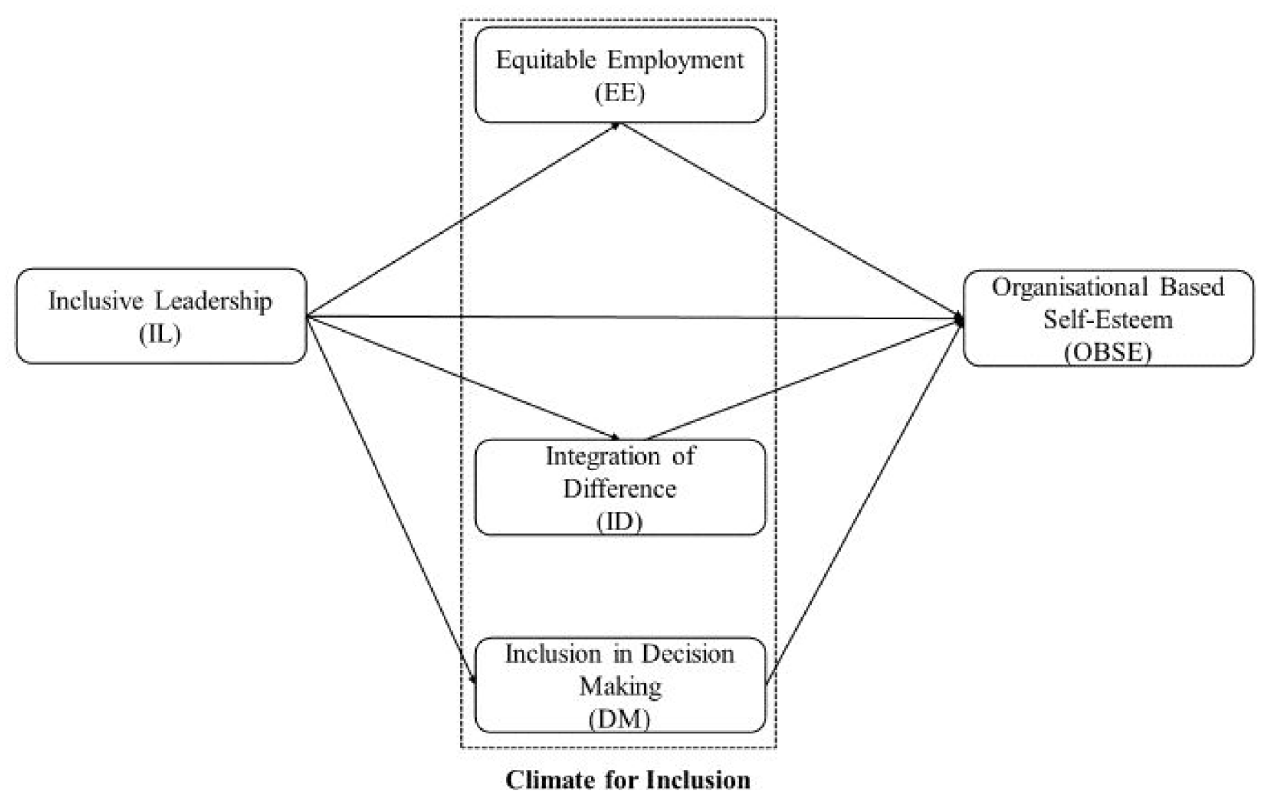
Conceptual framework that depicts the relationship between Inclusive Leadership (IL) and Organization Based Self-Esteem (OBSE) with mediating role of Climate for Inclusion.
Data Description
Sample and Survey Administration
The responses were collected from working professionals in IT sector in India. The IT industry is one of the highest contributers to India’s employment generation. With continuous growth and development in the IT sector both in terms of revenue and employability, it is important to ensure their policies and practices encourage a healthy work environment. The present study has adopted IT services because of their increasing contribution to the economy both Indian and global. Prowess IQ software was used to determine the total number of IT companies in India that are indexed in S&P index. The list contained 47 companies situated mainly in cities of Bangalore, Mumbai, Gurugram, Chennai and Pune. The respondents for the study were employees at any level from these companies. The respondents for this study were contacted through sources like LinkedIn profiles professional and personal networks. A comprehensive list of respondents was prepared. After verifying their credentials, these respondents were personally contacted online. A structured questionnaire was developed based on the items adopted from the previous research, and it was distributed to all 559 employees from August 2021 to October 2021 via email and messages. A follow-up was also taken by sending them an email after a week of sending the questionnaire to the respondents. Four hundred forty-seven questionnaires were received back from the respondents; out of 447 responses, 352 were completed in all aspects. Therefore, the final sample selected for this research is 352, resulting in an overall response rate of 62.9%. The description of the respondent’s demographic details is provided in the data analysis chapter.
Research Paradigm and Methods
The most suitable paradigm for this research is positivist (Saunders et al., 2009). In the positivist paradigm, research was conducted in a deductive manner; the research question and hypothesis were formulated by reviewing existing theories and literature. In this study, we examine the impact of IL on OBSE. The impact of inclusive leadership and organizational-based self-esteem has not been discussed in previous literature in the IT industry and suggested that these theories need to be tested in this context (Kuknor & Bhattacharya, 2020). A set of hypotheses (causes and effects) has been developed based on the existing theoretical foundations. Thus, the positivist paradigm was deemed most appropriate for this study (Saunders et al., 2009).
Under the positivist approach, quantifiable data will be collected, and the data will then be analyzed using statistical techniques. This approach enables the researchers to test the hypothesis before making conclusions and generalizations (Robson, 2002). A quantitative research design was adopted to collect and analyze data from existing literature based on hypotheses (causal relationships). Therefore, this study used quantitative method to collect the data and investigate the causal relationship between inclusive leadership and organization-based self-esteem.
Materials and Methods
Measures and Instrument Development
A previously validated scale was used to construct the questionnaire. In the light of the present study, some minor modifications were made to the instrument. The questionnaire consists of three parts; the first comprises the qualifying questions, the second consists of the questions related to the constructs being operationalized in the study, and the last consists of the respondents' demographic details.
This study adopted inclusive leadership scale proposed by Sabharwal (2014) to measure Inclusive leadership. The scale is comprised of six items. As an example, participants rate their agreement with the following unit: “The manager ensures that everyone contributes in a meeting,”“The manager is committed to hiring a workforce that is representative of all segments of society,”“The manager seeks my input before making important organizational decisions.” Participants rated their agreement with each unit on a five-point Likert scale (“1 = strongly disagree” to “5 = strongly agree”). The scale comprised of items related to inclusive leader behavior. This scale was used as it resonates with the attributes of an inclusive leader which is open communication, equal opportunity and participation in the workforce.
Another construct climate for inclusion scale is used to measure organization inclusion (Nishii, 2013). The scale included thirteen items organized into three categories: equitable employment practices (EE), the integration of differences (ID), and the inclusion of decision-making (DM) in the workplace. A sample item is: “This [unit] is characterized by a non-threatening environment in which people can reveal their ‘true’ selves.” Participants rated their agreement with each item on a five-point Likert scale with (“1 = strongly disagree” to “5 = strongly agree”). The scale was shortlisted for the study as it gives in-depth know-how about the various dimensions of organizational inclusion. Also this scale was among the initial few scales which showed high acceptance in both academica and practice.
Organization Based Self-esteem talks about the employee’s belief on whether they were taken seriously, management has faith in them, and being trusted, as obtained from Pierce et al. (1989). The scale comprised of eight items. A sample item is: “I am TRUSTED around here.” I am HELPFUL around here. The statements are rated using a five-point scale (“1 = strongly disagree” to “5 = strongly agree”). This scale was selected as the items explain clearly the the organizational membership phenomenon forming the central theme of organizational inclusion. Pierce et al. shortened the OBSE scale in 2004 with five items. But in the present study, the original scale was retained.
The initial draft of the questionnaire was sent to industry experts for content validation, including HR managers of the IT companies before sending it to the final data collection in the month of July 2021.This is being done to assess the quality of the items and their correlations with the construct. additionally, whether, the scale required some changes in terms of number of items measuring the construct. According to Cervilla et al. (2021), content validity can be used to assess the quality of the instrument even it is adapted from the existing scale. Based on the recommendations of the experts, few modifications were made to the survey questionnaire. After assessing the content validity, the final draft of the questionnaire was developed for conducting the survey.
Data Analysis and Results
Collected data was analyze by using PLS-SEM method with the help of SmartPLS 4.0 software.
Demographic Details of the Respondents
Of 342 respondents, 67.6% were male, and 32.4% were female. 89.2% of respondents belonged to the age group of 21 to 40, and 10.8% belonged to the age group of 41 and above. Two hundred respondents, which make up 56.8%, were graduates, 124 were post-graduates, which covered 35.2% of the sample, and the remaining 28 (8%) respondents had doctorate degrees. Around 36% of the respondents were mid-level experienced employees with 5 to 10 years of total work experience, while 29% had 10 to 15 years of experience. 74 respondents (21%), had an experience of less than 5 years, while 49 respondents, that is 13.9% had an experience of more than 15 years. Regarding the size of the company, 134 respondents (38.1%), were from companies with 20,000 and more employees. Seventy and Seventy-nine respondents, 22.4 and 19.9% of the sample were from companies sized between 500 to 2,000 and 5,000 to 20,000 employees respectively.
Finally, regarding job level in the present company, 133 respondents, who make up 37.8% of the sample, were individual contributors (specialist roles), followed by 78 (22.2%) operations managers/ senior managers, and 64 (18.2%) were team leaders. Hence, the demographic data shows that the research covered all the significant components of measuring respondents’ demographics.
Common Method Bias
Dependent variables and independent variables related questions were asked to the same respondent. Hence, there was a possibility of common method bias. This study used Harmon’s one-factor test proposed by Podsakoff et al. (2003) and the unrelated marker variable method suggested by Hair et al. (2010). The second method found an insignificant relationship between the marker variable and the four pooled constructs used in this study. Hence, the presence of CMB is negated. Since the total variance extracted by one factor is 46.42%, which is below the recommended threshold of 50%, there is no common method bias in this sample.
Measurement Model
The measurement model results with the construct items and factor loading are presented in Table 1. The convergent validity was assessed based on composite reliability (CR) values, Average variance extracts (AVE) and factor loadings. The values of composite reliability (CR) and average variance extracted (AVE) were above the threshold of 0.70 and 0.50 (Table 2) and factor loadings for all the indicators fell above .70, confirming good reliability (Hair et al., 2010). These results ensure the variable’s convergent validity (Hair et al., 2010). Moreover, all construct factor loadings were significant at 1% significance level, indicating that the measures are convergent (Hair et al., 2010). Additionally, the discriminant validity was also examined using the method suggested by Fornell and Larcker (1981) to determine whether the measures were discriminately valid, a discriminant validity test was conducted. According to Table 3, the AVE squared in the upper diagonal is greater than the coefficients of off-diagonal correlation, indicating that the measures are discriminant (Fornell & Larcker, 1981).
Summary of Measurement Model With CR, AVE, and Factor Loadings.

Source: Authors findings.
Construct Reliability and Validity.
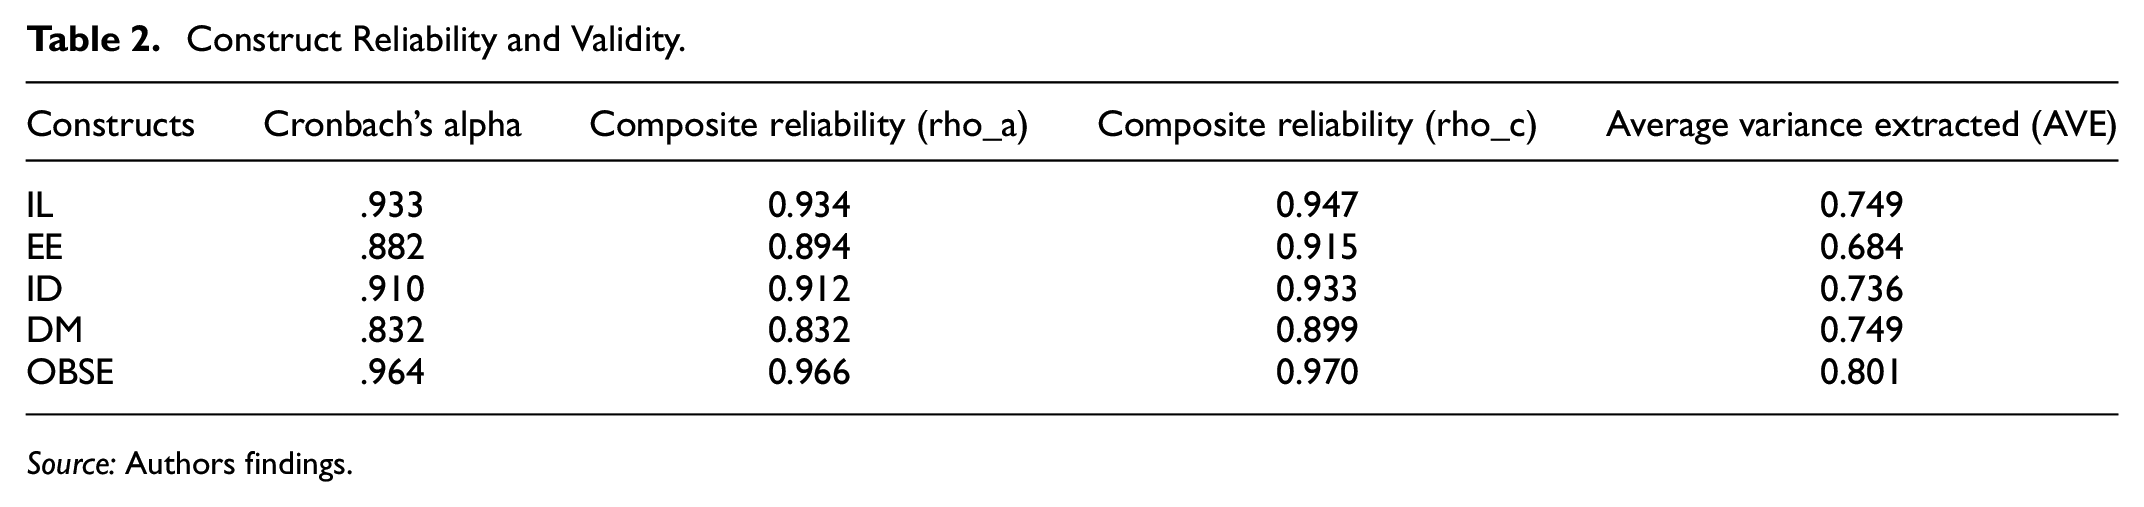
Source: Authors findings.
Discriminant Validity Calculated by Fornell-Larcker Criterion.

Note. The bold explaining the higher diagonal values then the off diagonal values, to confirm the discriminant validity.Source: Authors findings.
Structural Model
The study used the latest version of Smart PLS software to assess the final results of the model (Figure 2). Hypothesis testing was assessed in two stages; first, the direct effects of Inclusive leadership on OBSE (H1) and then testing mediating effects of EE, ID & DM on OBSE (H2, H3, & H4). The PLS-SEM measured both direct and mediating effects, performed by using Smart PLS 4.0 software. Additionally, a basic bootstrapping method using Bais corrected method at 0.05 significant level was conducted for assessing the P-value for checking the significance of the relationships. As presented in Figure 2, overall, the structural model assessed that inclusive leadership explains 50.7% variance in Organization based self-esteem (OBSE).

Smart PLS path diagram.
Table 4 presented the direct effects of independent variables over dependent variables. The result shows a direct impact of IL on OBSE with β = .235, T = 2.893, p < .01. Similarly, DM on OBSE (β = .410, T = 4.834, p < .01), IL on DM (β = .797, T = 34.614, p < .01), IL on EE (β = .634, T = 13.857, p < .01) and IL on ID (β = .497, T = 7.650, p < .01) are significant. Constrastingly, EE on OBSE (β = .019, T = 0.181, p = .857) and ID on OBSE (β = .130, T = 0.983, p = .325) were insignificant.
Path Coefficient.

Next, the mediation effect of EE, ID, and DM between IL and OBSE were examined. Before performing mediation analysis, the model was assessed on the minimum criteria to examine the mediation effect. To perform mediation analysis, the independent variable should significantly impact the outcome variable and mediating variables. As presented in Table 4, the direct effects of IL on DM (β = .797, T = 34.614, p < .01), ID (β = .497, T = 7.650, p < .01) and EE (β = .634, T = 13.857, p < .01) were significant. Further, the direct effects of DM, ID and EE on OBSE were assessed. Both EE (β = .019, T = 0.181, p = .857) and ID (β = .130, T = 0.983, p = .325) on OBSE were insignificant. Whereas, DM (β = .410, T = 4.834, p < .01) on OBSE was significant. Therefore, only DM mediation effect between IL and OBSE was assessed.
The specific indirect effects of ID, DM and EE is presented in Table 5. According to the result, inclusion in decision-making (DM) partially mediating between inclusive leadership (IL) and organization-based self-esteem (OBSE) (β = .327, T = 4.598, p < .01) as both the direct and indirect effect was significant. Contrastingly, integration of differences (ID) (β = .064, T = 1.034, p = .301) and EE (β = .012, T = 0.175, p = .861) do not show any mediation between IL and OBSE due to their insignificant direct effects on the OBSE. Hence, the hypotheses H1 that represents a direct effect of IL on OBSE is accepted. Similarly, the mediating hypothesis H4 which states the mediation effect of DM between IL and OBSE is accepted. However, H2 which states the mediation effect of EE and H3 which states the mediation effect of ID between IL and OBSE was not accepted.
Specific Indirect Effects.

Source. Authors compilation from smartPLS.
The specific indirect effects highlighted the effect of IL on OBSE under the influence of ID, DM and EE. The results show that ID and DM significantly mediate between IL and OBSE.
Total indirect effect between IL and OBSE was also assessed. As presented in Table 6, there is a significant indirect effect reported between IL and OBSE with β = .403, T = 6.009, p < .01. This is due to the specific indirect effect of DM between IL and OBSE.
Total Indirect Effect.

Source. Authors findings.
Finally The model fit was assessed based on the values shown in Table 7; The SRMR assesses the average magnitude of discrepancy between observed and expected correlations as a model fit criterion. Values less than 0.10 or 0.08 are considered a good fit. SRMR value falls below 0.058; hence, the model is fit (Hu & Bentler, 1999). Contrastingly, an NFI value close to 1 considers good fit. The NFI value in the present model is 0.82, which shows a reasonably fit. Therefore, the overall model fit is good as values fall within the threshold values of the parameters.
Model Fit.

Source. Authors findings.
Discussion
A new organizational and social expectation that has emerged for organizations is to give their employees an inclusive experience, resulting in organizational success (Inegbedion et al., 2020; Sharma & Panicker, 2022). In response to these expectations, the study contributes to the developing area of organizational inclusion (Mor Barak, 2011; Shore et al., 2011). The study examined the role of an inclusive leader on OBSE and found a significant positive relationship. The authors argue that the presence of a leader is important to support inclusion. With leader support, a culture of inclusion can strive and grow. Several researchers (Bizri, 2018; Shore et al., 2011) have also studied that leader behavior is important in fostering inclusion. The findings of the study reiterate the same claim with empirical evidence in an Indian context which is a unique contribution of the study.
Further, the study is among the few studies linking inclusion with OBSE (Cottrill et al., 2014). An employee with high OBSE is likely to appraise oneself as an organizational member contributing toward its growth. Also, the findings reconfirm the claim of (Usadolo et al. 2022) who suggested that self-esteem finds part of its origin through direct experiences. The authors argue that being able to fully contribute, be treated with respect, and participate in decision-making are all ways employees can directly experience inclusion. Triggered by an exclusionary environment, individual self-esteem is lowered, affecting behavioral outcomes.
Further, the study examined the mediating role of climate for inclusion. Contrary to our expectation, only one dimension of DM partially mediated the relationship between IL and OBSE. When a leader encourages employee participation in decision-making, it will lead to higher OBSE. A leader demonstrating behaviors like openness, accessibility, and availability (Cottrill et al., 2014), leads to a feeling of inclusion, further increasing employee psychological well-being and self-esteem. The findings reconfirm earlier research by (Usadolo et al. 2022), which strongly emphasizes individual levels of engagement and signals participation as a measure of a person's inclusion and status in the company.
Two dimensions of climate for inclusion, EE and ID, did not support the claim of mediation. While this claim was statistically insignificant, it contributes to certain researchers who claim there is no impact between the perception of inclusion and state self-esteem (Bizri, 2018; Guay et al., 2008). Since the arena of IL and inclusion is in its development stage (Nair & Vohra, 2015), further exploration can be in the direction of those relations which were not found to be significant in the study. Various contextual factors, including diversity management policies, procedures for fairness, and performance-oriented management systems, shape employees’ collective sense of being valued and included in the organization (Shore et al., 2011).
Furthermore, although the study did not directly test any social theories like Social Exchange Theory (SET), Optimal Distinctiveness Theory (ODT), the findings of the study are on similar lines that in return for social exchanges between employees, co-workers, and organization, the employees reciprocate with something equally valuable (Adams, 1965). Further, the authors suggest that the leader-member relationship is important in developing the psychological well-being of employees. Through respectful engagement, employees increase the likelihood that others seek—and presumably exchange—information and advice, increasing employee performance.
Theoretical Implications
The study provides four contributions toward theory and research. First, most of the studies in the area of inclusion have been in the western context (Shore et al., 2011; Sabharwal, 2014). The present study focused on how Indian business leaders practice inclusion and its effect on organizational outcomes, which is an area that is underdeveloped, having limited exposure both in theory and practice. The present study’s findings establish that even in Asian countries, inclusion is about value, respect, and people’s unique contribution toward the organization. Second, the study contributes to the theory of behavioral studies, specifically indicating how inclusive leader behavior can positively affect employee self-esteem. The study adds to the body of knowledge on OBSE and inclusion, indicating a favorable association between the two. Currently limited studies have drawn relationship between OBSE and inclusion (Cottrill et al., 2014). When employees feel included in the workplace and the leader demonstrates inclusive behavior, there is a positive increase in the pychological employee well-being, specifically their self esteem related to the organization they work in. Third, the theoretical model tested in the present study is a novel contribution to the literature examining the interrelations between IL, climate for inclusion, and OBSE. The model is one among the initial few attempts in theory and practice to examine the mediating role of climate for inclusion (Cottrill et al., 2014). Fourth, in literature, transactional leadership and Leader-Member Exchange (LMX) are known to have the most influence on SET. SET is one of the earliest studies in the domain of social sciences. The study looks at SET from a novel perspective of organizational inclusion which needs further attention. Moreover, the authors argue that inclusive leader behavior also influences SET such that if an organization practices equal and fair treatment for all and the leader role models this behavior, it will lead to favorable reciprocity from the employees, which is the basis for SET. The findings contribute to early SET theory research that states countries that follow collectivist cultures (e.g., India) are bound to engage in social exchanges, leading to a feeling of inclusion. This further can affect several organizational and employee outcomes in the process of social exchanges.
Practical Implications
Cross-cultural teams are an inherent part of the work culture in an IT sector due to the nature and service of a business. The sample of the study was from the indexed IT companies in India intending to support the sector in the area of diversity and inclusion efforts. By using the model presented here, organizations can create a work environment that accounts for workforce diversity demographics and promotes organizational change that promotes greater inclusivity in the workplace. Practitioners can benefit from the study by understanding that measuring the perception of inclusive leader behavior in the workplace is important. The study defines the dimensions of inclusion that managers can incorporate to measure if their efforts to create an inclusive environment are on the right path. Furthermore, the focus of organizations should move from the traditional outcomes and look at more extra-role behavior like the one mentioned in this study.
The role of a leader was also emphasized in the study. The study found that inclusive leader behavior can strengthen or weaken inclusion outcomes in the workplace. Management should create awareness among managers to practice behaviors like encouraging participation, belief, and conviction in diverse opinions, open communications, and creating an ecosystem of trust and respect. The study clearly states that a leader who is low in inclusiveness may weaken the relationship of the positive outcomes. Hence the findings of the study suggest that in everyday work activities, inclusionary measures can be adopted to increase positive employee perception. For example, in the decision-making process, managers can create heterogeneous groups in departmental meetings and seek active employee participation bringing in diverse opinions to better business results.
It is suggested by the scholar that the study’s findings could be applied to human resources development (HRD) practitioners. HRD research is increasingly focused on leadership and diversity (Garavan & Carbery, 2012). While emerging aspects like leadership, diversity, and culture receive little attention, HRD research continues to focus mainly on training and learning. Using Hollander et al.‘s (2008) findings, we found that leaders must regard development and inclusion as strategic imperatives for their organizations, incorporate them into HR policies, and elicit accountability at all levels of the organization. HRD practitioners should re-examine their existing policies to support the new kind of leadership in practice to enhance leader behavior and promote diversity.
Limitation and Future Scope of the Study
The study was not free from limitations. First, the results of the present study should be viewed under the context of this study only. Second, the scope of the study is limited to the number of respondents screened and selected to be part of this research. Third, the study limits to define climate for inclusion under three constructs; EE, ID, and DM. Lastly, in the light of time constraints, the present study applied only a quantitative approach.
The study provides scope for future research in the following ways. The dimensions and range of diversity and inclusion vary across cultures. Since India is known to be one of the most diverse countries, more studies are encouraged to examine how diversity and inclusion interact in the Indian context, increasing awareness among business leaders to utilize its benefits fully. Thus study from a local lens is proposed for future research. The present study focused on organizational-level functions of inclusion and leadership. Research scholars are encouraged to explore the relationship between inclusion and individual-level concepts like personality, locus of control, self-confidence, and self-esteem. Although the study discussed similarities between IL and other leadership styles, an in-depth study can compare IL with other leadership styles. The study examined three dimensions to measure climate for inclusion. Future research is encouraged to explore several other dimensions to measure inclusion depending on specific cultures. Future studies in this area will help expand the understanding of diversity and inclusion, which is presently limited to gender disparity.
Conclusion
Interest in the management of diversity and Inclusion in India is expanding rapidly among managers, academics, and policymakers. This has stimulated an increase in related inquiry. Contributing to this inquiry, the authors shed light on two emerging areas of research and practice: inclusive leadership and climate for inclusion. The study finds a positive relationship between IL and OBSE that is partially mediated by climate for inclusion. The study proves through empricial evidence that an Inclusive leader leads to an increase in the psychological well-being of employees. Further, through climate for inclusion, the impact increases, implying that a culture that fosters inclusion is essential along with inclusive leader behavior. Also, this study provided a preliminary indication that climate for inclusion can affect the relationship between inclusion and its outcomes. Therefore, companies need to invest in their leadership development programs to embrace inclusion.
Footnotes
Declaration of Conflicting Interests
The author(s) declared no potential conflicts of interest with respect to the research, authorship, and/or publication of this article.
Funding
The author(s) received no financial support for the research, authorship, and/or publication of this article.
Data Availability Statement
Data sharing not applicable to this article as no datasets were generated or analyzed during the current study.