
Abstract
Insurance promotes financial resilience for individuals and households, aiding them in risk management and welfare improvement. Despite concerted efforts by countries and international bodies to promote financial inclusion through various programs, the roles of life and non-life insurance remain underemphasized as measure to close the financial gap in most countries. Our research is motivated by the realization that the existing literature lacks a unified measure of financial inclusion that considers the impact of life and non-life insurance. The objective of this study is to examine the roles of insurance and banking services in financial inclusion through an innovative measure. This study employs Principal Component Analysis to compute different sets of a multidimensional Financial Inclusion Index (FI index) that incorporate banking, life, and non-life insurance indicators for 72 countries from 2015 to 2019. When the role of life insurance is considered, some countries experience significant leaps in their financial inclusion levels, while the opposite holds true for most countries regardless of their developmental stage. In the meantime, non-life insurance has a strong positive impact on the overall financial inclusivity of the sample countries, with more than half of them recording higher financial inclusion. These results necessitate a reevaluation of financial inclusion strategies worldwide. We advocate for a more comprehensive approach that integrates insurance services into the financial system alongside traditional banking, especially non-life insurance given its significant contribution in enabling financial inclusion.
Plain Language Summary
Insurance helps people and families manage risks and improve their well-being by providing financial security during tough times. Despite efforts by countries and organizations to make sure everyone has access to financial services, the importance of both life and non-life insurance in bridging financial gaps is often overlooked in many places. Our study is inspired by the fact that existing research doesn’t have a unified way to measure financial inclusion that considers how life and non-life insurance affect it. We aim to understand how insurance and banking services contribute to financial inclusion in a new way. We used a method called Principal Component Analysis to create different versions of a Financial Inclusion Index (FI index) for 72 countries from 2015 to 2019. These indices include information about banking, life insurance, and non-life insurance. When we look at the impact of life insurance, some countries show big improvements in financial inclusion, but for most countries, it doesn’t seem to make much difference, no matter how developed they are. On the other hand, non-life insurance has a strong positive effect on financial inclusion for most of the countries we studied. This suggests that financial inclusion strategies need to pay more attention to insurance, alongside traditional banking services. In particular, non-life insurance plays a crucial role in helping people access financial services.
Keywords
Introduction
Financial inclusion is the process of including the unserved and underserved in the formal financial system, enabling them to access affordable, suitable, and sustainable financial services. Recent studies are revealing evidence that the expansion of financial outreach and the usage of banking and insurance products reduce global poverty in all its forms and dimensions (Gutiérrez-Romero & Ahamed, 2021; Sha’ban et al., 2020). The promotion of equal financial opportunities allows individuals and households to better manage their financial lives, including effective money transfer, emergency preparedness, savings accumulation, and the creation of new business start-ups. From a macro perspective, financial inclusion drives economic development by creating opportunities for capital accumulation, encouraging higher investment, and catalyzing technological development.
Despite rapid globalization and digitalization reshaping society and market relations, nearly one out of four adults still lacks access to basic financial services and heavily relies on the informal financial sector globally, as indicated by statistics (World Bank, 2022). The Global Findex Database 2021 report published by the World Bank also highlights that while account ownership increased by 50% globally between 2011 and 2021, significant financial access gaps persist both nationally and internationally. In the promotion of financial inclusion, policymakers have primarily focused on banks, digital finance, and micro-finance. As a result, traditional insurance providers have only covered approximately 3.8 billion customers in emerging markets worldwide (Institute of International Finance, 2018). Despite the importance of insurance in the existing financial services continuum as it provides protection to the population against unexpected financial losses and is repeatedly emphasized by the World Bank (2022) as a driver for promoting greater financial inclusion, it has not received adequate attention. Therefore, our study is motivated by the observation that current scholarly works lack a cohesive assessment of financial inclusion that sufficiently incorporates the substantial influence of insurance.
In the existing literature, scholars heavily focus on the computation of financial inclusion indices based on services offered by conventional financial intermediaries, particularly banks, using various methods and approaches. However, relatively little attention is given to insurance, a fundamental pillar of modern financial markets. Moreover, there is a lack of empirical examination regarding how life and non-life insurance uniquely contribute to financial inclusion, similar to the studies conducted in the context of financial development (Arena, 2008). It is likely that life and non-life insurance have distinct effects on financial inclusion, considering that these two categories of insurance safeguard individuals and households from different types of risks. Life insurance provides coverage that disburses a specific amount to the insured or their designated beneficiaries upon a particular event, such as the death of the insured individual. In contrast, non-life insurance is a policy designed to protect individuals against losses and damages that fall outside the scope of coverage provided by life insurance.
The incorporation of insurance elements into the FI index is seen only in a handful of literature, such as Zhu et al. (2018) who consider the number of insurance institutions per 10,000 people as their proxy indicator while Kanga et al. (2021) who account for total insurance premiums in their measure of financial inclusion. The absence of a harmonized measure in the existing literature that accounts for the role of insurance in the computation FI index presents a drawback where our understanding of insurance-related driven financial inclusion could be impaired, given the respective functions of insurance in protecting against risks in different levels. Hence, it is important to address these questions. Does insurance contribute to higher financial inclusion? What are the roles of life and non-life insurance in promoting financial inclusion?
Driven by the scarcity of literature encompassing insurance in the measurement and understanding of financial inclusion, the objective of this study is to examine the roles of insurance and banking services in financial inclusion. This research thus adopts a two-stage Principal Component Analysis (PCA) to compute four sets of FI indices by incorporating banking, life, and non-life insurance indicators using data from 2015 to 2019 for 72 countries. Subsequently, the study uses the four sets of FI indices to make horizontal and vertical comparisons to test the role of life and non-life insurance in financial inclusion. By underlining the individual and aggregate effects of life and non-life insurance on financial inclusion, we intend to validate the hypothesis of this study that insurance contributes significantly to financial inclusion.
First, we apply PCA to estimate a group of three sub-indices representative of financial inclusion. Second, we re-apply PCA to estimate the overall financial inclusion index by using the previous sub-indices as causal variables. The steps are repeated 4 times for the 4 sets of FI indices. The reasons for choosing PCA as our computation method are multifold. PCA is widely regarded as a robust and rigorous statistical technique for identifying patterns, capturing underlying dimensions, and reducing multicollinearity within datasets. Its ability to derive a composite index by appropriately assigning weights to various indicators ensures a comprehensive representation of the multidimensional nature of financial inclusion. Moreover, our study’s focus on financial inclusion necessitates the consideration of multiple dimensions encompassing banking and insurance services. The sound mathematical foundation of PCA allows us to effectively integrate these diverse dimensions while preserving the inherent information contained within the dataset. The transparency and interpretability of PCA are particularly advantageous in the context of financial inclusion, as it provides a clear understanding of the contribution of each dimension to the overall index.
Our empirical analyses produce the following findings. When life insurance indicators are incorporated into the FI index, the sample countries in the medium financial inclusion group doubled. However, most countries saw a drop in their financial inclusivity with European countries like Jordan, Turkey, and Iceland are put up with the biggest adversity. A general drop in financial inclusion when considering life insurance could be explained by the low growth of the insurance sector in most developed countries given their matured social security system and the dominance of the banking sector in developing countries.
Meanwhile, non-life insurance has a marginally positive impact on the overall financial inclusion level in the sample countries. Overall, as many as 40 countries see an increment in their FI indices, while the rest record negative changes. Despite growing at a smaller magnitude, the number of countries with increased FI indices is more than those using only banking and life indicators. The result hints that non-life insurance drives financial inclusion better than life insurance.
In conclusion, insurance as an integral component of an inclusive financial system is crucial in advancing the financial inclusion of a given country. As a result, both developed and developing nations should promote financial inclusion through insurance to provide possibilities for a large segment of society to achieve better levels of well-being.
The contribution of this study is that we provide a comprehensive assessment of how bank-driven and insurance-driven financial inclusion differ from each other, and how their synergy can address the existing financial gap. By identifying the insurance gaps and opportunities for improvement in the financial sector, policymakers can develop strategies that leverage technological innovations to overcome the barriers to traditional insurance and drive financial inclusion by reaching the uninsured. Besides, the financial inclusion indices of a certain period allow policymakers to measure financial inclusion progress over time and re-evaluate the effectiveness of their financial inclusion policies. It also helps policymakers to compare the level of financial inclusiveness across different countries at different periods and identify the good insurance practices that can be mirrored by their countries in paving the way to close the gap.
The remainder of this paper proceeds as follows. Section “Literature Review” discusses the importance of insurance in financial inclusion and the main indicators used in financial inclusion. Section “Methodology” discusses the data, variables, and methodology used in the study. Section “Results and Discussion” explains the main results and implications. The final section concludes the paper.
Literature Review
Despite the recent growing attention, there is still no full agreement on what indicators best represent financial inclusivity. The basic financial services available in the market are payments, savings, credit, and insurance. While the indicators for financial inclusion measures used by studies in the existing literature deviate from one another, the more commonly used indicators are banking services. Beck et al. (2007) were one of the first studies to measure financial inclusion using banking services at a country level. They computed a FI index for 21 income groups using eight indicators from banking services, including deposits, loans, and payments. Their study found that the factors of banking services have contributed significantly to achieving a high level of financial inclusion. Using similar indicators, Sarma (2008) computed the first multidimensional FI index for 55 countries in 2004. The FI index allows vertical and horizontal assessment and evaluation to be made between countries.
Later, studies like Hou and Cheng (2017) further pointed out the importance of non-banking related financial products, such as insurance, stocks, and mutual funds in upholding development. Kumar et al. (2020) also called for future studies to shift focus to products other than banking services, such as insurance, pension, and remittances. Individuals and households are vulnerable due to their exposure to both idiosyncratic and covariate shocks, which often cause them to suffer a loss in income, if not their career (Panda et al., 2020). Unfortunately, they do not have a coping mechanism to resolve these risks and preserve their financial stability from unanticipated events. Insurance as a defensive mechanism has drawn much policy and research attention in the last 20 years, especially with the emergence of micro-level and innovative products, which offer more timely and affordable protection to the lower-income population (Hallegatte, 2014). Today, the collaboration between the banking and insurance industry with effective risk-sharing management is important to uphold the initiatives to deliver financial services to the underprivileged.
Nevertheless, only limited studies in the finance literature have emphasized the role of insurance in financial inclusion. For instance, Zhu et al. (2018) included insurance indicators in their FI index for China, proxied by the number of insurance institutions per 10,000 people, the number of insurance institutions per 10,000 square km, insurance density, and insurance depth. Their process of computing FI index revealed that the largest proportion of weights is attributed to the number of banking and securities institutions, while the weights of insurance are the most negligible. The findings denote that the insurance industry has a less significant role to play as compared to the banking industry in China due to the country’s heavy reliance on banking sectors as sources of financing. In other words, the lack of contribution of insurance to financial inclusion can be turned into an opportunity for China’s insurance providers as well should they appropriately capitalize on the market trend with the right adaptative mechanism.
On the cross-country level, Han et al. (2010) found that insurance market expansion plays a more prominent role in fostering financial inclusivity in developing countries than in developed countries. Kanga et al. (2021) also included insurance, proxied by life- and non-life insurance premiums to Gross Domestic Product (GDP), in measuring the penetration dimension of financial inclusion. Their findings show that insurance depth is favorable to economic growth in both the short- and long-run when financial technology (Fintech) is considered.
It is evident that in the limited studies that have considered the effect of insurance on financial inclusion, the effects of life and non-life insurance are not distinguished. Life and non-life insurance are different in nature, with the former providing protection for the family in the face of casualties, and the latter being related to insurance schemes that prevent people from suffering losses due to damage to assets. As both genres of insurance serve different functions and are designed to protect against different risks at different levels, it is worth exploring the degree to which life and non-life insurance contribute to financial inclusion. The findings will not only help us to better understand their respective roles but also be used as guidance for insurers in designing insurance schemes that make the most sense for the market they serve. Therefore, we propose the hypothesis of this study as follows:
H1: Insurance significantly contributes to financial inclusion.
Given the presence of these shortfalls in the existing literature, we examine the roles of insurance and banking services on financial inclusion by constructing four sets of FI indices using both banking, life, and non-life insurance indicators to show the individual and aggregate effects of different indicators.
Methodology
Drawing from the existing literature, the methods to compute an FI index can be classified as parametric and non-parametric. Sarma (2008) was the first to introduce the non-parametric method using a normalized inverse Euclidean distance method. Despite its instrumentality in computing an FI index, it receives criticism because its weight assignment relies mainly on researchers’ intuition, resulting in an arbitrary element in the FI index. Later studies addressed this methodological issue using a parametric method, namely Principal Component Analysis (PCA) introduced by Cámara and Tuesta (2014). PCA is a dimensionality reduction method that retains trends and patterns in financial inclusion data in weight assignment. After a thorough evaluation of the pros and cons of each method, this study computes a financial inclusion index using a two-stage PCA for the 72 sample countries from 2015 to 2019.
The sample countries (72 countries) are selected from the member countries on the World Bank website which has a full set of data for the study period. Using a large sample size to develop a consistent and robust financial inclusion would help to standardize the measurement for all countries in the sample.
Meanwhile, the period from 2015 to 2019 is important due to significant global economic and financial developments, including advancements in digital financial services and evolving regulatory frameworks. These changes could have had substantial effects on both the insurance and banking sectors and their contributions to financial inclusion. The decision to conclude our study with data up to 2019 was indeed influenced by the profound disruptions caused by the COVID-19 pandemic on global economies, financial systems, and various sectors. The pandemic brought about unprecedented challenges, altering the dynamics of financial services, including insurance and banking, and consequently impacting financial inclusion efforts. This notion is supported by Okot et al. (2022). The abrupt and diverse impacts of COVID-19 on different businesses and industries introduced a level of variability that is difficult to account for in a standardized analysis. Given these challenges, we opted to conclude our study with data up to 2019, providing a foundation for evaluating the roles of insurance and banking services on financial inclusion before the pandemic-induced disruptions. Our study aimed to establish a baseline understanding of the contributions of these services to financial inclusion, acknowledging that future research will undoubtedly explore the post-pandemic landscape in greater depth.
As suggested by Sarma (2008), this study uses availability, accessibility, and usage of financial services as dimensions of the FI Index. The intention to classify the selected indicators into three dimensions is twofold. First, different dimensions help us get more disaggregated information valuable for policy evaluation. Second, since we intend to capture the effects of insurance on financial inclusion, we estimate 4 sets of overall indices by inputting the banking-related and insurance-related indicators separately, where the sequence is as follows:
FIB—Banking indicators,
FIBL—Banking and life insurance indicators
FIBNL—Banking and non-life insurance indicators
FIBLNL—Banking, life, and non-life insurance indicators.
We develop an FI index via the PCA method to find the appropriate weights and postulate that the latent variable FII is linearly determined as follows:

where


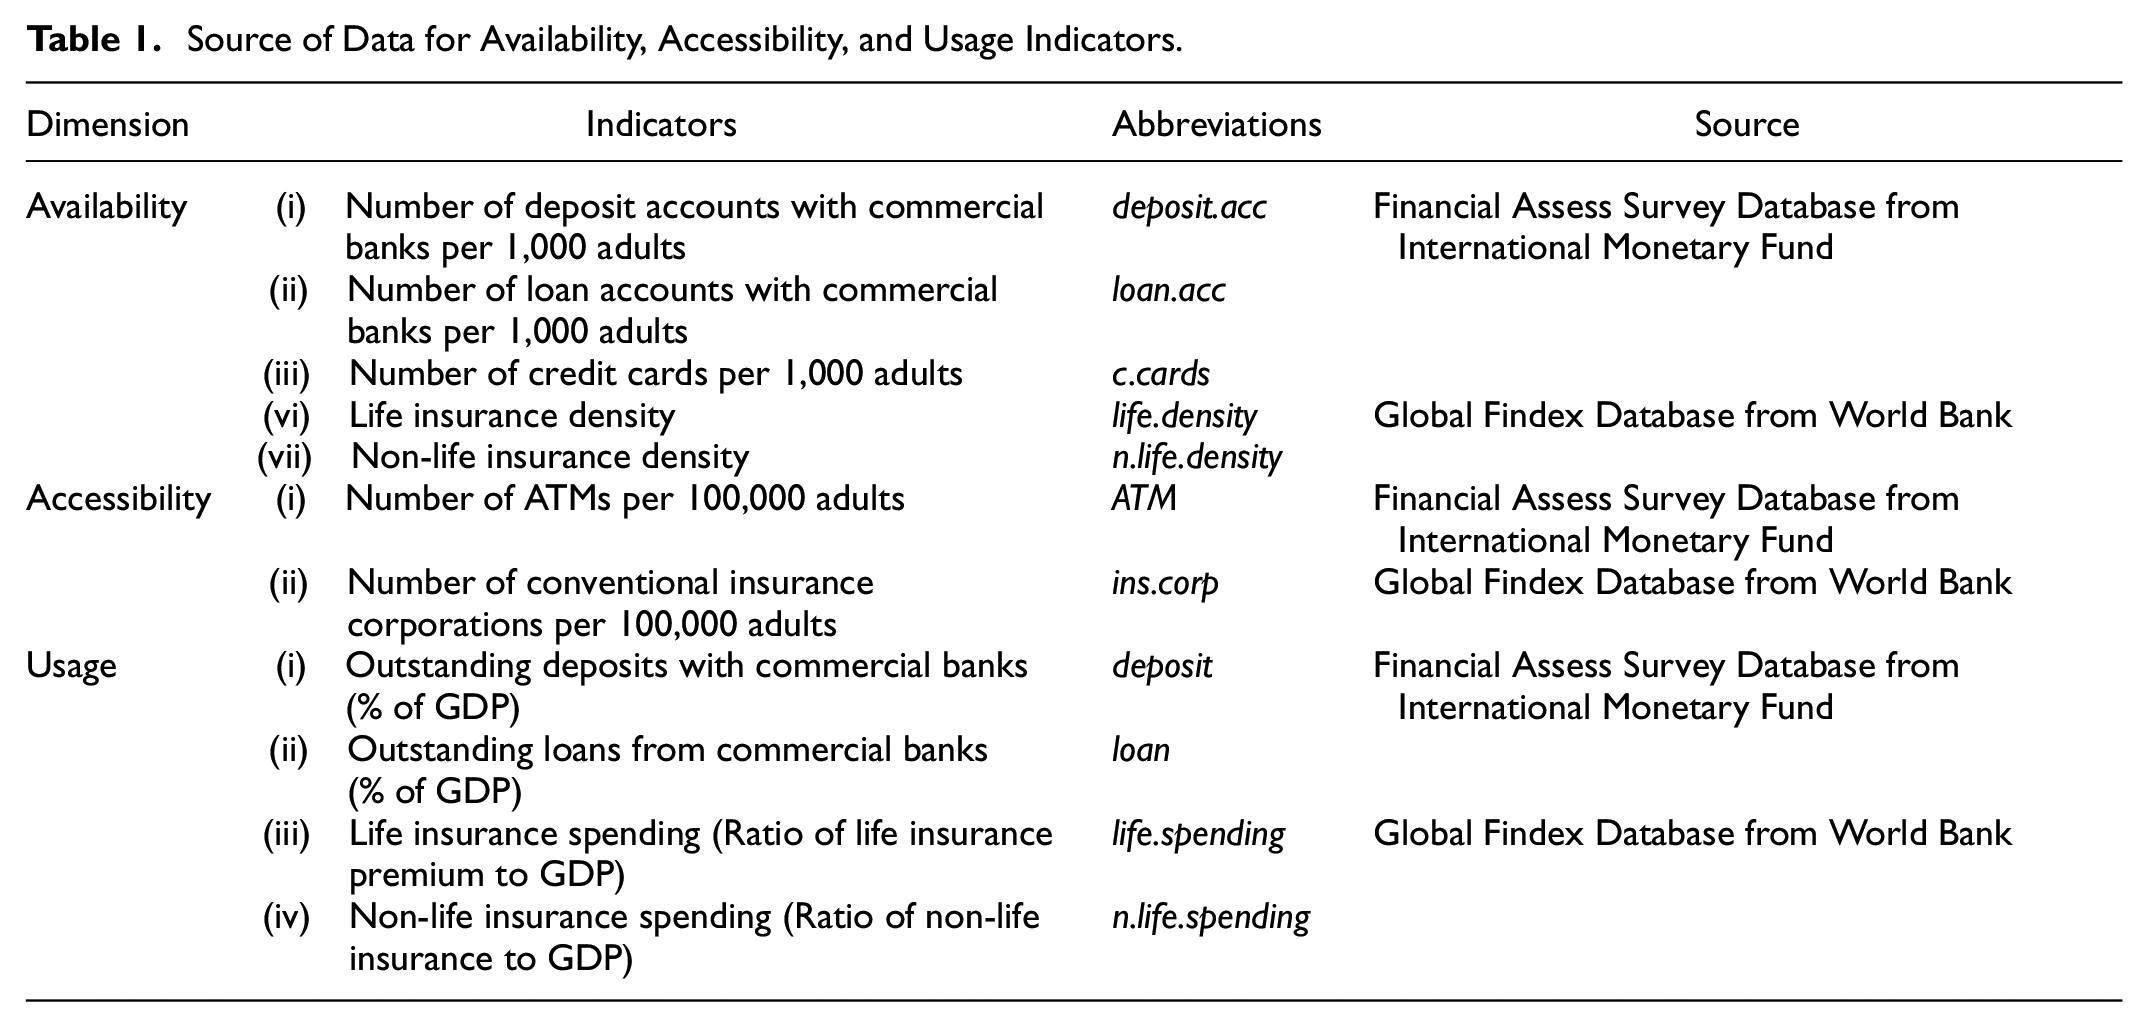
The sub-indicators for availability, accessibility, and usage dimensions are categorized into banking-related and insurance-related. The first dimension is availability. An inclusive financial system should encompass all segments of society. In other words, the availability of financial services has to be comprehensive, where everyone is permitted access to finance. Hence, this study uses (i) The number of deposit accounts with commercial banks per 1,000 adults, (ii) The number of loan accounts with commercial banks per 1,000 adults, (iii) The number of credit cards per 1,000 adults, (iv) Life insurance density (Ratio of life insurance premium to population), and (v) Non-life insurance density (Ratio of non-life insurance premium to population).
The second dimension is accessibility. According to Sarma (2008), bank transaction points in an inclusive financial system such as offices, branches, and ATMs must be readily available to users. As a result, this study includes (i) The number of ATMs per 100,000 adults and (ii) The number of conventional insurance corporations per 100,000 adults. The third dimension is usage. Kempson et al. (2004) found a paradox in some countries where financial services are not utilized despite most of the population owning a bank account. Therefore, merely having accounts and branches does not guarantee inclusiveness. To measure the consumption of financial services, this study includes (i) Outstanding deposits with commercial banks (% of GDP), (ii) Outstanding loans from commercial banks (% of GDP), (iii) Life insurance spending (Ratio of life insurance premium to GDP), and (iv) Non-life insurance spending (Ratio of non-life insurance to GDP).
The source of data is presented in Table 1.
Source of Data for Availability, Accessibility, and Usage Indicators.
First-Stage PCA
In the first stage, PCA estimates the dimensions—Availability, Accessibility, and Usage. There are three unobserved endogenous
Second-Stage PCA
By applying the same procedure described in the first stage, we estimate the weights of the three dimensions and the overall FI index by replacing
Results and Discussion
This study computes 4 sets of financial inclusion indices for 72 countries from 2015 to 2019. They are the banking financial inclusion index (FIB), banking and life insurance financial inclusion index (FIBL), banking and non-life financial inclusion index (FIBNL), and lastly, banking life and non-life insurance financial inclusion index (FIBLNL). The average value of the 5-year FI index is used to calculate the rankings of the sample countries for two reasons. First, the average value allows us to take into account the 5-years inter-temporal changes in the FI index of a given country. Second, it fulfills the main aim of this paper, which is to evaluate the difference before and after the incorporation of new indicators i.e. banking services, life, and non-life insurance. The countries are segregated into three categories (Sarma, 2008) depending on the FI index values:
0.5 < FII ≤ 1—high financial inclusion
0.3 < FII ≤ 0.5—medium financial inclusion
0 ≤ FII ≤ 0.3—low financial inclusion
Correlation Analysis
The correlation between the variables of this study was reported in Table 2 to identify the presence of multicollinearity problems. Most of the coefficients for all the variables are less than 0.8, except for loan.acc and c.cards, as both are lending in nature. Principal Component Analysis (PCA), which is used in this study, can reduce multicollinearity within datasets. PCA is employed to reduce the dimensionality of data while preserving as much of the variability as possible. It achieves this by transforming the original variables into a new set of variables, known as principal components, which are orthogonal (uncorrelated) to each other. Furthermore, other coefficients in this study do not suggest a serious multicollinearity problem (Gujarati & Porter, 2009).
Correlations Among the Indicators.

Trends in FI Index from 2015 to 2019—Banking (FIB)
Through the PCA method, we calculated the eigenvalues of each sub-index and estimated the latent variables: Availability
Table 3 Panel A shows the results of first-stage PCA. It is observed that the eigenvalues of the principal components (PCs) for all three dimensions in the corresponding order are 2.14; 0.65; 0.20 (Availability); 1.22; 0.77 (Accessibility) and 1.20; 0.79 (Usage). In all three dimensions, only the first component has an eigenvalue greater than 1. Therefore, we only take the first component for analysis and estimate the dimensions by using the weights assigned to the first PC of each dimension.
Principal Components Analysis Results for Sub-Indices and Overall FI Index.

In the second stage, by applying the same procedure described in the first stage, we apply the PCA method to the three dimensions to calculate their weights in the overall FI index. Table 3 Panel B shows the results of PC estimates for our composite FI index. The three PCs’ eigenvalues are 1.67, 0.83, and 0.49. This shows that only the first component has an eigenvalue greater than 1, so it is taken to find the weights assigned to the PCs. In terms of the PC structure, we observed that the first component, accounting for 55.8% of the total variation of the data, is contributed by all three dimensions. This indicates that the three dimensions measuring the same latent structure are interpreted as the FI level.
Table 4 shows the FI index results for all the sample countries from 2015 to 2019. The FI index computed using banking indicators serves as the baseline index, given that the banking sector has been making headway as the driver of the financial sector for a long time. The FI index comprising banking services is also the most commonly used to assess the degree of financial inclusion in the literature (Sarma, 2008; Beck et al., 2007). According to the standard Sarma (2008) set, there are 5 countries with high financial inclusion (FI index values of 0.5 or more), namely Luxembourg (0.930), Singapore (0.578), Australia (0.543), Bahamas (0.542), and Korea (0.500). Luxembourg tops the list with a steady slope in its FI index and a mean of 0.930. Luxembourg’s high financial inclusion could be attributed to the launching of Appui au Développement Autonome (ADA) over 25 years ago. ADA is an organization dedicated to reducing poverty by providing the concerned populations, mainly small and medium enterprises, with responsible financial and technical solutions adapted to their needs. Therefore, Luxembourg recorded a high banking-related FI index as ADA plays the role of a catalyst to generate and implement solutions that facilitate inclusive financial development in the country.
The Trend of the FI Index Using Banking Indicators

High financial inclusion is seen in Singapore, Australia, and the Bahamas could be their pro-business environment and good socio-economic well-being, making them international financial hubs that attract a large volume of migrations and non-resident banking activities. Meanwhile, Korea has a highly developed and profitable financial services sector, including Asia’s third-largest insurance and banking markets. Its strong fundamentals and active regulation underpin the stability of Korea’s banking sector.
Another 8 countries, including Aruba, China, Portugal, Spain, Iceland, Barbados, Belgium, and Malaysia, form the group of medium financial inclusion, with their FI indices ranging between 0.3 to 0.5. Half of these countries (Portugal, Spain, Iceland, and Belgium) belong to the Organization for Economic Cooperation and Development (OECD), where financial function underlies their inclusive growth. OECD members have continuously promoted an efficient, open, stable, sound, and market-oriented financial system that allows their people to go beyond rudimentary transactions and accumulate savings.
In Malaysia, the central bank has adopted a holistic framework formulated within the Central Bank of Malaysia’s Financial Sector Blueprint (FSBP) 2011 to 2020 to improve the overall well-being of communities on the aspects of convenient accessibility, high take-up, responsible usage, and high satisfaction of financial services. With these developing countries performing better than other developed countries in terms of banking-related financial inclusion, it raises questions about the notion that the financial system in developed countries is more inclusive.
Meanwhile, 59 countries are in the low financial inclusion group, with their FI indices ranging from 0.006 to 0.299. Ironically, some countries like Austria, Netherlands, Norway, and Sweden belong to developed countries. One possible reason could be the disruptions in the financial market and residents switching to services provided by Fintech companies, including crowdfunding platforms, the sharing economy, peer-to-peer lending, and services comparing loans. The FI indices remain worryingly low in many Association of Southeast Asian Nations (ASEAN) countries like Thailand, Brunei, and Colombia. Such low readings for FI indices of ASEAN countries call for greater effort and attention toward regional financial cooperation that targets accelerating financial inclusion.
The exciting news is that more than half of the countries (40 countries) show an upswing in their FI indices. Financial inclusion has been a highly emphasized universal reform agenda since the endorsement of the Financial Inclusion Action Plan in Seoul in 2010. This indicates that financial inclusion has created global awareness and gained a growing reputation as a policy objective in the sight of policymakers and governments in the past few years.
Trends in FI Index from 2015 to 2019—Banking and Life Insurance (FIBL)
Similar stages of the PCA method are repeated by incorporating life insurance indicators in the computation of the FI index. Table 5 Panel A shows the results of first-stage PCA. The eigenvalues of the principal components (PCs) for all three dimensions in the corresponding order are 3.15; 0.56; 0.20; 0.08 (Availability), 1.22; 0.77 (Accessibility), and 2.05; 0.74; 0.20 (Usage). In all three dimensions, only the first component has an eigenvalue greater than 1. Thus, only the first component is used to analyze and estimate the respective dimensions.
Principal Components Analysis Results for Sub-Indices and Overall FI Index.

Repeating the same procedure in the first stage, the PCA method is applied to the three dimensions to determine their weights in the overall FI index. Table 5 Panel B shows the results of PC estimates for our composite FI index. The eigenvalues of the three PCs are 1.80, 0.69, and 0.49. In terms of the PC structure, the first component accounts for 60.26% of the total variation of the data.
Table 6 displays the FI indices using banking and life insurance indicators. Some countries witness a soar when life insurance is considered in computing the FI index. Life insurance could contribute to financial inclusion in these countries. Nonetheless, most countries see a plummet in their FI indices. The high financial inclusion group members remain at 5, only the ranking varies. Luxembourg claims triumph in its ranking, followed by Korea. Meanwhile, Singapore is a major beneficiary of life insurance in Southeast Asia, given that its FI index increased by more than 0.05 despite the ranking unchanged. Singapore is the region’s most developed and highly concentrated insurance market, with the top 10 insurers accounting for 95% of the market share in 2019, driven by heightened demand for life insurance products. Approximately 71% of Singapore residents—or 2.85 million lives—were protected by Integrated Shield Plans (IPs) and riders that provide coverage on top of MediShield Life (Olano, 2020).
The Trend of the FI Index Using Banking-and-Life Insurance Indicators

Furthermore, Korea also benefited significantly from life insurance. Between 1990 and 2000, the life insurance industry recorded an average annual growth rate of 13%. According to the global data and analytics firm, Global Data, the life insurance industry will reach USD$117 billion in 2026, boosted by product innovations by insurers. Denmark and Italy are the high-income countries that reap the benefits of the flourishing of their life insurance industry, and their rankings leap from 32nd to 13th and 27th to 18th, with the main products being with-profit and unit-linked savings policies. The South African economy, the most developed country in Africa, also experienced an elevation in the FI index. South Africa is the largest and most established insurance market and accounts for 70% of total premiums in the continent. Steady economic growth in South Africa combined with a largely underdeveloped insurance sector underlies the significant scope for insurance growth. As a result, South Africa has become one of the hottest lands for investment and has attracted many established insurers. The result shows that the life insurance domain is heavily emphasized compared to the banking industry in these countries.
In developed countries like Poland, Bulgaria, and Iceland, their FI indices plunge when life insurance is considered. The general drop in financial inclusivity when considering life insurance could be explained by the low growth of the insurance sector in most developed countries given their matured social security system and the dominance of the banking sector in developing countries. Economic growth has been negligible or negative in major markets, and underlying economic fundamentals appear shaky. China’s FI index and ranking also dropped after adding insurance indicators. The Chinese government’s campaign against financial risk implies a drop in life insurance premiums, which forces insurers to phase out products that have underpinned their competitiveness (Costa, 2021). Asian countries, including Malaysia, Brunei, and Thailand, also experienced a decline in their FI indices. Despite being the fastest-growing insurance market globally, banking sectors remain dominant in delivering financial services in the region. Lastly, due to low insurance uptake, African countries’ financial inclusion is primarily unaffected by life insurance.
After incorporating life insurance in the FI computation, the number of the high financial inclusion group is invariant, whereas the moderate financial inclusion group members nearly doubled from 8 to 15. Although rankings are unchanged, most countries witness a remarkable contraction in their FI indices. Jordan, Turkey, and Iceland are put up with the biggest adversity. The rest of the countries remain in the low financial inclusion group.
Trends in FI Index from 2015 to 2019—Banking and Non-Life Insurance (FIBNL)
The third set of FI indices incorporates banking and non-life insurance indicators. In the first-stage PCA, the eigenvalues of the principal components (PCs) for all three dimensions in the corresponding order are 3.22; 0.51; 0.17; 0.08 (Availability), 1.22; 0.77 (Accessibility), and 1.93; 0.86; 0.20 (Usage). Similarly, only the first components are taken for further analysis as their eigenvalues are greater than 1, as shown in Table 7 Panel A.
Principal Components Analysis Results for Sub-Indices and Overall FI Index.

The same procedure is repeated on the three dimensions. Table 7 Panel B shows the results of PC estimates for our composite FI index. The eigenvalues of the three PCs are 1.86, 0.62, and 0.50. In terms of the PC structure, the first component accounts for 62.32% of the total variation of the data.
Table 8 presents the FI indices for 72 countries by including non-life insurance in the baseline index. Overall, as many as 49 countries see an increment in their FI indices, while the rest record negative changes. Despite growing at a smaller magnitude, the number of countries with increased FI indices is more than those using only banking and life indicators. The result hints that non-life insurance is critical for financial inclusion, but a noticeable slowdown has been seen in non-life insurance growth in recent years since 2017. More attention is necessary to the slowing growth of the non-life insurance industry to ensure its capacity to promote inclusive insurance is not undermined over time.
The Trend of the FI Index Using Banking-and-Non-Life Insurance Indicators

Korea is the biggest beneficiary of non-life insurance. During the COVID-19 pandemic, Korea’s leading insurance firms offered customized healthcare services through digital platforms, resulting in a more than 37% jump in the insurance companies’ earnings nine months into the first pandemic outbreak in 2019 (Asia Insurance Review, 2021) attributed to the high volume of new business. After considering non-life insurance, the FI index for Korea spurs from 0.499 to 0.641 and ranks one of the tops, further reinforcing the importance of insurance among Koreans. However, Han-na (2021) cautioned that insurers in Korea must continue discovering new revenue sources amid the rapid growth of the elderly population to continue reaping the benefits of financial inclusion.
Singapore experienced the largest plummet of its FI index from 0.578 to 0.552, although its ranking was unchanged. The drop in Singapore’s FI index depicts that its life insurance domain plays a more critical role in supporting the insurance industry. A substantial increment of more than 5% in the FI index is recorded in the Bahamas, Barbados, and Denmark, implying that non-life insurance is widely accepted among the people in these three countries, and their insurance markets are characterized by strong competition for consumers. Meanwhile, the Chinese government’s campaign against financial risk implies a drop in non-life insurance premiums, which forces insurers to phase out products that have underpinned their competitiveness (Costa, 2021). As a result, a drop in ranking is recorded by China despite its FI index hardly changing.
Non-life insurance does not benefit most countries in terms of their financial inclusion level. For example, Malaysia’s ranking drops from 14th to 17th due to its flat premium growth relative to other countries. The sluggish sales have brought to stark notice the need to improve coverage for better access to healthcare and financial security among Malaysians. African countries maintain the lowest financial inclusion worldwide, with or without insurance. Despite a decline in FI indices among many countries, the overall impact is more optimistic than the index using banking (
Trends in FI Index from 2015 to 2019—Banking, Life, and Non-Life Insurance (FIBLNL)
Lastly, we compute the FI indices incorporating banking, life, and non-life insurance indicators. In the first-stage PCA, the eigenvalues of the principal components (PCs) for all three dimensions in the corresponding order are 3.75; 0.72; 0.27; 0.16; 0.08 (Availability), 1.22; 0.77 (Accessibility), and 2.30; 1.02; 0.46; 0.20 (Usage). For Availability and Accessibility, only the first component has an eigenvalue of greater than 1, whereas, for Usage, the first and second components have eigenvalues greater than 1. Hence, for Usage, the first and second components are taken together for analysis.
The same procedure is repeated on the three dimensions. Table 9 Panel B shows the results of PC estimates for our composite FI index. The eigenvalues of the three PCs are 1.97, 0.58, and 0.43. In terms of the PC structure, the first component accounts for 65.85% of the total variation of the data.
Principal Components Analysis Results for Sub-Indices and Overall FI Index.
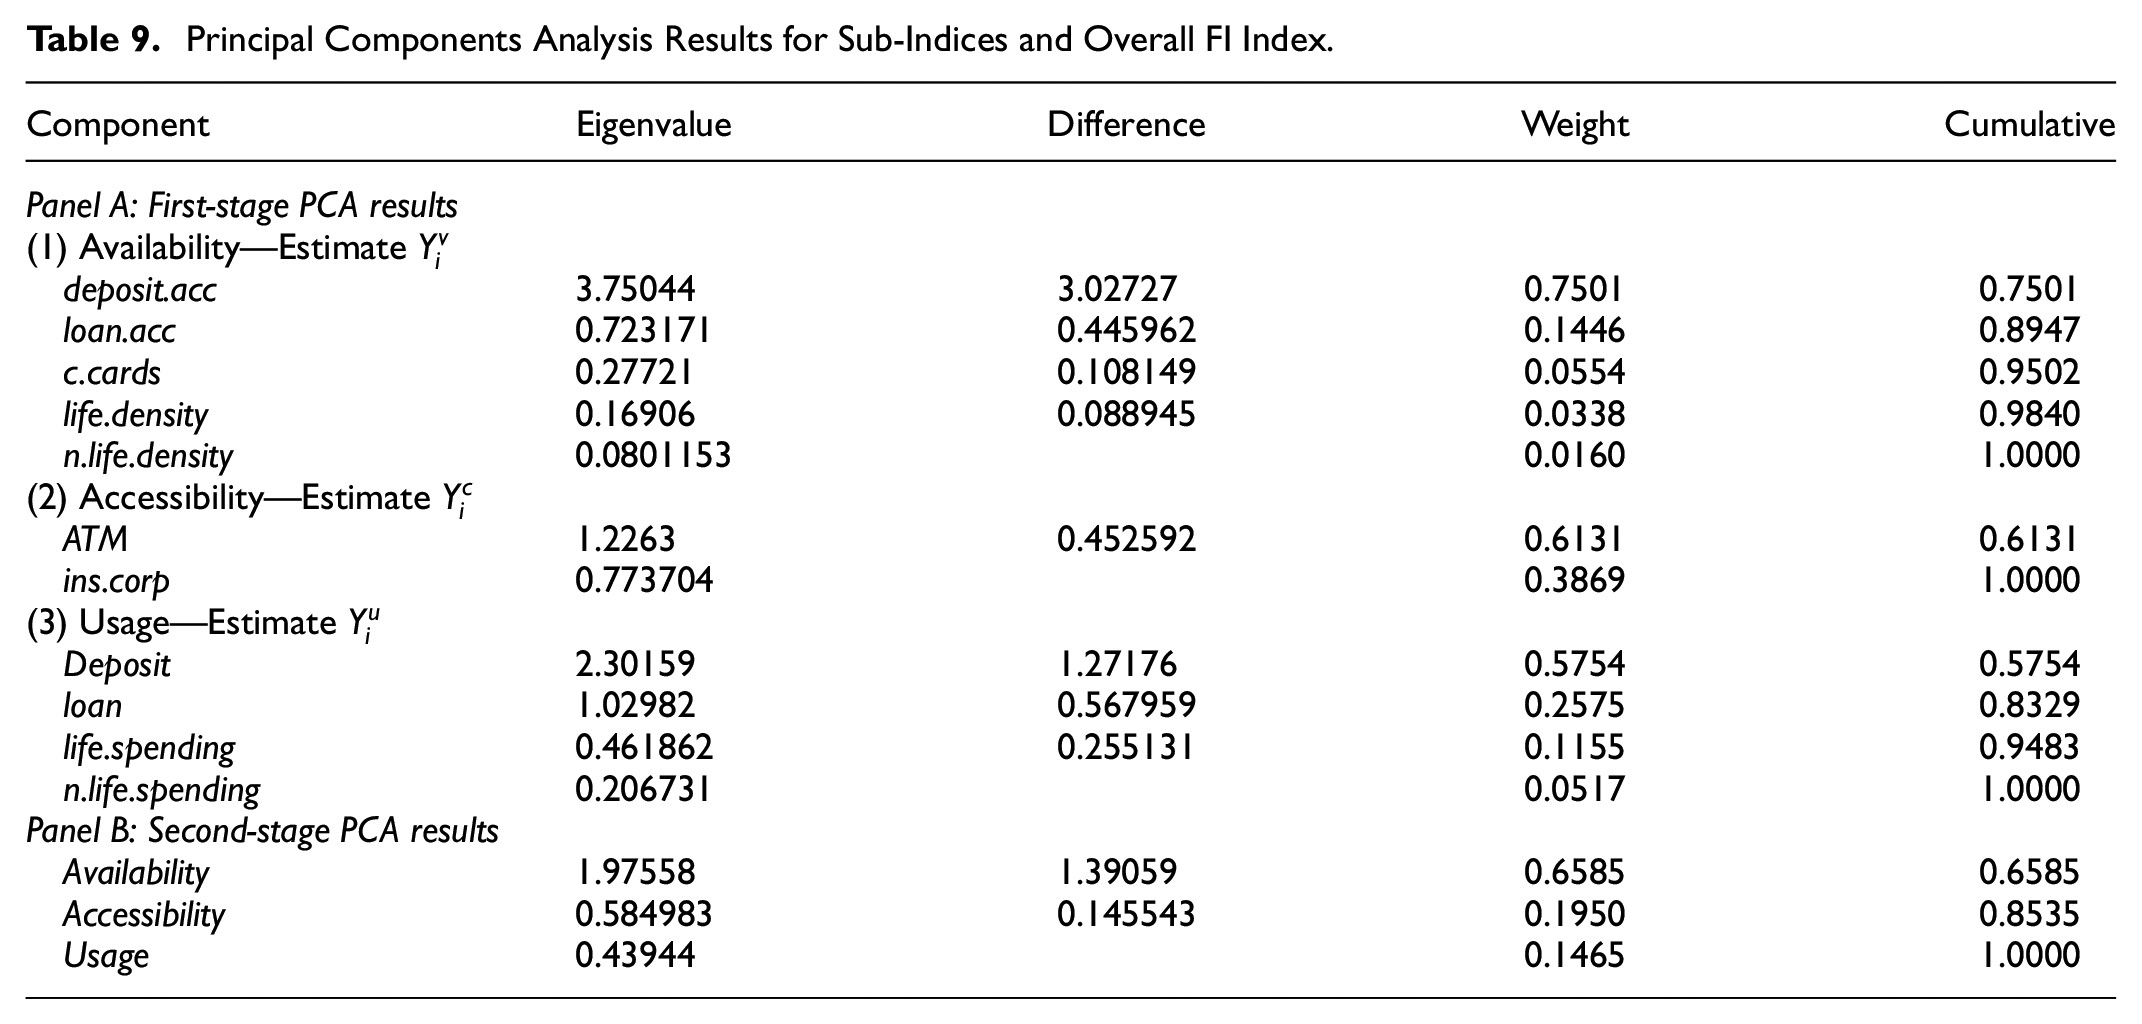
Table 10 presents the FI indices for 72 countries by incorporating banking, life, and non-life insurance indicators. After combining life-and-non-life insurance, there are 30 countries whose FI indices increase compared to the ones using banking indicators only. Other countries see their FI indices slightly decline. Therefore, it could be seen as an indication that most countries lack emphasis on the insurance market development, especially life insurance. There is a great similarity between the FI index using only non-life insurance and the FI index using both life and non-life insurance, indicating that non-life insurance plays a more dominant role in the insurance sector as the driver of financial inclusion. Meanwhile, adding a life insurance indicator to the FI index could dampen the score for most countries because the recovery of the insurance industry is highly correlated with that of the overall economy. Any reduction in the size of the economy because of the dramatic fall in productive activities and the increase in unemployment could adversely affect premium income to life insurers. Innovative initiatives and well-reasoned digital strategies drive the insurance industry towards new services and business models.
The Trend of the FI Index Using Banking-Life-and-Non-Life Insurance Indicators
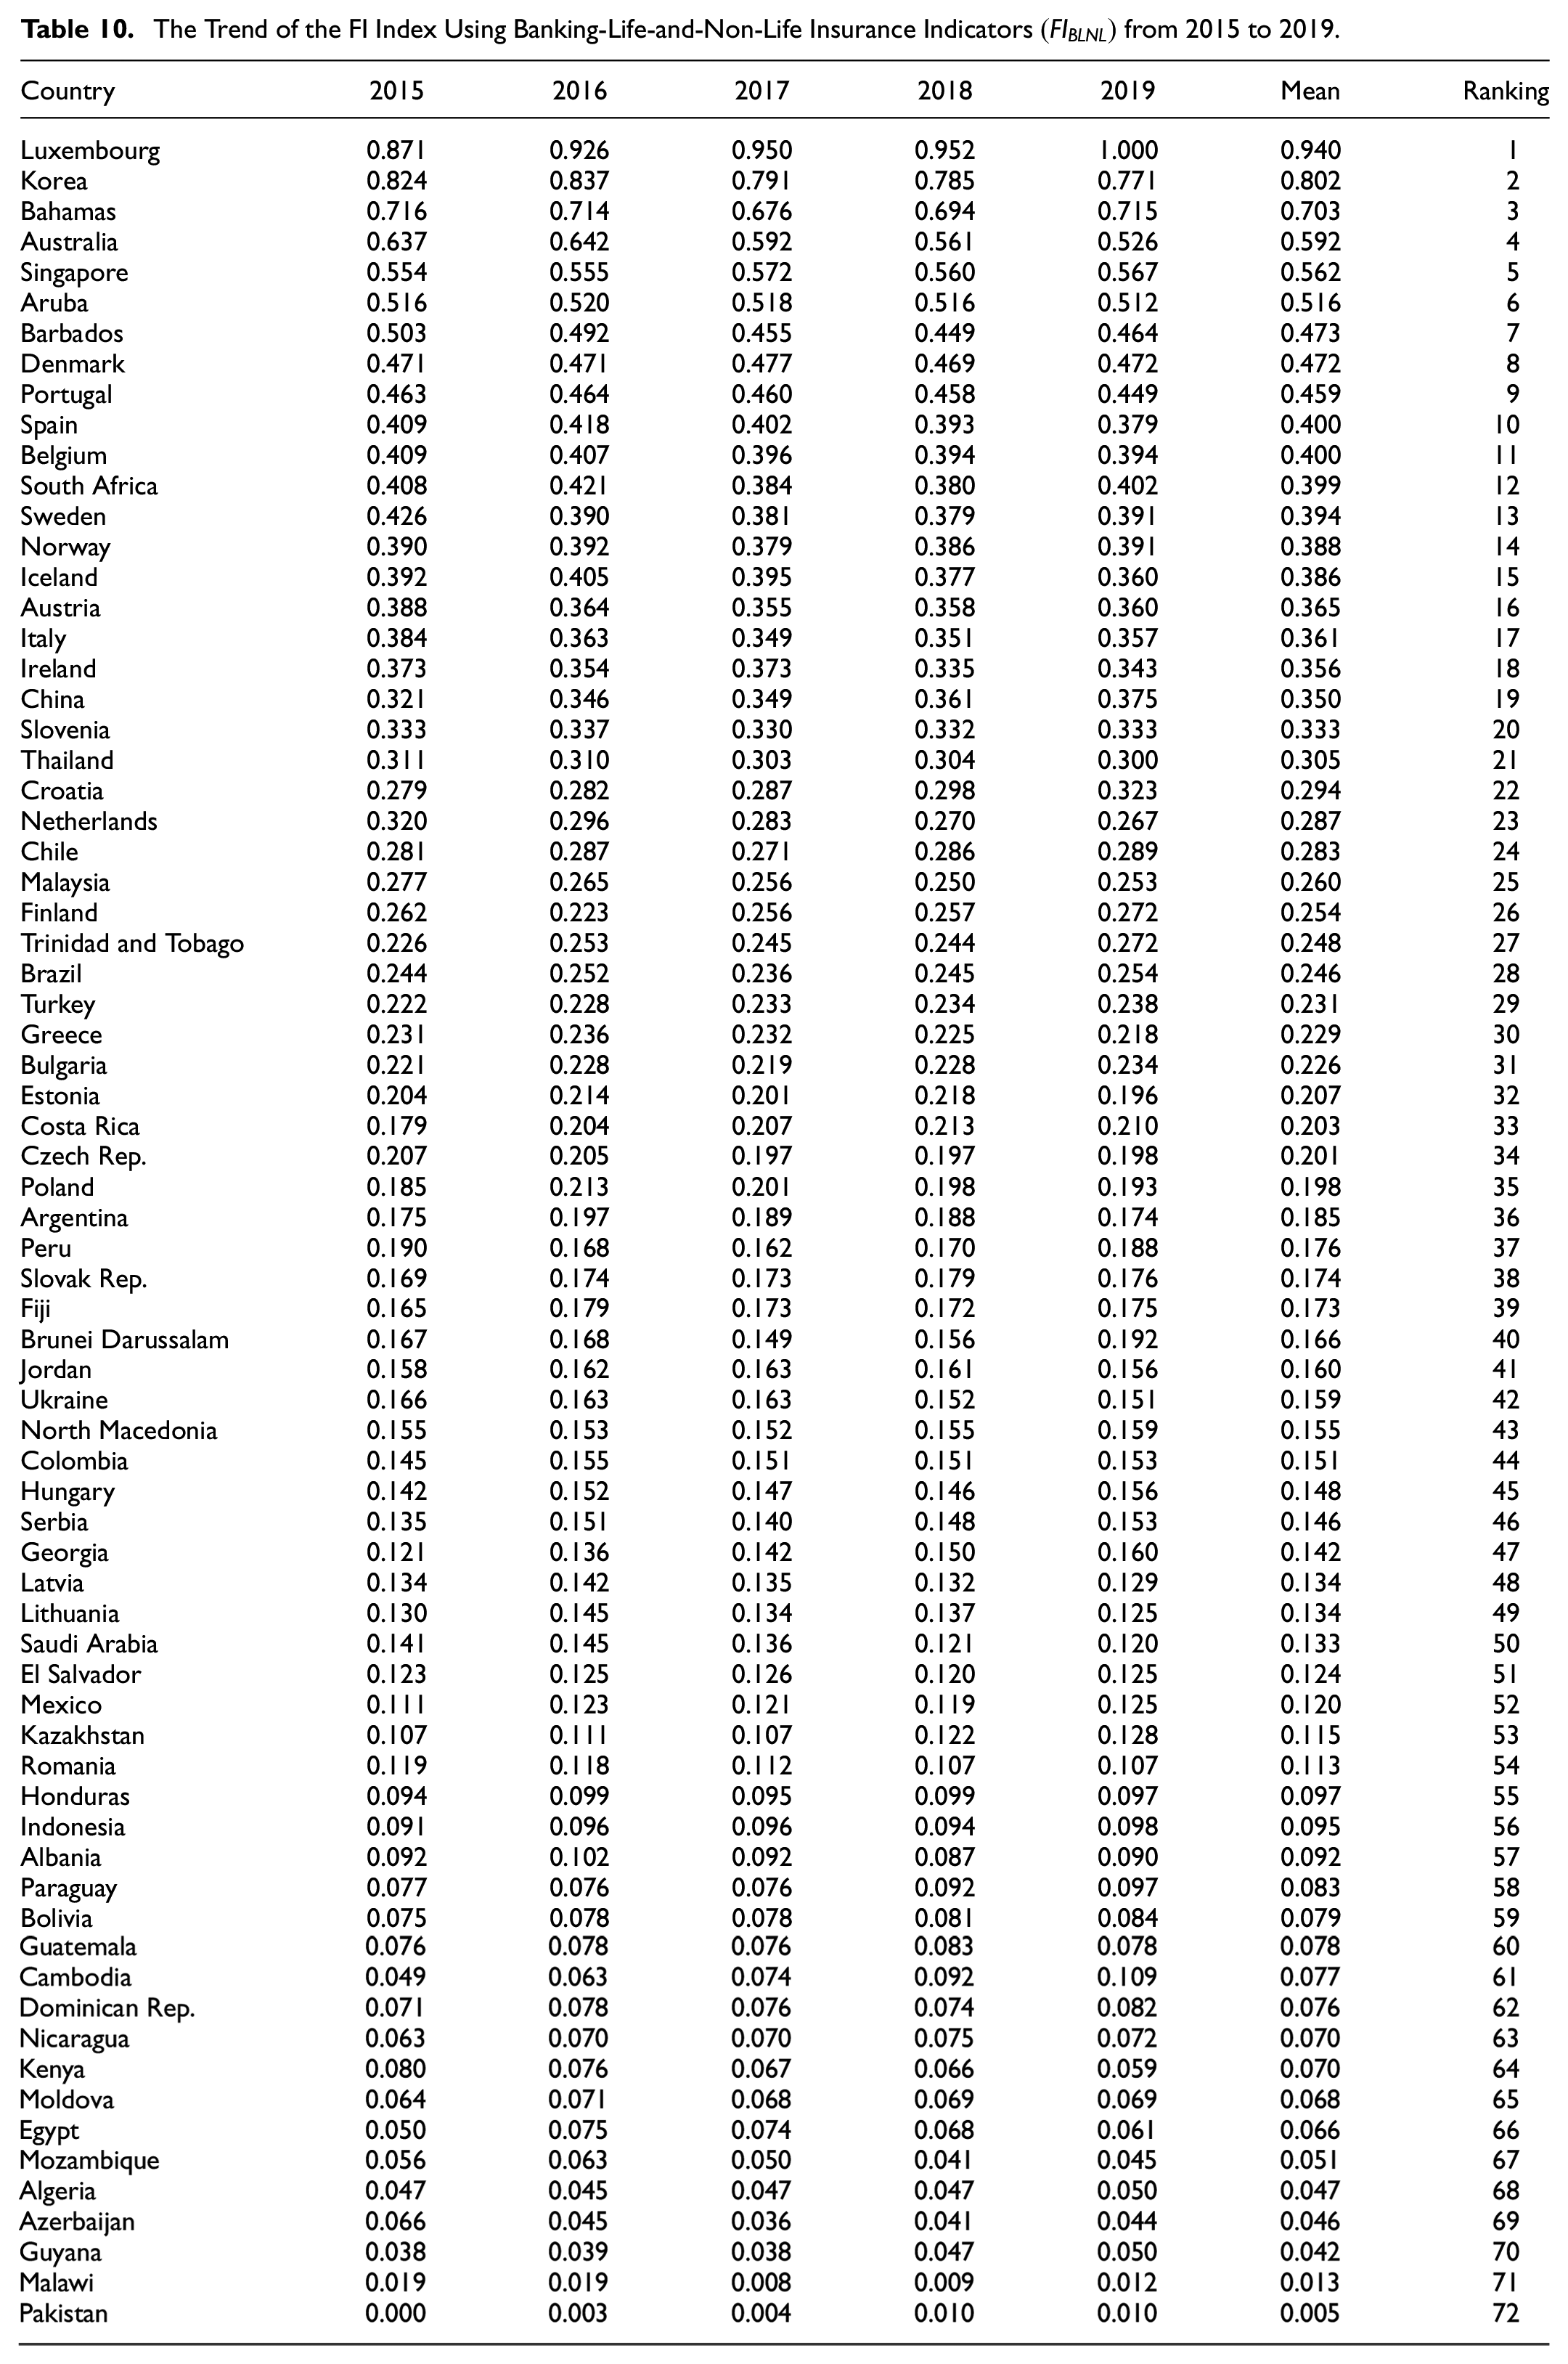
The countries of the high financial inclusion group increased from 5 (Luxembourg, Korea, Bahamas, Australia, Singapore) to 6 (Luxembourg, Korea, Bahamas, Australia, Singapore & Aruba). Meanwhile, the countries of the medium financial inclusion group also expanded from 8 to 15. Despite prevailing economic headwinds, non-life insurance is in a strong position to capitalize on growing global demand and stable macroeconomic fundamentals. An important implication is that risk awareness is raised among consumers and businesses following the shock of COVID-19. Given its capacity and expertise in absorbing risks, non-life insurance must be emphasized to make societies and economies more resilient.
In short, life and non-life insurance have played a prominent role in upholding financial inclusion. Nonetheless, life insurance appears to have only a marginally positive impact on overall financial inclusiveness in the sample countries compared to non-life insurance. This indicates a lack of contribution of the insurance spectrum of financial services to financial inclusion, especially life insurance. In the efforts to promote financial inclusion, countries must focus on their insurance industry to ensure a holistic development that best safeguards their people’s interests.
Robustness Check
This study conducts a robustness check to examine the FI index’s sensitivity by replacing the insurance proxy with the ratio of insurance company assets to population (Availability) and the ratio of insurance company assets to GDP (Usage) using the same PCA method.
Table 11 shows the FI index results of countries and their respective rankings. The results of the FI index rankings of the countries in Table 11 are slightly different from those of the FI index computed earlier, but the difference in ranking is not more than 5 ranks. The computation of the FI index and its cross-country analysis dissects the individual effects of the roles of life and non-life insurance inclusive financial inclusion in each country, whereas replacing the proxies for insurance affirms the validity of the FI index.
The FI Index Using Banking-Life-and-Non-Life Insurance Indicators

Conclusion
The classification method presents an innovative method that distinguishes this study from the previous studies. While the supplementary benefits of insurance in addition to banking services are evident, especially aftermath of the global pandemic, the existing measurement of financial inclusion mostly focuses only on traditional banking financial services, and insurance remains largely ignored. In this regard, we include banking, life, and non-life insurance indicators and make the comparison between these 4 sets of FI indices. In particular, we proposed 4 multidimensional measures of Financial Inclusion Indices (FI indices)—multidimensional measures that can be used to compare the extent of financial inclusion across different economies and monitor the economic progress with respect to financial inclusion over time. They are FI Index (Banking), FI Index (Banking and life insurance), FI Index (Banking and non-life insurance), and FI Index (Banking, life, and non-life insurance), where the indicators are included in each dimension—availability, accessibility, and usage separately. Researchers can use such indices to address empirical questions on the relationship between insurance-related financial inclusion and developmental goals. The findings also show a new policy lens for countries to implement measures to increase insurance uptake and penetration.
The contribution of this paper is not merely on adopting a new classification method (widely used in financial development but not financial inclusion), but it also further evaluates and analyses the reasons behind the differences in these FI indices. We have drawn several interesting observations from this study. We conclude that insurance significantly contributes to financial inclusion. When life insurance indicators are incorporated into the financial inclusion index, the number of countries in the moderate financial inclusion group nearly doubled. However, most countries do not benefit significantly from life insurance. This is primarily due to low insurance market growth in developed economies and the dominance of banking sectors over the insurance sector in the financial system in developing countries.
Compared to life insurance, non-life insurance brings greater benefits to most countries, as more than half of the countries see an increment in their FI indices. Additionally, the number of members among the high financial inclusion and moderate financial inclusion groups increased significantly. Furthermore, the FI index using banking, life, and non-life insurance indicators
This study has provided critical insights into how insurance can enhance financial inclusivity. However, it is not absent from limitations. In terms of methodology, our study only conducted correlation analysis to ensure the data are free from multicollinearity problems. Hence, for future studies that employ regression models to validate the role of life and non-life insurance in financial inclusion, measures need to be taken to ensure that the model is free from endogeneity issues. Moreover, our sample period only covers five years before COVID-19, hence, it might not be able to fully capture the latest current trend. Future studies could consider lengthening the sample period once the world economy is normalized. In terms of methodology, we employed a commonly used statistical technique, PCA, to compute our FI index. Other advanced methods like text analysis or machine learning should be considered for future index computation to complement our analysis and capture inputs that may be missed by the PCA method. Furthermore, as the global community advances toward achieving sustainable development goals, upcoming research could investigate how financial inclusion, integrating the role of insurance, influences the progress of these goals. This is because, in pursuit of these interconnected objectives, gaining access to financial resources, including insurance, marks only the initial phase (Yap et al., 2023).
The main conclusions from this study reveal several important policy implications. Given that insurance is a financial service insufficiently emphasized in many countries, incorporating the role of insurance in the National Financial Inclusion Strategy (NFIS) presents an opportunity to address the inclusiveness of the financial sector by avoiding excessively high reliance on the banking industry, which could be volatile during times of turbulence. To date, only 17 out of 36 members of the Alliance for Financial Inclusion have taken insurance as the main pillar in their National Financial Inclusion Strategies (Alliance for Financial Inclusion, 2018). Moreover, insurance industry players could embrace Insurtech which refers to digital transformation to gain a competitive edge while delivering more customized solutions to their consumers to fulfill their diverged demands (Lim et al., 2021). Yakubi et al. (2022) show that the acceleration in digitalization prompted by COVID-19 enables insurers to provide more inexpensive policies to the underserved through digital channels. Lastly, it is important for the government to push for legislative changes that encourage innovation and the use of distribution systems that lower transaction costs for insurance products. Partnerships between the public and private sectors will be critical in creating a digitally friendly environment to better integrate insurance into the existing financial systems.
Footnotes
Authors’ Contributions
SY initiated the research and was a major contributor in writing the manuscript. HSL performed the data collection and data analysis. LPX conducted data analysis and data interpretation.
Declaration of Conflicting Interests
The author(s) declared no potential conflicts of interest with respect to the research, authorship, and/or publication of this article.
Funding
The author(s) disclosed receipt of the following financial support for the research, authorship, and/or publication of this article: The research was supported by the Ministry of Higher Education (MoHE), through the Fundamental Research Grant Scheme (FRGS/1/2021/SS01/UTAR/02/4) and Universiti Tunku Abdul Rahman, through the UTAR Research Fund (IPSR/RMC/UTARRF/2021-C1/L0).
Ethical Approval
Not applicable.
Consent for Publication
Not applicable.
Data Availability Statement
The datasets used and/or analyzed during the current study are available from the corresponding author on reasonable request.