
Abstract
Vietnam has emerged as a highly promising destination for foreign direct investment (FDI) projects, experiencing a commendable and consistent influx of FDI in recent years. However, this surge is not uniformly distributed across provinces. This study applies the data envelopment analysis (DEA) and Malmquist index measurement to evaluate FDI attractiveness of provinces in Vietnam from 2012 to 2020. Based on DEA, the analysis takes the provinces’ five indicators (Labor Force, Gross Regional Domestic Product, Provincial Competitiveness Index, FDI by capital, and FDI by cases) into account in order to identify provinces ripe for targeted improvement as well as those that can serve as exemplars for others. Next, Malmquist indexes are derived from DEA assessment to observe the evolution of each province during 2012 to 2020, and then decomposed to uncover the cause of performance change. We find that only four provinces are able to achieve perfect efficiency in attracting FDI, including three provinces from South East region: Vung Tau, Binh Duong, Ho Chi Minh, and Ha Tinh. Nevertheless, nearly 80% of the provinces improve their performance. The methodology and findings in this paper can provide significant insights for policymakers to devise mechanisms to attract FDI in their locality.
Plain language summary
This study contributes to the existing literature by analyzing the intertemporal efficiency change of the provinces in attracting FDI throughout the research period of 2012-2020, taking into account the significant differences in FDI attractiveness among destinations Vietnam confronts. To the best of our knowledge, Vietnam has not yet looked into utilizing the DEA and Malmquist index to examine the provinces’ FDI attractiveness. Another significant benefit of this research is the discovery of the reason of efficiency change by deconstructing the Malmquist index based on the DEA efficiency evaluation. Findings from the analysis can provide managerial insight and signifi-cant guidelines for local policymakers and the government to improve FDI attractiveness.
Keywords
Introduction
The allure of foreign direct investment (FDI) holds paramount significance in driving economic growth, injecting capital, technology infusion, and fostering managerial expertise, all of which contribute significantly to bolstering productivity, particularly in developing nations. FDI serves as a catalyst for enhancing macroeconomic management, underpinning growth potential, nurturing a skilled labor force, leveraging natural resources, fortifying both basic and cutting-edge infrastructure, and establishing robust export channels (Lei et al., 2013). Thus, improving the efficiency of FDI attraction to promote instantaneous, effective, and sustainable socio-economic development has gained popularity among policymakers and academics. Over the past decades, abundant research has been devoted to FDI attractiveness assessments, in which crucial determinants that influence the capability of the host country to attract FDI have been discussed.
Traditionally, researchers have delved into an array of economic determinants influencing FDI attraction, encompassing GDP growth, human capital, infrastructure, exchange rates, and trade openness (Alfaro et al., 2004; Cheng et al., 2000; Saini & Singhania, 2018; Salike, 2016; Tomlin, 2008). Deng et al. (1997) underscore the significance of international payment balance in conjunction with a country’s economic development and human capital for FDI enticement. Further studies zero in on pivotal aspects such as technology and equipment transfer, job creation, amplified exports, and infusion of international management expertise (Barbosa & Eiriz, 2009; Barrios et al., 2005; Brouwer et al., 2008; Saglam & Sayek, 2011; Suyanto et al., 2009). Basile et al. (2008) highlight the pivotal roles of training and R&D in luring foreign subsidiaries to 50 European regions. The instrumental impact of the host economy’s institutional framework on FDI attraction enjoys wide affirmation within the literature (Bailey, 2018; Globerman & Shapiro, 2002; Long et al., 2015). The connection between institutional characteristics and host nation FDI attractiveness was investigated in a study by Bailey (2018). The study provided empirical support for previous theoretical assertions, affirming that institutional attributes like political stability, democratic governance, and a robust rule of law are conducive to FDI attraction, whereas factors like corruption, tax rates, and cultural disparities act as deterrents. Additional data revealed that moderating variables that could affect earlier important findings should be explored. Environmental factors, such as the degree of development, the destination location, and the competitiveness of the industry environment, have various effects on the relationship’s strength and importance. Long et al. (2015) explored the topic of attracting investment (FDI) in China. While traditional research on FDI focuses on how it boosts a country’s development through increased resources and the introduction of advanced technology and management expertise, these factors may not paint a complete picture in China’s unique context. Therefore, they proposed a perspective on how FDI impacts the economy. Specifically, they argued that the inflow of FDI plays a role in improving the quality of essential institutions for regional economic growth. It was investigated how the presence of FDI affected two different local institutions for Chinese domestic firms: the level of legal protection they receive, as well as the costs and responsibilities associated with paying taxes and fees. Mihaylova (2020) focused on key policy-related aspects such as the institutional framework, quality of the labor force, cost competitiveness, and infrastructure availability when ranking the FDI attractiveness of central, eastern, and southeastern European countries. Cui et al. (2020) delved into provincial-level competitiveness indexes as regional advantages for both attracting and retaining foreign direct investment in China. According to Yao et al. (2021), enhancing local financial intermediation proves more effective than relying on concessional arrangements to attract FDI. In a study investigating FDI attractiveness in ASEAN-7 countries (V. C. Dang & Nguyen, 2021), Dang and Nguyen highlighted that factors like economic growth, the quality of economic institutions, tax burden, and inflation exert significant positive influences on FDI inflow. Conversely, population growth and the quality of political institutions demonstrated an inverse relationship with FDI attraction.
Attracting foreign direct investment (FDI) stands out as one of Vietnam’s most remarkable achievements since the implementation of Doi Moi. FDI has significantly enhanced the competitiveness of the Vietnamese economy, generating numerous employment opportunities and bolstering state budget revenues. Vietnam is recognized as a globally appealing destination for FDI inflows. In 1991, the registered FDI capital in Vietnam amounted to 2.07 billion USD, with realized FDI capital reaching 428.5 million USD, surpassing 20% of the registered capital (The Role of FDI Capital Flows in Vietnam’s Economic Development, n.d.). Subsequently, FDI inflows into Vietnam experienced a gradual increase. Notably, Vietnam’s accession to the World Trade Organization in 2007 led to a sharp surge in registered FDI capital, soaring from 21.35 billion USD in 2007 to an astonishing 71.73 billion USD in 2008 alone. Since 2010, Vietnam’s efforts to attract FDI have been successful, with a stable, upward trend of FDI inflows. However, FDI inflows into Vietnam are unevenly distributed among provinces, especially in the period 2012 to 2020 (Institute of Development Strategy, Ministry of Planning and Investment; Improving the efficiency of attracting FDI into Vietnam, n.d.). The stark reality is that regions, particularly those proximate to major economic centers like Hanoi, Ho Chi Minh, and Da Nang, which draw substantial FDI, experience elevated levels of socio-economic development. This phenomenon, however, gives rise to a pronounced imbalance in development across regions (Attracting FDI in Vietnam’s Sustainable Development Strategy: New Orientation, Synchronous Solutions, n.d.). To propel less developed economic areas towards high growth rates, a concerted effort to attract substantial investment capital into pivotal projects becomes imperative. Despite offering favorable policies, enticing FDI into regions with challenging traffic conditions and modest living standards proves to be a formidable task. The disparate allocation of FDI across industries, sectors, and territories carries adverse repercussions for the sustainable development of the national economy. This includes fostering a reliance on external technology and markets, thereby exerting pressure on domestic enterprises (FDI with Uneven Development Among Localities, n.d.). The challenge of addressing uneven development between regions is formidable. It is not merely about achieving parity, but rather about averting excessive disparities, let alone widening the chasm in development levels. The focus should be on judiciously narrowing down these discrepancies by fostering conditions for heightened economic growth in less developed regions, surpassing the average national rate. This progressive approach, which not only shores up local revenue for essential expenditures but also bolsters contributions to the central budget, is imperative. Given these imperatives, comprehending the underlying causes of such disparities is crucial. The measurement of provincial efficiency in FDI attraction serves as a fundamental and initial stride, providing policymakers with a solid groundwork for subsequent measures to uniformly enhance their FDI attractiveness.
The Provincial Competitiveness Index (PCI) has become a crucial reference for both domestic and foreign investors when making investment decisions in Vietnam. It also serves as a vital resource for policymakers striving to improve the investment climate. M. C. Nguyen and Ho (2016) have identified various components of the PCI, including labor training, business support, transparency, legal institutions, administrative procedures, and land accessibility, among others. These elements contribute to increased profitability for investors, ensuring the sustained attractiveness of FDI. Additionally, labor stands out as another pivotal factor in FDI location selection, with countries or regions offering lower wages being more likely to attract FDI. In many developing countries, the absence of robust trade unions leads to limited bargaining power for workers (Leahy & Montagna, 2000). Nations that implement effective policies for human resource training and ensure the well-being of their workforce gain a competitive edge, making them more appealing for FDI inflows. This, coupled with a skilled workforce aligned with the requirements of foreign investors, further enhances their appeal. Recent research conducted by C. H. Nguyen (2021) in Vietnam highlights a positive correlation between FDI, labor force, GDP, inflation, business freedom index, and investment freedom index. Vietnam is endowed with a rich pool of youthful human capital, and a recent shift towards skilled labor, facilitated by a change in the growth model and improved human resource training, has significantly bolstered FDI attraction in the country. Consequently, the availability of labor resources significantly impacts a country’s FDI attractiveness, a trend underscored in numerous empirical studies focused on FDI in Vietnam (Ngo et al., 2020; C. H. Nguyen, 2021; Tran & Hoang, 2019).
This paper aims to combine FDI attractiveness with the locational factors of Vietnam’s different provinces. As discussed in the above-mentioned studies, various indexes and rankings have been widely proposed for the FDI attractiveness evaluation in the existing literature. After reviewing the literature and consulting with economic experts in Vietnam, we selected suitable indicators in Vietnam context for this analysis. Then, we apply data envelopment analysis (DEA) and Malmquist index measurement to a selection of 42 out of Vietnam’s 63 provinces from 2012 to 2020. The provinces are categorized into the country’s seven key economic regions. The selection of aggregate data was guided by the reliable availability of yearly reports, encompassing five key dimensions of the provinces: Labor Force (LF), Gross Regional Domestic Product (GDP), Provincial Competitiveness Index (PCI), Cumulative FDI by capital, and Cumulative FDI by cases. While FDI by capital provides insights into the financial magnitude and economic impact of FDI, FDI by cases offers insights into the diversity and number of investment initiatives. Additionally, the dataset covers 42 provinces, with twenty-one omitted provinces predominantly situated in highland areas. These regions tend to have economic indicators that are not primarily geared toward foreign investor focus.
This study contributes to the existing literature by analyzing the intertemporal efficiency change of the provinces in attracting FDI throughout the research period of 2012 to 2020, taking into account the significant differences in FDI attractiveness among destinations Vietnam confronts. To the best of our knowledge, Vietnam has not yet looked into utilizing the DEA and Malmquist index to examine the provinces’ FDI attractiveness. Another significant benefit of this research is the discovery of the reason of efficiency change by deconstructing the Malmquist index based on the DEA efficiency evaluation. Findings from the analysis can provide managerial insight and significant guidelines for local policymakers and the government to improve FDI attractiveness.
Through DEA analysis, we find that only 4 out of the 42 provinces excel in efficiently translating their input resources into optimal outcomes. Notably, three of these high-performing provinces hail from the South East Region: Vung Tau, Binh Duong, and Ho Chi Minh. However, based on Malmquist index analysis, on average, nearly 80% of provinces (32 out of 42) are able to improve their efficiency in that period.
The subsequent sections are structured as follows: Section “Literature Review” delves into the literature review. Section “Methodology” offers an exposition of the concepts surrounding data envelopment analysis (DEA) and the Malmquist index. Moving forward, Section “Empirical Study” encapsulates the empirical study, while Section “Results Analysis” encompasses the analysis of results. Finally, Section “Conclusion” provides concluding remarks.
Literature Review
Measuring Efficiency of Attracting FDI: Province-Level Investigations in Vietnam
Foreign direct investment (FDI) is referred to as an investment involving a long-term relationship and reflecting a long-term interest and control by a resident entity in one economy (foreign direct investor or parent enterprise) in an enterprise residing in another economy (FDI enterprise or affiliated enterprise or foreign affiliate; Hanh et al., 2017). According to studies, FDI has a specific role in emerging economies by helping to address concerns with employment (Alfaro, 2003), the shortage of investment capital, economic restructuring, the provision of cutting-edge technology, or the transfer of management expertise to local firms (J.-Y. Wang & Blomström, 1992). Factors influencing FDI attraction have been tested through numerous studies and theories. According to Mayer (2005), the rationale for multinationals’ long-term investment is that they aim to take use of local resources in rising nations, such as cheap and abundant labor or valuable natural resources. Lipsey (2001) underlined that although the host country views FDI as a source of capital to boost economic development and access to contemporary technologies, foreign corporations desire to increase long-term investment in developing countries to find resources. According to a study by Prokopenko (2000) on the connection between policies and FDI, local government policies to increase globalization and national competitiveness have an impact on FDI inflows.
A wide array of studies delve into the impact and allure of Foreign Direct Investment (FDI), where FDI attractiveness is synonymous with the host economy’s performance and efficiency in attracting such investment. Within the Vietnamese context, a wealth of research provides a comprehensive analysis of various determinants influencing FDI attraction at the sub-national level. For instance, Meyer and Nguyen (2005) delved into the geographical characteristics of regions in attracting FDI, employing a binomial regression model to underscore the pivotal role of factors such as population, infrastructure, industrial zones, education, FDI stock, and economic growth in driving FDI to provinces in Vietnam. Similarly, Anwar and Nguyen (2010) employed a simultaneous equations model to scrutinize the relationship between FDI inflows and economic growth across 61 Vietnamese provinces during the period spanning 1996 to 2005. Using panel data and the Ordinary Least Square (OLS) method, Chien and Zhang (2012) studied the bidirectional relationship between FDI and GDP, competition and the effects of laws in attracting FDI among provinces in the North Central Area and South-Central Coast of Vietnam in the period from 2000 to 2010. D. A. Dang (2013) examined the effects of increased FDI on economic institutions for 60 provinces in Vietnam, finding that higher FDI inflow is linked to better institutional outcomes, including the provincial competitiveness index, business environment regulation, property rights, and accountability. Hoang and Goujon (2014) applied spatial econometric models to discern the factors influencing FDI distribution in Vietnamese provinces post the 1997 Asian crisis, utilizing cross-sectional data spanning from 2001 to 2010. According to the study, FDI attraction is influenced by the market’s size, infrastructure, provincial industrial development policies, and labor productivity in the host and neighboring provinces.
van Bon (2015) studied the Provincial Competitiveness Index (PCI), which is related to regional governance quality in Vietnam on attracting FDI inflows for a sample of 43 provinces of Vietnam over the period of 2005 to 2012 via the estimation technique of difference panel Generalized Method of Moments (GMM). Esiyok and Ugur (2017) studied the FDI attraction in 62 Vietnamese provinces using a spatial regression approach, considering these factors: province-specific per capita income, secondary education enrolment, labor costs, openness to trade, and domestic investment. A. T. N. Nguyen (2016) scrutinized FDI determinants across 63 provinces and cities in Vietnam during the period of 2008 to 2012, employing both fixed effect and random effect methodologies. Empirical findings underscore the significant impact of market potential, labor costs, labor quality, infrastructure, provincial policy effectiveness, and the preceding year’s FDI concentration on FDI allocation throughout provinces and cities in Vietnam. Additionally, it was established that market potential and wage rates hold statistical influence over the size of FDI projects. Ngo et al. (2018) and Vi Dũng et al. (2018) identified the FDI attractiveness of Vietnam at the subnational level with traditional factors (market size, human resources, and infrastructures) as well as emerging factors (institutions and policies, domestic and foreign agglomeration) suggested by economics and international business theories using a longitudinal dataset of 63 provinces/cities from 2008 to 2013. Tran and Hoang (2019) examined the FDI attractiveness of 47 Vietnamese provinces and cities under central authority over the period 2012 to 2015, particularly with the view to considering the differences among provinces. The factors include domestic investment capital, human resources, and the rate of trained workers.
Minh (2019) delved into the impact of institutional quality on FDI inflows in Vietnam, utilizing a panel dataset sourced from a Provincial Competitiveness Index (PCI) survey and inward FDI data across 59 provinces and cities of Vietnam during the period of 2010 to 2017. The study employed GMM estimation with period-specific predetermined instruments to investigate the correlation between the quality of provincial governance and FDI inflows. Ngo et al. (2020) investigated the determinants of FDI attraction, including labor force, macroeconomic policy, macroeconomic stability, skilled labor, and the trade openness in 43 out of 63 provinces or cities from 2000 to 2019 using GMM and Pooled Mean Group (PMG). Hoang et al. (2022) utilized a spatial econometric approach to analyze the determinants influencing foreign direct investment in Vietnam’s Southern Central Coast (SCC) area from 2007 to 2016. The estimation outcomes reveal that FDI inflows in the SCC area are driven by the host province’s competitive advantage in low labor costs, and provinces equipped with national seaports wield a significant edge in attracting FDI, underscoring the vertical FDI structure of the SCC region. Unexpectedly, the presence of skilled labor from neighboring provinces exerts a positive effect on FDI inflows to the host province. Addressing the pivotal role of local institutional quality in FDI attraction, the estimation underscores the substantial impact of the host province’s legal institutions and the level of social security. Hoa et al. (2021) analyzed FDI attractiveness in the Northwest region of Vietnam in the context of global economic integration during 2000 to 2019 under these factors: promoting economic restructuring, expanding markets, promoting exports, developing human resources, and providing new technologies for development.
DEA and Malmquist Index Measurement
DEA, a nonparametric assessment grounded in production theory, employs mathematical techniques for benchmarking similar elements based on predetermined inputs and outputs (Charnes et al., 1978). In a typical DEA model, the comparison is conducted based on decision-making efficiency, where a Decision-Making Unit (DMU) is the element under evaluation. These DMUs can encompass entities such as schools, manufacturing companies, hospitals, countries, states, and cities, among others. DEA’s objective is to ascertain how effectively selected DMUs yield specified outputs by evaluating chosen inputs. This methodology furnishes the capacity to model productivity and offer assessments across various organizational contexts. DEA leverages linear programming-based optimization to gauge efficiency, whether from an output maximization or input minimization standpoint (C. N. Wang, Dang, et al., 2022). A significant advantage of DEA is its independence from subjective weighting when assessing comparable units. The efficiency of a DMU can be distilled into an overall performance score, signifying how effectively inputs are utilized to generate the designated outputs within the defined scope. Meanwhile, the Malmquist index measurement, initially introduced by Malmquist in 1953 (Malmquist, 1953), presents a robust method for comparing relative productivity over different locations or time periods. Both DEA and Malmquist measurements have found applications in appraising the performance of diverse entities across various domains, including assessments of industrial cities’ performance (Amado et al., 2019; D. D. Wang, 2019), evaluations of infrastructure and system efficiency (Pacagnella Junior et al., 2020; Singh et al., 2021), analyses of energy efficiency (Zheng, 2021), and assessments of environmental performance within industrial sectors (D. Wang et al., 2014), to name a few.
In the realm of assessing FDI efficiency, both DEA and Malmquist methods have proven highly effective in determining the efficiency score of a host economy in attracting FDI. These methodologies have been successfully employed in numerous subsequent studies. For instance, Lei et al. (2013) utilized DEA to analyze the FDI attractiveness for sustainable development across 30 provinces in China. Mastromarco and Simar (2015) introduced time-dependent conditional DEA estimators to examine the impact of FDI and time on catching up in 44 countries spanning from 1970 to 2007. Q. Wang, Du, et al. (2022) presented a dynamic Direction Distance Function-Data Envelopment Analysis (DDF-DEA) model to scrutinize the efficiency of attracting FDI, incorporating environmental regulation, in 31 Chinese provinces over the period spanning from 2015 to 2017. Dai (2016) conducted a study on FDI efficiency in major cities in Korea and China, employing the Group Method of Data Handling (GMDH) and DEA methods. Zhang et al. (2019) employed the DEA scale return model to assess the efficiency of environmental protection spending in China and explore the interconnections between FDI, fiscal decentralization, and government expenditure efficiency. Teplova and Sokolova (2019) applied the DEA method along with the Malmquist Index measurement to gauge the efficiency of FDI transformation within a sample of 31 developed and developing countries. Pan et al. (2020) delved into the impact of FDI quality on energy efficiency using the Slacks-Based Measure Data Envelopment Analysis (SBM-DEA) method.
Research Gap
After a comprehensive review of relevant literature, the position of this study is the first attempt to apply DEA and Malmquist methods for assessing FDI attractiveness in Vietnam. This area remains significantly unexplored in existing academic discourse. Furthermore, while there are a few DEA-based studies on FDI impact and attractiveness (Dai, 2016; Lei et al., 2013; Mastromarco & Simar, 2015; Pan et al., 2020; Teplova & Sokolova, 2019; Q. Wang, Du, et al., 2022; Zhang et al., 2019), mainly focusing on a single annual period, and none have evaluated the intertemporal change of efficiency in attracting FDI. Our research addresses this gap by conducting a dynamic performance assessment through the combined application of DEA and Malmquist index analysis. The utilization of DEA in FDI attractiveness evaluation enables the simultaneous consideration of multiple inputs and outputs. The DEA recognizes provinces that should be targeted for further improvement or served as role models for other provinces. Then, the Malmquist index is derived based on the DEA efficiency assessment to uncover the pattern of FDI attractiveness change over time. For pinning down the cause of efficiency change, the Malmquist index of each province is decomposed into two components that reflect its change driven by certain common trends. Thus, the proposed approach aims to bridge the gap in the existing literature on FDI attractiveness assessment in Vietnam context, which can constitute the novelty of this research.
Methodology
Pearson Correlation
Pearson’s correlation coefficient is critical in DEA for determining the isotonic connection between input and output variables, where +1 presents a total positive linear, 0 presents no linear, and −1 presents a total negative linear. Two variables are connected if Pearson’s index is high. If it is low, the input and output relations are unappropriated.
Isotropic is an essential DEA data assumption. The relationship between inputs and outputs will be verified before using the DEA model, which means that it should be in a total positive linear relationship. Pearson’s formula (r) of two factors (x) and (y) is calculated as follows (C.-N. Wang, Nguyen et al., 2022).

where n represents sample size;
DEA Super Efficiency Slacks-Based Measure Model
Data envelopment analysis (DEA) was initially proposed in 1978 as a nonparametric tool for assisting decision-making in the assessment of production boundaries, which are referred to as decision-making units (DMUs). The first model to quantify total inefficiency was CCR (Charnes, Cooper, and Rhodes). The variable returns-to-scale BBC (Banker, Charnes, and Cooper) model is then used to assist reduce the limits of the CCR model’s constant returns to scale and distinguish between technical and scale efficiency (C.-N. Wang et al., 2021).
The slacks-based measure of efficiency in DEA (SBM model) was established by Tone (2001), which efficiently distinguishes between efficient and inefficient DMUs. However, this approach is unable to distinguish between high-performing DMUs (i.e., fully efficient with a score of “1”). Tone (2002) proposed a super-efficiency slacks-based measure model in DEA (Super-SBM model) to distinguish between completely efficient DMUs by omitting fully efficient DMUs from the SBM model’s efficient frontier. The model computes the non-radial distance between omitted efficient DMUs and the efficient frontier generated by the remaining efficient DMUs while addressing input and output slacks. The Tone (2002) model was more suited for dealing with real-world applications because of this feature.
The model is used to analyze n DMUs with the input and output matrices X = (
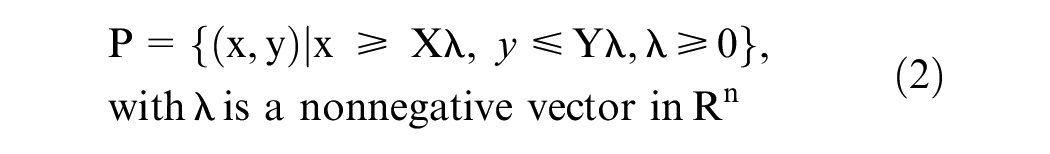
Tone (2001) considers the following expression to describe a specific DMU (


With


A DMU (
Observational research on efficiency evaluation analysis indicated that multiple decision units had a 100% “effective status.” Thus, distinguishing logically between these effective DMUs is critical for measuring performance and assessing affecting variables. To compensate for the SBM model’s shortcomings, the super-SBM model should be employed. The super-SBM model can be expressed as follows:


DEA Malmquist Model
It is required to calculate technical efficiency throughout time in addition to calculating technical efficiency at a certain period. Fare (Färe et al., 1994) developed the Malmquist model, which includes the Malmquist Productivity Index (MPI), a DEA model extension for calculating the total factor productivity change of a DMU over time. The MPI may be used to compare the overall factor productivity of a DMU over time. The ability to compare efficiency trends over time allows academics to have a better grasp of how efficiency evolves over periods. The total factor productivity achieved by DEA is referred to as MPI, according to Fare (Färe et al., 1994). This index is acknowledged as one of the most helpful tools for analyzing the productivity change of a set of DMUs over time. Each DMU is studied at two separate times

The Malmquist index calculated the efficiency score to assess changes in total factor productivity of each DMU. MPI is the result of the concepts “catch-up” and “frontier-shift.” The term “catch-up” (efficiency change) is defined as the ratio of the DMU’s efficiency in period
MPI can be obtained as follows: MPI = catch-up (CA) × frontier-shift (FS), which can then be further transformed into:
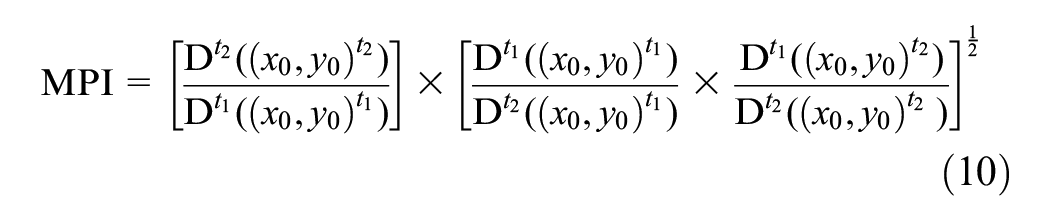


Suppose the values of CA, FS, and MPI are >1, =1, or <1, the DMUi’s technical efficiency change, technological change, and total factor productivity have progressed (efficiency gain), remained the same (a status quo in efficiency), or regressed (efficiency loss) from the period
Empirical Study
DMU Selection
From 2012 to 2020, we conducted an analysis of FDI attractiveness in 42 provinces out of the total 63 in Vietnam. The 21 provinces that were not included in the study are predominantly situated in the highland areas, where economic indicators are not primarily directed towards foreign investors. The provinces under investigation are categorized into the country’s seven key economic regions, as illustrated in Figure 1 and detailed in Table 1.

42 provinces used in this paper.
The classification of DMU by key economic region in Vietnam.

Inputs and Outputs Selection
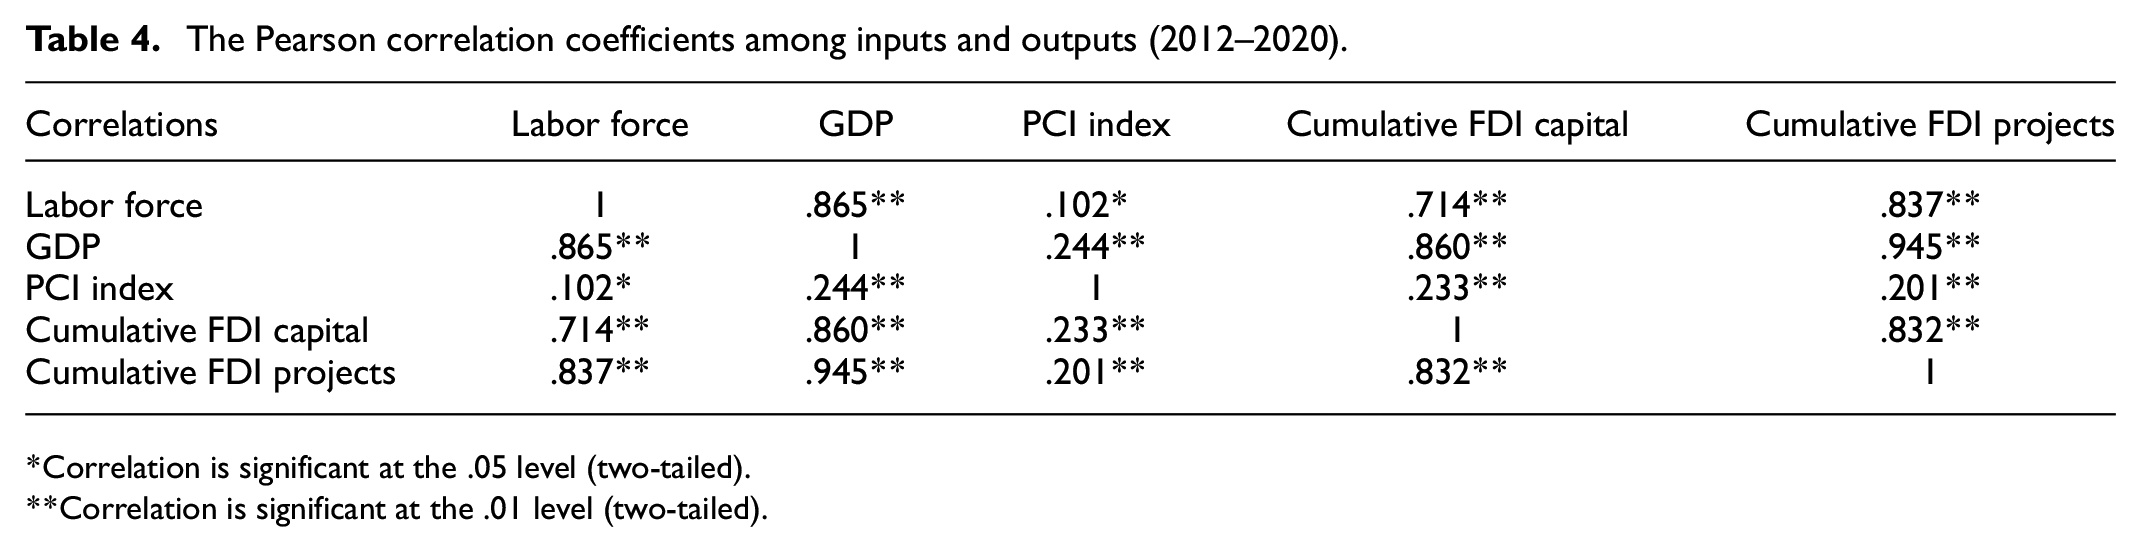
The selection of aggregate input and output data is based on the consistent availability of annual reports. Table 2 provides the definitions and sources of the gathered indicators: Labor Force (LF), Gross Regional Domestic Product (GDP), and Provincial Competitiveness Index (PCI) are considered as inputs, while FDI by capital (cumulative FDI) and FDI by cases (cumulative cases) are regarded as outputs. Table 3 shows the statistical descriptions for the data set of inputs and outputs. Table 4 shows the correlation coefficients among inputs and outputs during 2012 to 2020. It shows the correlation coefficients between three input variables and two output variables are all more than 0.102 (i.e., significant at the .01 and .05 levels) during the considered periods, indicating inputs and outputs have a significantly positive relationship.
Inputs and outputs definition.

Summary of statistics of inputs/outputs.

The Pearson correlation coefficients among inputs and outputs (2012–2020).
Correlation is significant at the .05 level (two-tailed).
Correlation is significant at the .01 level (two-tailed).
Results Analysis
Efficiency Analysis Using Super-SBM Model
Based on the model’s illustration in Section “DEA Super Efficiency Slacks-Based Measure Model,” we first compute the efficiencies of the 42 provinces in attracting FDI year by year for 2012 to 2020. Figure 2(a–g) plots the FDI attractiveness’ evolution paths for all provinces according to their economic regions. Table 5 reports the detailed efficiency scores. In terms of the overall average performance as in Table 5, just about 10% of the total provinces (four out of 42) are able to achieve efficiency with scores larger than 1, including Vung Tau (1.771), Binh Duong (1.562), Ho Chi Minh (1.360), and Ha Tinh (1.247). In the four most efficient provinces, we note that the top three belong to the South East region, while Ha Tinh belongs to North Central Coast. We also note that the four provinces performed efficiently every single year in 2012 to 2020, with scores larger than 1, except for Ha Tinh in 2018 (0.556). South East region is an economic area with great potential for development in all fields and has always been the leading area in attracting FDI in Vietnam (Bôn, 2020; H. T. Nguyen, 2018). According to economic experts, foreign subsidiaries go to the region as an investment destination because it has a young and abundant labor force with lower wages than neighboring regions and countries. The consumer market is attractive to investors because of its large population (Attracting FDI in the Southern Key Economic Region, n.d.). In Vung Tau, efforts to improve the business investment environment and adjust inappropriate regulations have attracted FDI above the plan over the years (Vung Tau: Great Attraction for FDI Investors, n.d.). The province also implemented many measures to select large-scale, high-tech, high-added value projects and prioritize attracting investment in environmentally friendly and less labor-intensive projects (Attracting FDI in the Southern Key Economic Region, n.d.). Ho Chi Minh is Vietnam’s largest city and most important economic and financial hub. The city is always on the list of localities attracting the most FDI in the country, which results from focusing on reviewing, reducing, and simplifying business conditions and administrative regulations (FDI Capital in the Southern Key Economic Region, n.d.), as well as increasing the application of information technology and digital technology to standardize and simplify business processes. Binh Duong focuses on investing in upgrading and developing transport, urban infrastructures, and becoming a smart city. The authority has improved provincial competitiveness and applied science and technology to simplify administrative procedures (Attracting FDI in the Southern Key Economic Region, n.d.). Ha Tinh has a central location in the North Central Coast region with complete transport infrastructure. With the synchronous promulgation and implementation of policies and effective solutions, Ha Tinh has become one of the leading localities in attracting FDI, with many largest-scale projects in the country, such as FORMOSA Group investing in a petrochemical refinery project, Mitsubishi Corporation (Japan) invests in Vung Ang II Thermal Power Plant project, Samsung Group (Korea) invests Vung Ang III Thermal Power Plant project, etc (Ha Tinh - Strength from FDI, n.d.).
Super-SBM score and ranking of 42 provinces (2012–2020).

From Figure 2(a–g), provinces with the best performance during 2012 to 2020 in their economic regions include Thai Nguyen (Northern Midlands and Mountains), Ha Noi (Red River Delta), Ha Tinh (North Central Coast), Da Nang (South Central Coast), Vung Tau (South East), and Long An (Mekong River Delta). The scores implies that the provinces are able to translate the input resources into outputs in the most efficient way. In contrast, provinces having performed worst during 2012 to 2020, compared with the above provinces in the same region, are Tuyen Quang, Thai Binh, Nghe An, Binh Dinh, Binh Phuoc, and An Giang, respectively.

Evolution of efficiencies for all provinces over 2012 to 2020. (a) Northern Midlands and Mountains. (b) Red River Delta. (c) North Central Coast. (d) South Central Coast. (e) Central Highlands. (f) South East. (g) Mekong River Delta.
The bottom three provinces in Table 5 are An Giang (0.016), Tuyen Quang (0.025), and Yen Bai (0.045), all of which have markedly lower efficiencies than other provinces. We observe that Tuyen Quang and Yen Bai are located in the Northern Midlands and Mountains region of Vietnam, known for its mountainous terrain and limited infrastructure. This region is still considered the country’s most economically disadvantaged area, facing substantial constraints and challenges, which diminish its attractiveness to foreign investors (Northern Mountainous Region should Turn Disadvantages into Development Advantages: Official, n.d.). The Northern Midlands and Mountains have many advantages and potential for economic development and investment attraction, thanks to being located on the North-South economic corridor, belonging to the Open Mekong Sub-region cooperation. It is one of the gateways to the sea and connects with ASEAN of China’s western and southern provinces (Promoting the Strengths of the Northern Midlands and Mountains in Attracting Investment, n.d.). However, receiving low efficiency scores indicates that these provinces are not effectively utilizing their resources to attract FDI. The underlying reasons for this inefficiency may be attributed to political and/or economic circumstances. It is imperative for the government to focus on this aspect and prioritize the development of investment policies to enhance FDI attractiveness.
Additionally, we observe from Figure 2 and Table 5 that the performance of most provinces remains relatively stable throughout the period of 2012 to 2020. This is to be expected as none of the five indicators can undergo drastic changes in a short span of time. However, there are a few noteworthy exceptions, namely Thai Nguyen, Ha Tinh, and Phu Yen, which exhibit significant shifts. From Figure 2(a), Thai Nguyen has achieved success in attracting FDI, experiencing a tremendous rise in FDI attractiveness efficiency from 2012 to 2014, and then remaining relatively stable good performances during 2014 to 2020. After prudently surveying many provinces and cities of Vietnam, in 2013, Samsung chose Thai Nguyen to implement the investment project of Samsung Complex, specializing in manufacturing mobile phones and other high-tech electronic products (Samsung Thai Nguyen Phone Factory Officially Opened, n.d.). Thanks to the spillover effect of the Samsung project, total FDI in Thai Nguyen during 2012 to 2020 rose 70 times compared to the 1993 to 2011 period (Vu et al., 2019). From Figure 2(c), although achieving good performances, Ha Tinh only reached the bottom at 0.556 in 2018. This performance was very likely to be hampered because Vung Ang II Thermal Power Plant project was behind schedule during 2017 to 2018 (Socio-Economic Situation of Ha Tinh Province in 2018, n.d.). Phu Yen shows the most unstable performance during 2012 to 2020, as in Figure 2(d). The province’s performance, with notable change in 2013 to 2014 and 2017 to 2018, may be tied to Vung Ro Refinery and Petrochemical Complex project. This project was one of the largest projects in Phu Yen with the expectation of contributing to changing the local economic structure. The project was started when the factory broke ground in 2014. However, construction of the site saw little progress and had stalled for a long time, until the project ended up being terminated in 2018 (Vietnam Revokes License for Vung Ro Oil Refinery project, n.d.).
The Malmquist Indices
We calculate the Malmquist indexes and derive the decomposition results using Equations 9 and 10. It is important to highlight that the computation of the Malmquist index necessitates data from two consecutive years, resulting in five indicators for each province. Figure 3 provides a visual representation of the MPI indexes across all provinces, while Table 6 provides the specific MPI values. Note that MPI = 1 indicates a status quo in efficiency, MPI > 1 represents efficiency gain, and MPI < 1 corresponds to efficiency loss. According to Table 6, Thai Nguyen (MPI = 2.291), Khanh Hoa (MPI = 1.380) and Phu Yen (MPI = 1.373) are the three provinces with the best efficiency improvement over the entire period 2012 to 2020. Thai Nguyen has a markedly higher average MPI than other provinces, mostly due to the only improvement made in 2012 to 2013. Figure 3 shows that for Thai Nguyen, the Malmquist index falls flat from 10.820 to 0.882 during 2013 to 2015 and then remains stable, with values gently swinging around unity during 2015 to 2020. This pattern can be expounded that after the Samsung Complex project, there has been no remarkable improvement in Thai Nguyen’s performance to attract more FDI. Similarly, in Phu Yen, after Vung Ro Refinery and Petrochemical Complex project during 2013 to 2014, which led to an efficiency improvement with MPI = 4.688, the province has experienced sluggish progress in recent years while also reaching its lowest MPI in 2017 to 2018 due to the project’s cancellation. Khanh Hoa significantly improved their performance during 2016 to 2017 with MPI = 3.782, which may be attributed to the push of resort real estate to attract investment thanks to tourism potential and development infrastructures, notably the earliest Condotel projects of Vietnam appeared in Khanh Hoa during this period (Nha Trang Real Estate Push Thanks to Tourism Potential and Developed Infrastructure, n.d.). Lam Dong (MPI = 0.939), Ha Tinh (MPI = 0.941) and Quang Ngai (MPI = 0.960) are the three provinces with the biggest efficiency loss.
Malmquist index of 42 provinces (2012–2020).

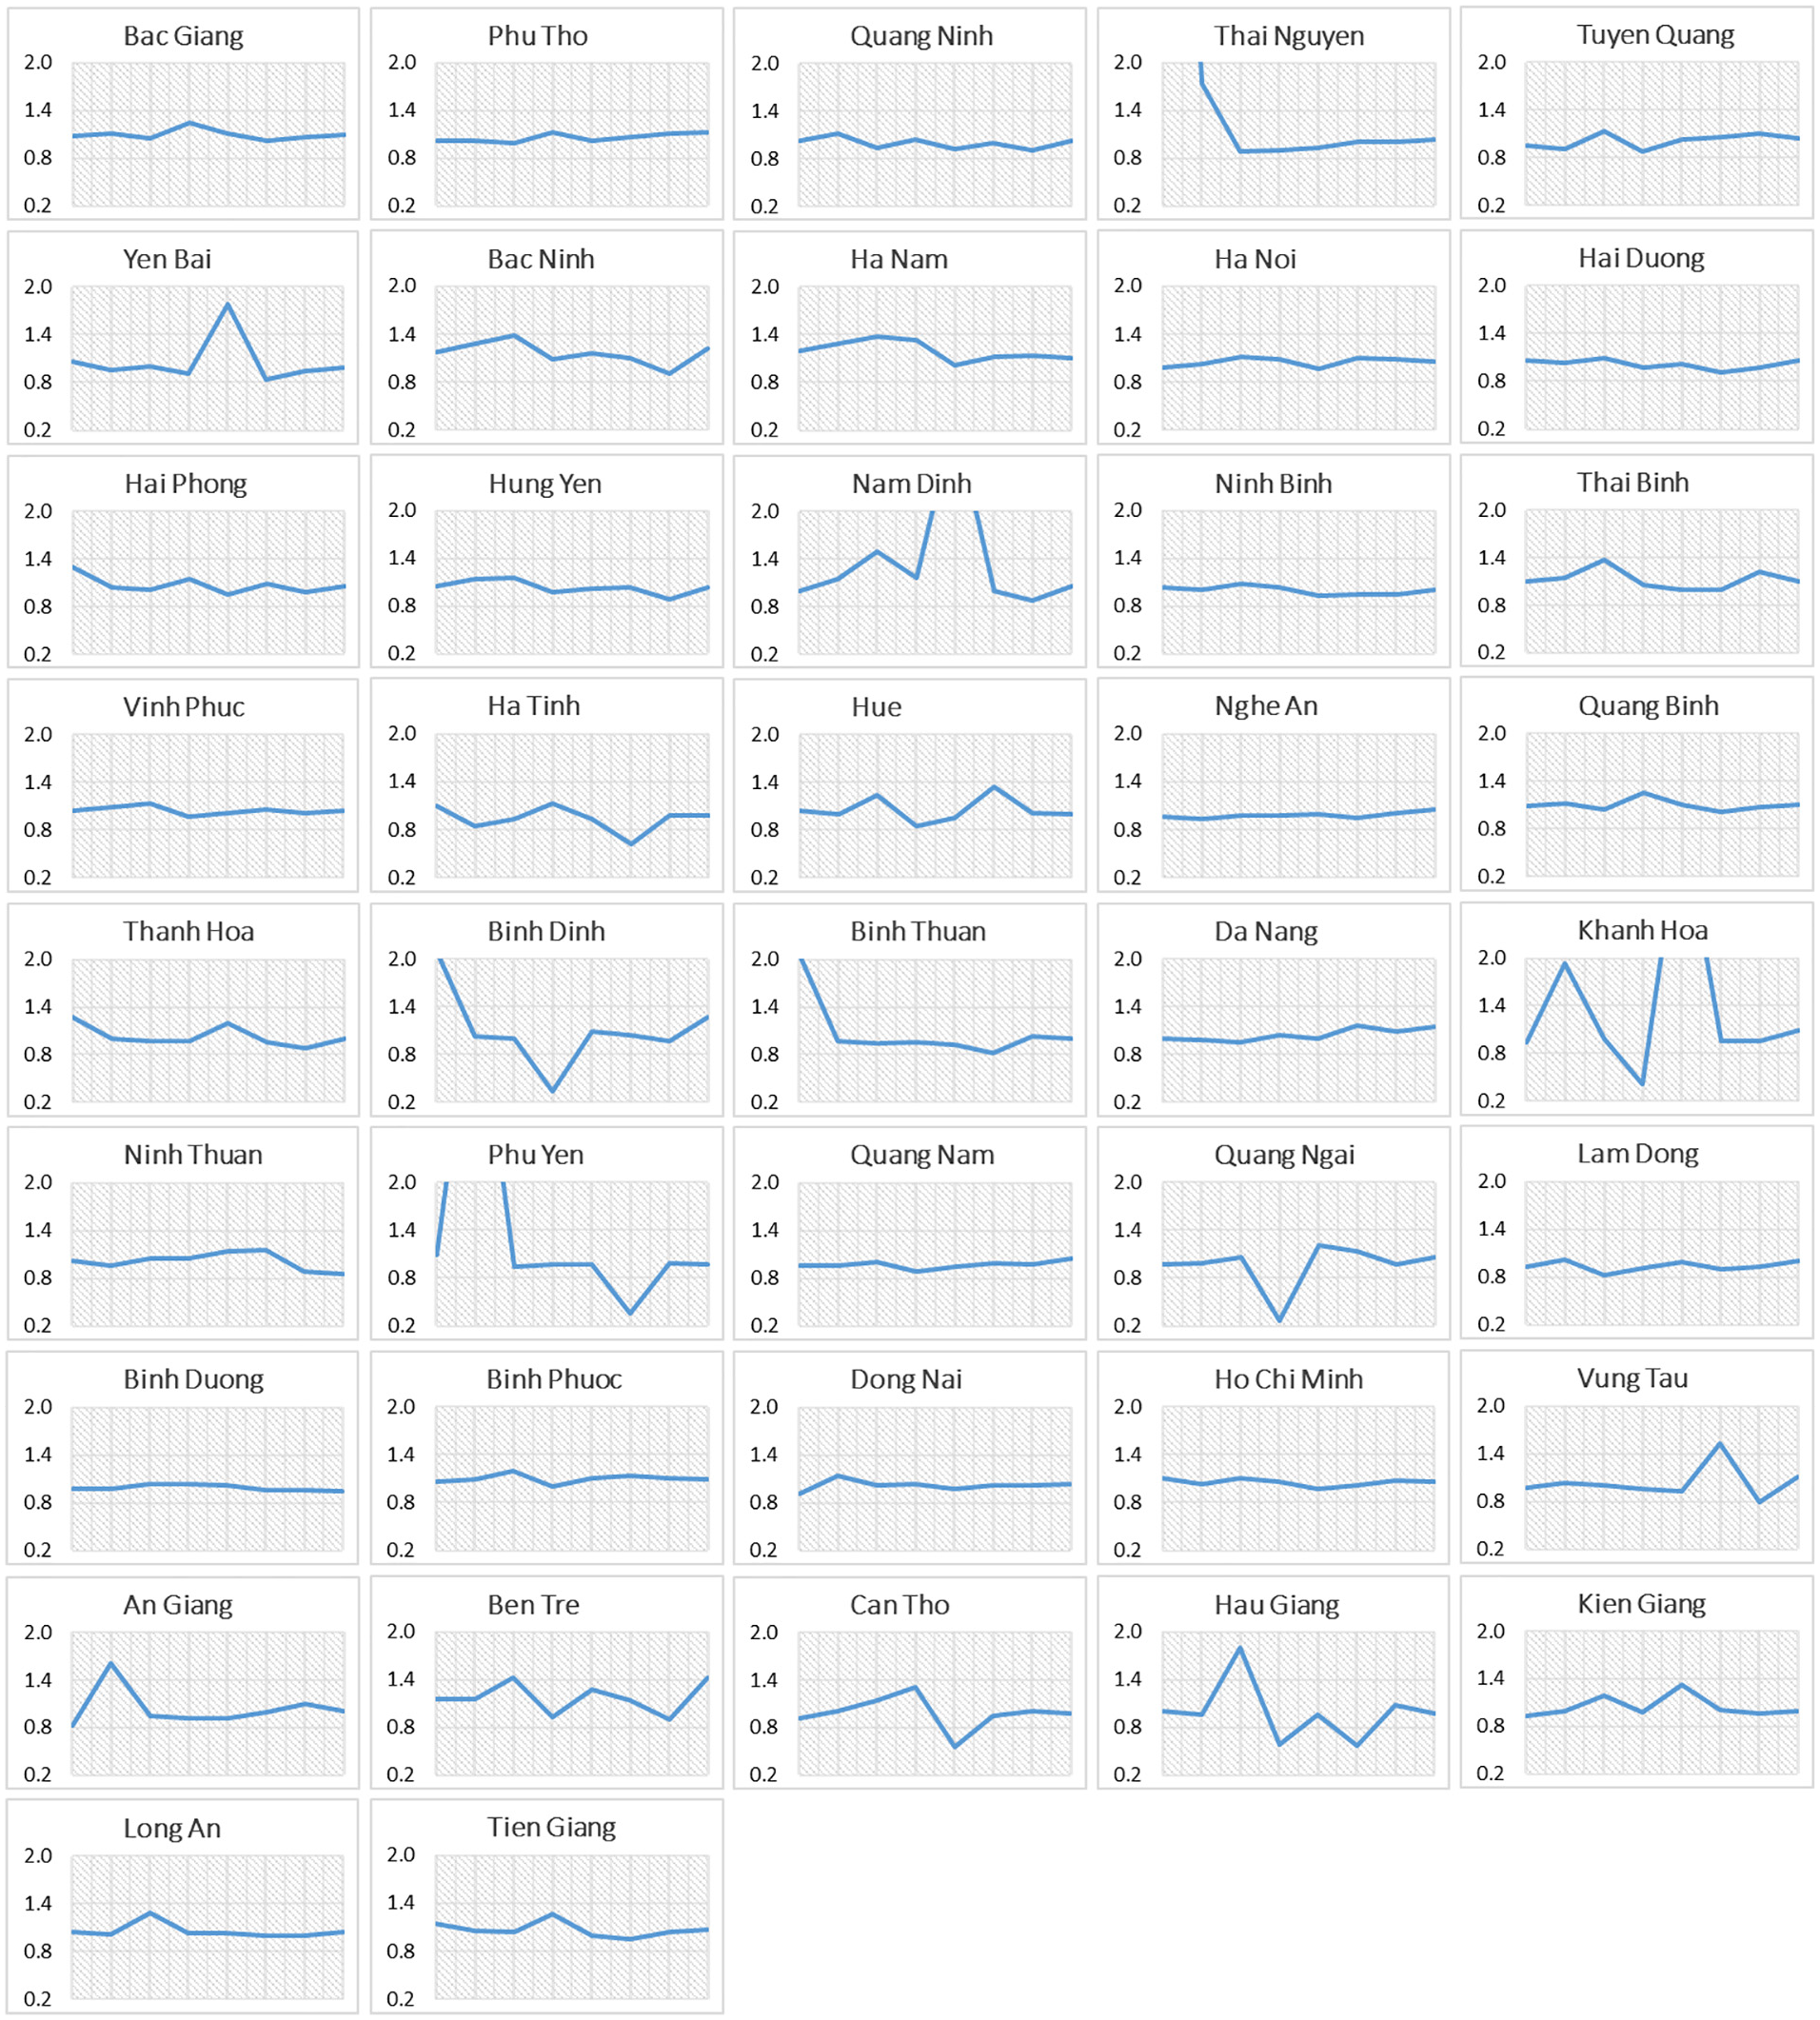
Evolution of Malmquist index for all provinces over 2012 to 2020.
Figure 4 plots the distribution of Malmquist indexes. Based on Figure 4, over the period 2013 to 2020, on average, nearly 80% of provinces (32 out of 42) are able to improve their efficiency, while only ten provinces experience efficiency loss. The numbers of provinces for MPI > 1 and MPI < 1 exhibit relative variations over the year, but in general, the number of provinces with efficiency gain is much higher than those with efficiency loss each year, except for 2015 to 2016 and 2018 to 2019.

Distribution of MPI over 2012 to 2020.
We conduct a decomposition of the MPI into CA (reflecting technical efficiency change) and FS (representing technological progress and change) indexes in order to identify the underlying factors driving the efficiency change. Figure 5 provides a visual representation of the average CA and FS indexes for the 42 provinces over the period of 2013 to 2020. The geometric mean is used to compute the average as both CA and FS are multiplicative in nature. The graph reveals several notable patterns. Firstly, the majority of provinces are concentrated around the point where CA = 1 and FS = 1, indicating that neither CA nor FS predominantly influences their efficiency change. Only Thai Nguyen and Lam Dong can be considered outliers, of which Thai Nguyen is a more obvious outlier. Thai Nguyen has the farthest and highest average CA, while its average FS ranks eleventh. Therefore, the highest performance change of Thai Nguyen during 2012 to 2020 can be attributed mostly to one force of efficiency gain driven by the province’s own technical performance as manifested in CA. Lam Dong is the only province with CA and FS lower than 1. Therefore, Lam Dong has the lowest MPI value, as reported in Table 6 is caused by both its own deteriorating efficiency performance and the unfavorable frontier shift driven by group-wide trend simultaneously.

Average catch-up and frontier-shift indexes for 42 provinces.
Conclusion
This study investigates the intertemporal efficiency for FDI attractiveness in Vietnam’s provinces during 2012 to 2020, using DEA and Malmquist index analysis. The dataset provides the provinces’ performance in five dimensions: Labor Force (LF), Gross Regional Domestic Product (GDP), Provincial Competitiveness Index (PCI), FDI by capital (cumulative FDI), FDI by cases (cumulative cases). To the best of our knowledge, using DEA and Malmquist index to analyze the provinces’ FDI attractiveness has not been explored in Vietnam. By separating the five indicators into input resources and outputs, DEA benchmarks the provinces’ FDI attractiveness relative to an efficiency frontier constructed by mathematical programming. Then, another important advantage of the paper is the decomposition of the Malmquist indexes based on DEA to trace the cause of intertemporal performance change, in which to find whether FDI attractiveness is led to a province’s individual performance change and/or frontier shift induced by group-wide common trend.
According to the DEA findings, Vung Tau, Binh Duong, Ho Chi Minh City, and Ha Tinh are capable of attracting the most FDI given their actual input resources. An Giang, Tuyen Quang, and Yen Bai, on the other hand, have the lowest efficiency over the years, meaning that they have not been maximizing their resources to attract FDI. As a result, there is significant potential for them to increase their efficiency performance by making better use of their current resources rather than growing them. According to Malmquist indexes, 80% of provinces can enhance efficiency performance between 2012 and 2020, while 20% experience efficiency deterioration. The provinces with the greatest efficiency loss are Lam Dong, Ha Tinh, and Quang Ngai. The effect of individual performance change and the effect of the frontier shift are not significantly different in strength for most provinces. Thai Nguyen, on the other hand, is an obvious outlier, with an exceptionally strong effect in one aspect that can be traced back to its economic situation.
This paper provides managerial insight and important guidelines for local policymakers and the government to improve FDI attractiveness across the country uniformly. From the standpoint of policymakers and local governments, the model identifies provinces that should be targeted for further improvement, as well as provinces that should serve as role models for others. Moreover, recent challenges, ranging from the Covid-19 pandemic to natural disasters and climate change, have compelled businesses to adapt their business models flexibly and align with global trends to navigate these difficulties. This adaptability is a critical factor in their success, both in serving society and protecting the environment. In response to these challenges, the Prime Minister issued Decision No. 1658/QD-TTg on October 1, 2021, endorsing the National Green Growth Strategy for the 2021 to 2030 period, with a vision extending to 2050 (The Current Status of Impacts of Foreign Investment on the Ecological Environment in Vietnam, n.d.). As part of this strategy, specific economic models that are climate-resilient, including the circular economy, are currently undergoing research and development. These initiatives create a favorable environment for driving the transition to green practices during the economic recovery phase. In line with these efforts, Vietnam is actively promoting the selective attraction of Foreign Direct Investment (FDI) to foster sustainable industrial development. FDI inflows are shifting towards high-value-added industries and occupations, with a focus on sectors employing high technology and projects that incorporate advanced, modern, and environmentally friendly technologies. Simultaneously, there is a gradual reduction in investments in labor-intensive industries. Projects with significant capital but a higher environmental pollution risk, reliance on outdated technologies, and a heavy dependence on labor are being carefully evaluated and, in some cases, declined.
This study has some limitations. First, due to a lack of data, some localities are missing from the investigation; therefore, in future research, a more detailed overall view can be implemented. Second, more input and output variables may indicate future research options, particularly unique ones associated to the Covid-19 epidemic and environmental features. The use of diverse input and output variables, as well as different approaches, may result in varied results and noteworthy findings. Also, most of the provinces under study are in developed regions and provinces in developing regions are underrepresented. Third, DEA by itself is unable to provide a statistical conclusion on the relevance of the assessment results. Enhancing DEA with bootstrapping is a solution to this issue (Simar & Wilson, 1998).
Footnotes
Acknowledgements
It is an honor to express my gratitude for great comments and feedbacks received from anonymous Referees and Editors.
Declaration of Conflicting Interests
The author(s) declared no potential conflicts of interest with respect to the research, authorship, and/or publication of this article.
Funding
The author(s) received no financial support for the research, authorship, and/or publication of this article.
Data Availability Statement
The data used to support the findings of this study are included and cited within the article.