
Abstract
This study measured the relationship between the variables that influence museum visitors’ use of wearable augmented reality (AR) technology using the technology acceptance model (TAM). We hypothesized that visual appeal, technological readiness, and facilitating conditions positively influence museum visitors’ technological beliefs and intentions to use AR. The results of partial least squares structural equation modeling analysis confirmed most of our hypotheses. Interviews with museum visitors revealed that AR visitors exhibited more complex perspectives than traditional visitors, which requires further use of digital technology to meet increasingly complex user demands. The variables of AR sound effects and leasing costs should also not be overlooked. The research results indicate the necessity of further enhancing the overall comfort of wearable AR while considering the growing number of users who wear glasses.
Plain language summary
This study looked at what affects museum visitors’ use of wearable AR technology using the technology acceptance model (TAM). We believed that factors like the visual design of AR content, people’s readiness to use technology, and ease of use would make visitors more likely to believe in and want to use AR. Using a method called PLS-SEM, we found that most of our ideas were correct. Interviews showed that AR visitors have various and complex needs, so we need to use digital technology more to meet these needs. We also found that AR sound effects and the cost to rent AR devices are important. Finally, the study suggests we need to make wearable AR more comfortable, especially for people who wear glasses.
Introduction
Visiting museums is a form of entertainment and leisure (Stephen, 2001), but as the number of recreational opportunities, including theme parks and shopping malls, increases and as government budgets shrink, museums are under pressure to increase the number of people who visit them and to maintain lasting relationships with these visitors (Díaz et al., 2018). In the past, museums were regarded as institutions that preserve cultural heritage and disseminate knowledge, but most modern visitors prefer to have a relaxed, pleasant journey as they acquire knowledge in museums; this approach has been implemented in many museums (Cushing & Cowan, 2017). Balancing the seriousness of acquiring knowledge with providing entertainment in the visitor experience, thereby achieving “edutainment,” is important for ensuring the sustainability of contemporary museums (Balloffet et al., 2014). Embracing the latest digital technologies is one solution that museums can adopt to achieve this balance. Numerous studies have shown that innovative applications of new digital technologies can enhance the museum visitor experience while maintaining the traditional museum functions of preservation, display, and education (Bruno et al., 2020; Coenen et al., 2013).
Augmented reality (AR) is regarded as one of the most promising digital technologies for improving the visitor experience in museums (Johnson & Witchey, 2011; Zhou et al., 2022). AR was first proposed as a concept in the middle of the 20th century, and it was first applied in the military (Azuma, 1997; Fenu & Pittarello, 2018; Kounavis et al., 2012; Matuk, 2016). Unlike the complete virtual environment of virtual reality (VR), AR aims to convince viewers that the virtual image is part of the real environment by superimposing a computer-generated virtual image onto the real environment in the same field of view (Azuma, 1997; Butchart, 2011; Kounavis et al., 2012). AR also features real-time interaction and three-dimensional registration (Azuma, 1997), which allow museums to add immersive virtual experiences while maintaining materiality and authenticity, which is in line with the original intention of many museum managers to use digital technology without damaging the cultural and historical value of the museum’s holdings. As a result of the successful use of AR technology in museums, the adoption of AR has become a key strategy for enhancing visitor experiences in museums across the globe (Petrelli et al., 2013; Tom Dieck & Jung, 2017).
The continuous integration of visitor perspectives is crucial to ensure that museums prioritize visitors effectively when applying the latest digital technologies. Contemporary museum visitors, especially millennials and those in Generation Z, live in an environment saturated with digital technology; as a result, the introduction of technologies like AR is often primarily intended to attract these younger visitors (Zhuang et al., 2021). However, the digitization process is often led by museum experts, scholars, and managers, while non-experts generally have limited input (Srinivasan et al., 2009). Due to a lack of user testing, many museums struggle to identify the most effective methods for digital exhibition (King et al., 2021). Although many museums outsource this task to professional digital technology companies, these companies may not excel at engaging museum visitors, potentially resulting in a disconnect between the digital technologies applied in museums and visitors’ digitized lives (Giannini & Bowen, 2019). Exploring the variables that affect museum visitors’ acceptance of the latest digital technologies, as well as understanding the relationships between these variables, is thus particularly crucial for museums and the developers of related technology.
Literature Review
In recent years, AR technology in museums has primarily focused on engineering design and usability as it seeks to integrate digital technology with traditional public spaces. Several AR experience systems for museums have been reported upon and evaluated, including digital modeling, labeling, and AR applications (Stichelbaut et al., 2021; Sugiura et al., 2019; Vusić & Kober, 2019). The use of AR-related technologies such as digital modeling, environment generation, real-time attitude tracking, and application development to enhance museum exhibits and cultural heritage have also been explored (Banfi et al., 2019; Barrile et al., 2019; Gherardini et al., 2019; Harrington et al., 2019; Pierdicca et al., 2018; Siekański et al., 2018; Van Nguyen et al., 2022). Moreover, AR has been used to improve the interaction and artifact experience for museum visitors (Gimeno et al., 2017; Li & Liew, 2015; Miyashita et al., 2008), as well as to manage and use artifacts through digital processing (Abbas et al., 2018; Nespeca, 2019; White et al., 2004).
Research on the development, design, and evaluation of AR technology in museums has made important contributions to the understanding of how AR technology can improve the experience of museum visitors. However, limited research on the use of AR technology in museums has been conducted that centers on the visitors themselves. He et al. (2018) integrated attention control theory and mental image theory to investigate how AR information types and virtual presence affect visitor experiences and their willingness to pay more; they highlighted AR’s potential to foster closer connections between visitors and museums. Nechita and Rezeanu (2019) examined AR in terms of entertainment and empathy, and confirmed that the multi-sensory stimulation environment created by AR enhances communication between young visitors and museums. Meanwhile, Scarles et al. (2020) demonstrated that linking AR with museums can provide new visitor experiences for navigation and visualization. Trunfio et al. (2022) emphasized AR’s role in Museum 4.0, positing that AR can transform the traditional binary relationship (visitor–museum) into a new ternary relationship (visitor–technology–museum).
Researching visitor acceptance of AR technology is important for predicting and evaluating visitors’ experiences with AR technology in museums. Haugstvedt and Krogstie (2012) evaluated users’ acceptance of an early AR application for cultural heritage, highlighting entertainment and knowledge acquisition as key reasons for its use. Chung et al. (2015) explored the acceptance of mobile AR applications, and they showed that visitors’ mental states influenced their AR use. T. H. Jung et al. (2018) found that esthetic experience was a common factor affecting visitors’ experience of cultural heritage AR, while different cultural backgrounds affected museum visitors’ opinions of and intent to use AR. Zhuang et al. (2021) found that ease of use, practicality, and subjective norms influenced young visitors’ willingness to use AR, thereby providing insights for adopting and promoting AR services in museums.
The main purpose of the present study was to explore the variables that influence the acceptance of wearable AR technology among museum visitors and their relationships. The following sections present, in sequence, the research model and hypotheses, methodology, results, discussion, and conclusion.
Research Model and Hypotheses
Technology Acceptance Model
The technology acceptance model (TAM) was first proposed by Davis based on the theory of rational action (TRA), and it is currently the most influential and commonly used theory for describing the degree to which individuals accept information systems (Davis, 1985; Y. Lee et al., 2003). TAM describes the causal relationship between the different external variables (EVs) of information systems, perceived usefulness (PU), perceived ease of use (PEU), attitude toward use (AU), behavioral intention to use (BIU), and actual system use (ASU; Davis, 1985; Davis, Bagozzi, & Warshaw, 1989; Zhuang et al., 2021). In the TAM, EVs refer to the various external design features of an information system, which may include graphical quality training and consultant support of the system interface (Davis, Bagozzi, & Warshaw, 1989). Subsequent studies on AR technology acceptance have extended the concept of TAM EVs to visual esthetics (Chung et al., 2015; T. H. Jung et al., 2018), hedonic motivation (Hammady et al., 2020; Rodrigues et al., 2019), personal technical readiness (Haugstvedt & Krogstie, 2012), facilitating conditions (Chung et al., 2015), personal innovation (Hammady et al., 2020), expectation of effort (Rizvić et al., 2021; Rodrigues et al., 2019), and subjective norms (Zhuang et al., 2021).
PU can be used to examine the extent to which users perceive that a new technology yields performance benefits, while PEU can be used to assess the effort that users exert when utilizing a new technology. Both PU and PEU are regarded as technological belief variables (Davis, 1989). AU, meanwhile, refers to an individual’s positive or negative emotions toward performing a specific behavior, while BIU measures the intensity of the individual’s intention to perform a specific behavior. Finally, ASU refers to the individual’s actual implementation of a specific behavior (Davis, Bagozzi, & Warshaw, 1989). According to the model shown in Figure 1, use of a new system is directly driven by BIU, which is determined by AU and PU, while AU is determined by PU and PEU. Finally, PU is directly affected by the EVs and PEU, and PEU is determined by the EVs (Davis, Bagozzi, & Warshaw, 1989; Hammady et al., 2020).
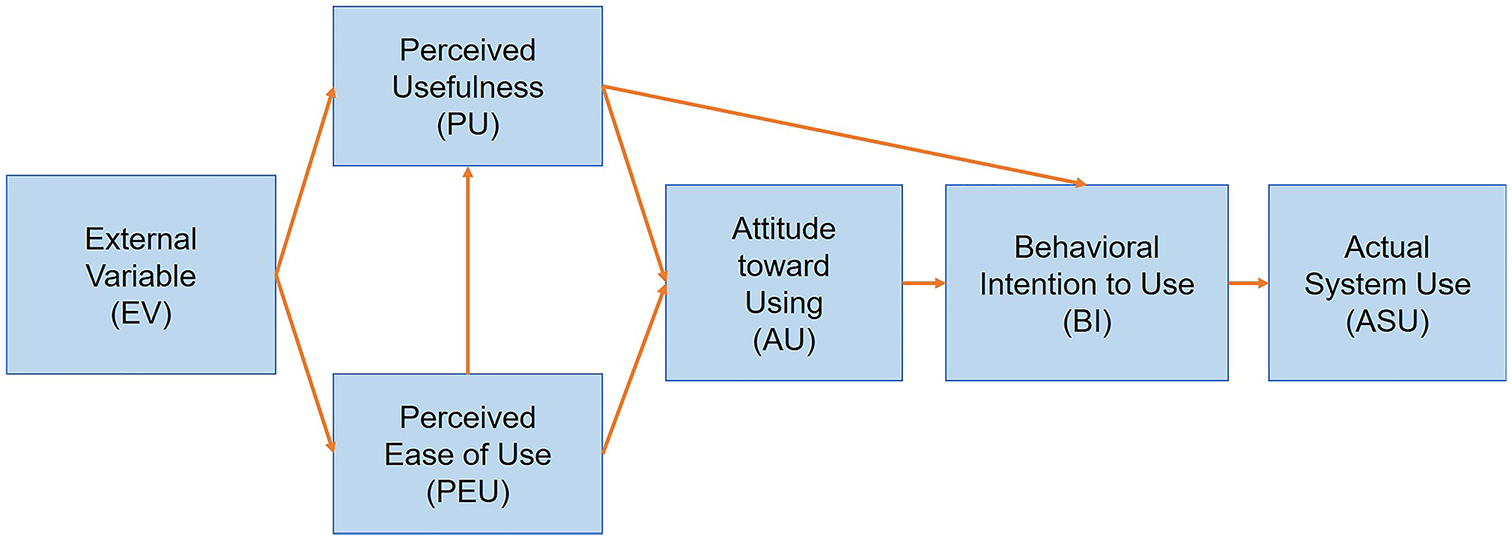
Technology Acceptance Model (Davis, Bagozzi, & Warshaw, 1989).
Proposed Hypotheses
AR visual appeal is an important EV that affects how museum visitors experience AR applications. (Cyr et al., 2006) posited that design esthetics determine the user’s intention and behavior to use a new technology. Such esthetics include user interface design, color, and pattern resolution. Experiencing AR in a museum is primarily an esthetic experience, as most experience-seekers tend to pursue sensory stimulation and not utility (T. H. Jung et al., 2018; H. Lee et al., 2015). Previous studies have shown that the visual appeal of AR is a useful predictor of the museum or cultural heritage experience (Chung et al., 2015; He et al., 2018; T. H. Jung et al., 2018; K. Jung et al., 2020; O’dwyer et al., 2021). We therefore hypothesized the following:
Visitors’ TR is another important factor that affects their experience of museum AR. TR is a personality trait that describes a person’s psychological readiness to accept new technologies; it is closely related to the PU and PEU of a new technology and further determines users’ behavioral intentions (Liljander et al., 2006; Yi et al., 2003). Previous studies have also demonstrated that TR is a useful predictor in the TAM (Chung et al., 2015). We therefore hypothesized the following:
Facilitating conditions are important EVs for visitors experiencing AR in museums. Facilitating conditions are conditions in the external environment that help users better and more easily use the new system. They include whether visitors have the equipment to use AR, whether they understand AR-related knowledge, and whether they are guided (Chung et al., 2015). Although some studies have demonstrated that facilitating conditions have no effect on the PU of a system (Karahanna & Straub, 1999), other studies have demonstrated that the perception of facilitation is an important variable affecting visitors’ acceptance of AR use in museums (Chung et al., 2015; Rodrigues et al., 2019). We therefore hypothesized the following:
Perceived enjoyment is the main construct for predicting a user’s attitude and behavioral intention in the TAM (T. H. Jung et al., 2018). It measures the degree to which users experience happiness when using the system (Van der Heijden, 2004). Previous studies have demonstrated the clear potential of AR technology to create an enjoyable museum experience when using AR (Tom Dieck & Jung, 2017). People’s perception of enjoyment induces cognitive factors that affect their PU, PEU, and behavior (Tom Dieck & Jung, 2017), as well as affecting their willingness to use information systems (Van der Heijden, 2004). We therefore hypothesized the following:
The acceptance of new technologies is usually influenced by users’ perceptions of the usefulness and ease of use of the technologies (Zhuang et al., 2021). PEU and PU are thus two important predictors in the TAM framework. PEU can be used to evaluate the effort required to use the system, while PU can be used to evaluate whether using the system improves the efficiency of one’s work (Hammady et al., 2020). In the context of museums, PU refers to whether visitors think AR technology is useful for them as they visit a museum—in other words, whether visitors acquire enough useful information and knowledge during their museum visit (Balloffet et al., 2014; Chung et al., 2015; Noreikis et al., 2019). Regarding this point, we hypothesized the following:
Based on the above hypotheses and the TAM model, we constructed the research model for visitors’ acceptance of wearable AR technology in museums shown in Figure 2.

Research Model.
Methodology
Instrument Development
The scale in this study was adapted from the work of Chung et al. (2015), Rodrigues et al. (2019), Hammady et al. (2020), and Wu et al. (2020; Table 1). Visual appeal items refer to the results of Wu et al. (2020), while TR items refer to those of Chung et al. (2015). The results of Rodrigues et al. (2019) and Wu et al. (2020) were referenced for facilitating conditions, and those of Hammady et al. (2020) were considered for perceived enjoyment and other constructs.
Constructs and Items.

The questionnaire was formulated based on Table 1 and consisted of two parts: Part A included demographic variables such as gender and age, and Part B was formulated based on the scale. The items in Part B were rated on a 5-point Likert scale, ranging from strongly disagree (1) to strongly agree (5). The wording of the items in Part B was modified to match the situation considered in our study. All items were written in English first and then translated and proofread by experts in both English and Chinese to ensure that the meaning of the items was accurate. A semi-structured interview questionnaire was also developed, and the interview items were also designed based on the structure of the scale (Table 1). Through the interviews, we sought to add further nuance to our results through qualitative analysis.
Case Description
Liangzhu Museum (LZM) is a cultural heritage museum located in Hangzhou, Zhejiang Province. Its exhibition hall covers an area of more than 4,000 m2, and it preserves and displays archeological discoveries from the Liangzhu Civilization site in the middle and lower reaches of the Yangtze River. More than 600 cultural relics are on display there, including artifacts made from jade, stone, pottery, lacquer, and wood, the oldest of which can be traced back 5,700 years, making them among the oldest archeological finds in China (Zhang et al., 2022; Zhang & Liu, 2021). In 2020, LZM was listed by UNESCO as a World Cultural Heritage site, demonstrating its significant value for scientific research and education (Zhang et al., 2022).
In 2020, LZM introduced AR technology developed by Rokid, a Chinese AR company; using this technology, the museum supplies visitors with visual guides and explains the artifacts they see in the museum (Sprigg, 2020; Figure 3). In contrast to previous studies on museum AR users, LZM’s AR technology is distinguished by two features: (1) the use of a mature product already available in the market and (2) the integration of wearable AR devices controlled by voice commands. This formally marketed product bridges the gap between data collection and real-world application (Brancati et al., 2015; Dieck et al., 2018; Litvak & Kuflik, 2020). Unlike previous museum technology interventions, which have used handheld devices, the LZM intervention employs a wearable, voice-controlled AR device (T. Jung et al., 2016; Khan et al., 2021; Miyashita et al., 2008). The AR technology used by the LZM consists of two parts: a pair of AR glasses and a 1,000-mAh mobile battery. In use, this AR device looks like a pair of normal sunglasses. When users gaze at an artifact, the AR glasses recognize the point of interest (POI) and then superimpose 3D animations and transmit sounds through a microphone. The integration of wearable AR with voice control allows users to control the playback of AR content, thus enhancing user–technology interactions and keeping the user’s hands free (Dieck et al., 2018; Park et al., 2008). The museum features over 20 POIs, each with a broadcast lasting 2 to 3 min that explains the selected artifacts.

LZM AR device and its use.
Data Collection
The target sample population for this study comprised tourists who had used the museum’s AR device within the LZM. We recruited participants at the museum’s AR device rental desk from those who had used and were returning their devices. Data collection formally targeted only those who had confirmed that they had undergone the AR experience in its entirety. Participants willing to take the survey scanned a QR code with their mobile phone to access and complete the electronic questionnaire, which was provided by SurveyPluto. Upon completion of the questionnaire, participants received a cash reward of 10 RMB (approximately $1.50). We also randomly asked interviewees if they would like to be interviewed further, and those who did and completed the interview were given a gift of 50 RMB (approximately $7.50).
Data collection was divided into two phases: a pre-test and a formal test. The pre-test was conducted in August 2021. A total of 24 valid questionnaires were collected during the pre-test, and the Cronbach’s alpha for the pre-test result was .943 (>.7) as determined by the SPSS reliability test. The formal test was conducted from September 2021 to September 2022, during which time data collection was interrupted several times due to the COVID-19 pandemic. Ultimately, a total of 182 questionnaires were collected, out of which 169 were valid. The sample size met the requirements for structural equation modeling (SEM), which was that the minimum number of cases for each estimated parameter should be between 5 and 10 (Wolf et al., 2013). Reliability testing in SPSS yielded a Cronbach’s alpha coefficient of .949, indicating high reliability (>.7).
Systematic sampling was employed for the interviews. Systematic sampling is a widely used sampling method known for its practical simplicity, on-site convenience, and high representativeness (Mostafa & Ahmad, 2018; Taherdoost, 2016). In this study, every 10th participant on-site was approached and asked if they would be willing to participate in the interview. If they agreed to be interviewed, we presented them with our questions, and the respondents provided their answers. A recording device was used to record the interview content, which was then transcribed to produce a transcript. Interviewees were numbered by gender and interview order; for example, the first female interviewee was numbered “F1.” A total of 18 participants, comprising 10 women and 8 men, were involved in the interviews. The data collection took place in the LZM public hall and coffee shop areas.
Data Analysis
Quantitative and qualitative research methods were combined in this study. We used partial least squares SEM (PLS-SEM) for data analysis. PLS-SEM is an analytical technique for detecting or constructing predictive models that has increasingly become mainstream in empirical research (Hair et al., 2011). The advantages of PLS-SEM, such as its low requirements for residual distribution and a smaller sample size, have contributed to its widespread application across various fields (Hair et al., 2014). Moreover, previous studies have suggested that the sample size for PLS analysis should meet the 10 times rule requiring the sample size to be at least 10 times the number of model paths (Goodhue et al., 2012; Hair et al., 2011). Based on Figure 2, the minimum sample size for this study should not be less than 140; we ultimately obtained 169 valid data points, complying with the 10-times rule.
Semi-structured interviews were conducted using the interview items listed in Table 1. We began by asking the predefined questions and, based on the participants’ responses, determined whether to follow up with additional questions until data saturation was achieved. The main purpose of the interview analysis was to assist in interpreting the quantitative results and gain additional insights into respondents’ attitudes. We applied thematic analysis to the interviews and processed the data through manual coding. More specifically, we analyzed high-frequency vocabulary and emotional expressions used by interviewees to determine their attitudes toward the use of AR in museums across different constructs.
Results
This section presents both the quantitative and interview results. We used PLS regression analysis in SmartPLS 2.0 to test the proposed research model with the quantitative results, which are presented in three parts: first, the demographic results covering the basic characteristics of the sample; second, the measurement model analysis, which evaluates the reliability and validity of the measurement instrument; and third, the structural model analysis, which validates the research hypotheses. We then present the interview results through the different research constructs.
Demographic Results
The survey targeted LZM visitors who had used AR services. Most interviewees were aged 30 to 39 years (72 people, 42.6%), and this cohort was followed by those aged 40 to 49 (23.08%) and 18 to 29 (22.49%). Those under 18 made up 9.47% of interviewees, while those over 50 formed the smallest group (2.37%). Among all interviewees, most had a bachelor’s degree (76, 44.97%), followed by those with a master’s degree or higher (37, 21.89%), although 29 (17.16%) had not completed high school and 27 (15.98%) held other professional certificates. Most were unfamiliar with AR and had used AR for the first time in the museum (123 or 72.78%). Table 2 presents the complete demographic data.
Demographic Data of the Study Sample.

Measurement Model
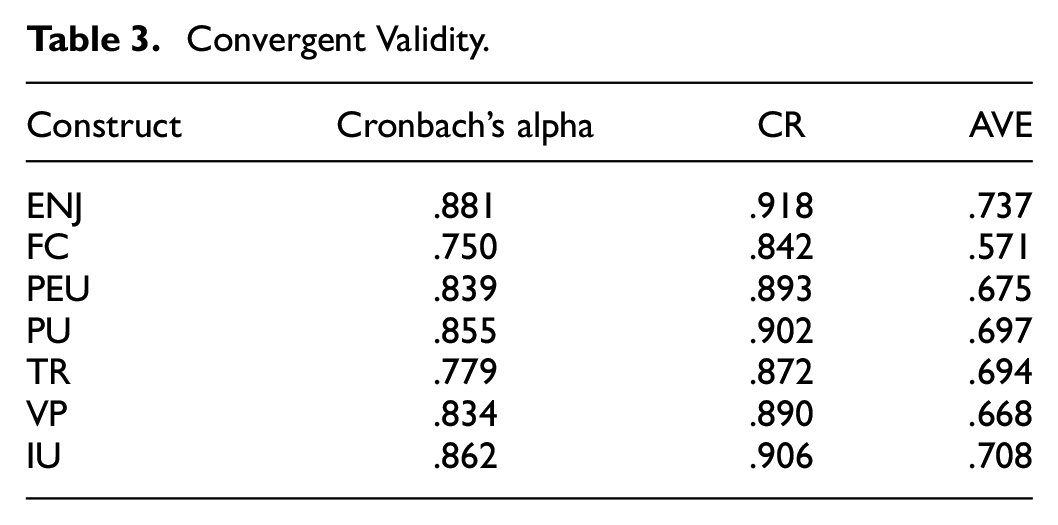
We used Cronbach’s alpha, the composite reliability (CR), and the average variance extracted (AVE) to assess the internal consistency, reliability, and convergent validity of the questionnaire. According to the recommendations of Hair et al. (2010) and Fornell and Larcker (1981), a Cronbach’s alpha greater than .7 and a CR above .6 were considered to indicate good internal consistency and reliability. An AVE value exceeding .5 for each construct suggests good convergent validity, following Fornell and Larcker (1981). Based on the results in Table 3, the questionnaire employed in this study has good internal consistency, reliability, and convergent validity.
Convergent Validity.
We used the cross-loadings, the Fornell–Larcker Scale, and the heterotrait–monotrait ratio of correlations (HTMT) to assess the discriminant validity of the questionnaire (Chin, 1998). The cross-loading results in Table 4 demonstrate that indicators load more strongly on their respective constructs (values shaded in gray on the diagonal) than on other constructs, which is consistent with the recommendations of Gefen and Straub (2005). Table 5 displays the results of the Fornell–Larcker criterion, where the square roots of the AVE (diagonal values) exceed the correlations between their constructs and other constructs (the off-diagonal values), aligning with the guidelines of Fornell and Larcker (1981). Additionally, in line with the suggestion of Henseler et al. (2015), discriminant validity is considered satisfactory if the HTMT value is below 0.9, and the HTMT results in Table 6 meet this criterion.
Discriminant Validity: Cross-Loading Analysis.

Discriminant Validity: Fornell–Larcker Criterion.


Note. The gray-shaded areas represent the square root of AVE for each construct, which exceeds the correlations with other constructs in the same row.
Discriminant Validity: Heterotrait-Monotrait Ratio of Correlations.

Structural Model Evaluation
The evaluation of the structural model assesses the relationships between variables in SEM, thereby validating the theoretical hypotheses (Henseler et al., 2015). We used a bootstrapping subsample comprising 500 observations for PLS analysis (Hair et al., 2012). Figure 4 shows the relationships among all constructs, and Table 7 presents the results of the path analysis of the structural model.

TAM Constructed in SmartPLS (**/* supported).
Results of Path Analysis via Structural Model.

Significant at p ≤ .01. *Significant at p < .05.
Visual appeal had a positive effect on the perceived enjoyment and PU of using AR in LZM (β = .663, p < .01). However, there was no significant positive effect on visitors’ PEU (β = .011, p = .913), which supports H1 but not H2 or H3. The TR of visitors had a positive effect on PEU (β = .234, p = .009), but it had no positive effect on perceived pleasure (β = .042, p = .558) or PU (β = −.03, p = .607). This result supports H4 but not H5 or H6. The facilitating conditions of using AR devices in LZM had a significant impact on visitors’ PEU (β = .377, p < .01) and perceived enjoyment (β = .166, p < .05), supporting both H7 and H8.
We also found that the perceived enjoyment of using AR was positively related to the PEU (β = .221, p < .01) and PU (β = .353, p < .01) of AR among LZM visitors and had a positive significance impact on visitors’ willingness to use related technologies again in the future (β = .179, p < .05). This result supports H9, H10, and H11. The PEU of AR contributed to the PU of LZM visitors (β = .398, p < .01) and their willingness to use related technologies again in the future (β = .375, p< .01). Finally, the PU of AR further affected vistors’ BIU (β = .257, p < .05), thus supporting H14.
Interview Results
Almost all the interviewees gave positive comments on the visual design of AR technology in LZM. Interviewees noted that the visuals were clear (M2, M13), exquisite (M5, M6, M9), realistic (M2, M15), in stereo (M5), and vivid (M10, F12, F18). Some interviewees (F1, F12, F17) stated that the visual field was too small, while other interviewees stated that the AR music had a good effect and thus a positive impact on the visual effect (F4, M13).
In terms of TR, all interviewees held different degrees of positive attitudes toward new technologies like AR. One interviewee (M2) believed that AR can provide people with a new way of viewing exhibitions that differed from traditional approaches, and some (M9, M6, F11) believed that it is fashionable to use new technologies like AR. Other interviewees (F4, M5, F12, M13, F18) said that they had already experienced similar techniques in other contexts. There was also an interviewee (M3) who planned to buy similar technologies later in life. However, some interviewees also suggested that the AR technology currently in use still needs to be improved in many ways, including in terms of content richness (F1), while some interviewees thought that AR technology would be more suitable for entertainment or games (M10, F14).
The evaluation of facilitating conditions focused on the areas of rental services and rents. Many interviewees said that the rental services for the device were quite convenient, as the rental counter was conspicuous (M3, F4, M5) and the service personnel provided effective guidance (M2, F4, F16, F18), although one said it was a little slow when there were many people (M2). Some interviewees complained that the rental fee was too high, which had a negative impact on their experience (M6, M13). In addition, one interviewee (F11) also mentioned that the battery was heavy, which affected their enthusiasm for using it.
Looking at perceived enjoyment, although all the interviewees gave a positive evaluation of the AR experience, most of them thought it could be improved. Some interviewees (F4, F11, M13, F14, M15, F17) thought that the main factor negatively affecting their enjoyment of AR was the lack of comfort in the hardware design of the glasses, which included a lack of sound insulation, as well as the weight and large size of the glasses. Other interviewees (F7, F8, F14) thought that they could not fully enjoy the AR because they were wearing prescription glasses, and two interviewees (M6, F18) were also dissatisfied with the lack of AR content and interaction.
All interviewees gave a positive evaluation of PEU, and nearly half of them (F1, M2, M5, M9, F11, M13, M15, F17) noted that language control was the most important reason for the PEU of the device. Some interviewees (F8, F18) thought that the guidance provided by service personnel enabled them to learn to use the AR glasses quickly. However, some interviewees (M2, F7, F11, F12, F16) thought that the response speed and accuracy of AR were insufficient, which affected their PEU.
In terms of PU, most interviewees (F1, M3, F4, M6, F7, F8, F11, F12, M13, M15, F18) believed that AR could present the traditional museum display information in a novel, intuitive, fast, and interesting way, which was helpful for them in acquiring new knowledge. More than half of the interviewees (M2, F4, M5, M6, M10, M13, F14, F16, F17, F18) thought that AR made their experience viewing the exhibition livelier and more interesting. However, some interviewees thought that there was room for improvement in the PU, primarily because the content was not as rich as expected (M5, F11).
In terms of IU, one respondent (F14) said it would depend upon the situation, while another respondent (F12) said that they would not recommend AR for people who wear prescription glasses, and still another interviewee had a clear intention to use AR in museums in the future. Among these interviewees, some (M3, F4, M10) hoped that the rental fee would be lower and the content would be richer and smoother; improvements in these areas would make them more willing to use AR devices in the future.
All 18 interviewees rated their overall satisfaction with AR positively. Most interviewees said that using AR in the LZM was satisfactory (M3, M5, F8, F11, F12, M13, F14, F16), interesting (F1, F7), and impressive (F4). Some interviewees (F7, M13) stated that the contrast between and integration of new technology and ancient artifacts improved their experience. Some interviewees noted that the experience was “not bad” (M6, M15, M10, F17), but some interviewees (F12, F17) stated that wearing prescription glasses affected their overall satisfaction with wearing AR glasses. Price was also a factor that affected the overall satisfaction (M10).
Findings and Discussion
Extension of Previous Research
We found that visual appeal was a useful predictor of people’s acceptance of using AR technology in museums; this is in line with the results of previous studies (He et al., 2018; T. H. Jung et al., 2018). However, in contrast to some previous studies on the acceptance of AR technology (Chung et al., 2015; T. H. Jung et al., 2018), our study showed that the visual appeal of AR had no positive impact on PEU. We suggest that visual design in AR is of great significance for people’s perception of pleasure and the PU of AR, but PEU may be more closely related to the complexity of the logic for AR use and have a weak relationship with perceptions of visual appeal.
TR had a positive impact on PEU, which is in line with the results of prior research (Chung et al., 2015, 2019), but we found no positive effect of TR on perceived enjoyment and PU. We believe that users’ familiarity with and attitude toward new technology affects how quickly they can grasp how to use a new technology, which further affects their acceptance of that technology. In contrast, individuals who have both a certain level of understanding of new technologies similar to AR and a positive attitude toward new technologies may have higher expectations for AR glasses. The presence of a negative gap between one’s actual experience and one’s expectations has a negative impact on perceived enjoyment and PU. This point is also supported by the results of the interviews; for example, respondents M3, F4, and M6, who had a positive attitude toward and experience with similar technology, suggested further improvements related to the perceived enjoyment or PU of AR content.
Our research also found that, in the context of AR use in museums, facilitating conditions had a positive impact on PEU and perceived enjoyment, while also affecting BIU, which is in line with the results of existing research (Chung et al., 2019; K. Jung et al., 2020). Facilitating conditions are the external environmental conditions that facilitate the use of new technologies, and we suggest that these include the availability of AR equipment in the museum and having staff to guide the visitors on the use of AR. Our quantitative findings suggest that all of the above-mentioned external conditions contribute to visitors’ use of AR.
Our results also support our hypotheses related to perceived enjoyment, PEU, and PU, which is consistent with the findings of existing research (Tom Dieck & Jung, 2017; Zhuang et al., 2021). Although some visitors noted that there were still some shortcomings, visitors to the LZM gave a good overall evaluation of AR technology in terms of perceived enjoyment, PEU, and PU.
The relationships among the constructs in the original model can be summarized as illustrated in Figure 5, where the dashed paths represent relationships not supported by this study.

New relationship among constructs.
New Findings of This Study
Our study fills a gap in the research on the acceptance of wearable AR technology in the context of museums in China. We synthesized the quantitative results through SEM and the qualitative results of semi-structured interviews to obtain new findings. We discovered diverse perceptions of wearable AR among the interviewed participants. Although overall the evaluations were positive, there were interesting differences in attitudes toward AR in LZM among different participants. We categorized these participants into three groups. The first group of participants, such as M5 and F11, thought that AR was an essential part of museum exhibitions, but the current AR offerings were not sufficient to meet their needs. The second group of participants, such as F1, M2, F4, M9, and M13, viewed AR as an engaging and vivid exhibition method, and found that the existing AR content was adequate to meet their needs. The third group of participants, such as M2 and F14, considered AR a supplementary element in the exhibitions, with the primary focus remaining on the physical exhibits. One possible reason for this differentiation is the diversity in individuals’ social and cultural backgrounds, because technology, individuals, and society are inseparable (Combi, 2016). This also corroborates Lester’s (2006) argument that visitors to virtual exhibitions have much more complex cultural and social backgrounds than traditional museum visitors. This insight indicates the need for AR to leverage the advantages of digital technology to provide diverse and customizable information to cater to visitors’ varied preferences.
We also identified several variables that may affect the acceptance of museum AR visitors, such as rental fees, voice control, and sound effects. First, we believe that the rental fee for AR devices has become a crucial external factor people consider when deciding to use AR. For example, respondents M6, M10, and M13 all stated that the rental fee was higher than expected, and some respondents (M10) clearly noted that the price would further affect their willingness to use AR in museums in the future. Future research should thus not ignore the monetary cost of AR rentals to visitors when considering the facilitation of AR technology use in museums. We believe that before setting prices, further investigation of the market is needed to ensure that rental costs are in line with the psychological expectations and payment ability of most museum visitors.
Second, we believe that voice control reduces the complexity of operating AR devices. The main logic of AR operations in this study was more phonetic than visual, which may further explain why visual attractiveness was not causally related to PEU in the quantitative analysis. Finally, music and sound effects were often mentioned as esthetic factors by visitors alongside visual design. Developers and museum administrators should thus also consider the esthetic effects of AR music and sound effects.
We found that the comfort of using AR equipment was also a key factor that affected museum visitors’ enjoyment of AR use, and it included two components. First, for universal users, the hardware may need to be upgraded due to problems with AR glasses, such as having a small field of view and heavy batteries. Second, the comfort of visitors who wear prescription glasses should be considered, particularly as more people are wearing prescription glasses. According to statistics from 18 European countries collected in October 2020, more than 50% of people wear prescription glasses, accounting for approximately 66.67% of the 27 countries included in the study (Michas, 2021). The needs of such groups should be considered when museums adopt interventions that require the use of AR glasses. Developers should design wearable AR devices that are compatible with prescription glasses, or museums should offer both non-wearable and wearable AR devices so that visitors can choose the modality that best suits their needs and physical comfort.
Conclusions
This study primarily explored the variables that influence the acceptance of wearable AR technology among museum visitors and the relationships among those variables. The findings suggest that a visually well-designed AR system with excellent facilitating conditions could significantly improve the receptivity of visitors who are already willing to use new technologies in museums. However, due to the diverse scope of these influencing factors, museums should consider these aspects during resource allocation, design, and development processes to mitigate risk. Additional qualitative research supported the stated results and revealed noteworthy underlying variables, which reflects the differentiation and complexity among museum visitors using wearable AR. This has significant implications for the sustainability of museums in a context that emphasizes social diversity, democratization, and economic recovery.
Limitations and Future Work
This study has several limitations, notably in that this study was narrow in the scope of both its research objects and data collection. First, we tested a pair of AR glasses with a language control function as the AR device, and visual design was not directly factored in the operation, so visual appeal may not positively affect PEU. Owing to the severe restrictions on inter-provincial and inter-city travel during the COVID-19 pandemic, the samples collected were confined to Zhejiang Province. Although this was a reasonable accommodation given the timing of the study, it remains a limitation, as different regions and cultural backgrounds have different levels of acceptance for AR technology (T. H. Jung et al., 2018). It is therefore necessary to conduct further studies on whether the findings of this study are applicable to other countries and regions.
Footnotes
Acknowledgements
Declaration of Conflicting Interests
The author(s) declared no potential conflicts of interest with respect to the research, authorship, and/or publication of this article.
Funding
The author(s) received no financial support for the research, authorship, and/or publication of this article.
Ethics Statement
The study complied with the IRB principles and was approved by the Ethics Committee of Jiaxing University. Before data collection took place, all participants were informed of the benefits, risks, purpose, and how the data were used. All tests were done with the participant’s consent and the questionnaire and interview were completed anonymously.