
Abstract
Studies show that adolescents have a heightened sensitivity to the urban context, such as violence. This study explores factors influencing and determine the areas of influence of students’ perceived stress when commuting from home to school in the city of Medellin, Colombia. To achieve these aims, a cross-sectional survey research design was employed with students in one school. A total of 301 students (aged 14–18) were chosen using convenience sampling. The data were analyzed using Machine Learning methodology (ML). Furthermore, a Geographic Information System (GIS) was employed to create an isoprobability map of areas of perceived stress. Among the students interviewed, 22.7% experienced stress while traveling to school. Socioeconomic, accessibility, transport and safety, urban violence and quality of life categories were found to be associated with school commute-related perceived stress. Within these categories, the traditional variables of distance (odds ratio [OR] = 5.21) and mode of travel (OR = 11.05) are significant. In addition, socioeconomic status (OR = 4.49), urban violence (OR = 1.04), high traffic accidents on the route to school (OR = 21.83) and poor perceived health (OR = 9.10) are significant and have a strong effect on stress. Stress perceived by adolescents during school commutes is largely explained by variables related to social and environmental factors that do not depend on the individual, such as urban violence, traffic accidents or the state of sidewalks. Therefore, public authorities should take appropriate measures to reduce students’ stress during school commutes, which would have a positive effect on these adolescents.
Introduction
Studies show that adolescents have a heightened sensitivity to the urban context, such as discrimination or violence (Collins et al., 2024). Adolescents commuting through regions characterized by elevated urban conflict levels might observe or be subjected to violence, such as gang-related incidents, shootings, robberies, and various aggressive behaviors (Pittman & Farrell, 2022). It has been also evidenced a significant link between violence exposure during the school commute and absenteeism, shedding light on how neighborhood violence may contribute to poor academic performance and increased high-school dropout rates. The chronic violence in students’ communities not only leads to stress and trauma but also increases school absenteeism as students try to avoid potential dangers while traveling to school (Burdick-Will et al., 2019).
Latin America is one of the regions with the highest urban violence in the world and Medellin, Colombia, is considered one of the most violent cities in the world. In 1991, the city’s homicide rate was 381 per 100,000 people (Doyle, 2019); a figure that fell to 22.2 per 100,000 by 2021, placing it among the lowest in Colombia. Despite the decline in homicides, Dávila and Doyle (2020) showed that perceived and real violence continues to have a negative effect on the lives of people in Medellin. In addition, it has been found that although adolescents in Medellin perceive that they enjoy a good quality of life overall, factors related to “physical activity and health, mood and feelings, and family and leisure” need to be improved (Higuita-Gutiérrez & Cardona-Arias, 2016).
Commuting to school (commuting to school refers to the daily transportation undertaken by students using various modes of travel to reach their educational institution) has shown to be associated with negative feelings due to its obligatory nature and the limited ability to make travel choices (Mokhtarian et al., 2015). In turn, objective and subjective travel experiences can have an influence on commuting stress. Objective experiences are associated with distance, travel time, travel predictability and comfort, while subjective experiences refer to satisfaction with the mode of travel or enjoyment of travel (Mokhtarian, 2019). Two factors that cause commuting stress have also been identified: lack of personal control over the trip and travel discomfort. Thus, the distance and duration of school commutes are related to perceived commuting stress. In this line, Gerber et al. (2020) and Morris and Guerra (2015) found an association between longer commutes and higher levels of stress and poorer health status. Therefore, distance influences stress perceived by students in school commutes. In addition, the more unpredictable situations students encounter when commuting, the more stress they will experience (Legrain et al., 2015). Conversely, when the distance between home and school is shorter and the commute is more comfortable, stress is mitigated (Legrain et al., 2015).
The mode of transport used to travel can also influence satisfaction or dissatisfaction with the commute and cause stress. Some studies have found that active commuting may be less stressful than commuting by car (Rissel et al., 2014). In this regard, it has been shown that physically active adolescents are at lower risk of stress and have higher life satisfaction (Chillon et al., 2017, for Spain; Chng et al., 2016, for the United Kingdom; Herman & Larouche, 2021, for Canada). In a study on school commuting in China, active commuters were found to have a significantly lower proportion of depressive symptoms than commuters who use passive transport (Sun et al., 2015). Other studies have shown that insecurity due to traffic or urban violence can make commuting a stressful experience (Legrain et al., 2015; Mokhtarian, 2019).
Among passive means of transport, car travel has been found to be the most stressful. However, it has been observed that travel can be more stressful when public transport is overcrowded and/or unreliable (Egli et al., 2020, for New Zealand). Eagle and Kwele (2021) found that the use of public transport in South Africa can cause high levels of stress, anxiety and fear. Thus, variables related to transport mode and safety may be determinants of stress.
Another factor that may affect the degree of stress during school commutes is quality of life, which depends on adolescents’ health status, whether they enjoy the time spent at school (social integration) and if they are physically active, among others (Kim, 2020). In this line, some studies have shown that more physically active adolescents generally have less stress and better mental health than those who do not engage in regular physical activity (Raj & Kanagasabapathy, 2020). A study of adolescent students in Medellin found that the most important dimensions of quality of life are family functioning, health status and area of residence. Thus, variables related to socioeconomic status and quality of life may influence the probability of experiencing stress while commuting.
Given the importance of studies on this topic, the scarcity of literature on the subject for the city of Medellin, and the need to identify the determining factors that explain the stress perceived by students at the time of their commute (home-school), five main research questions were posed: (a) How do socioeconomic variables impact students’ commuting stress levels? (b) What is the relationship between accessibility factors and students’ commuting stress levels? (c) How do transportation and safety variables influence students’ commuting stress levels? (d) To what extent does urban violence, specifically incidents of fights, affect students’ well-being during their commute? and (e) What is the geographic area within which there is a higher likelihood of students experiencing stress while commuting to school?
To answer these research questions, the following objectives are proposed: (a) Identify and analyze the specific factors that influence perceived stress among adolescents when commuting from home to school in the Comuna de Belén in Medellin, and (b) Determine the geographic areas where students perceive higher levels of stress when commuting from home to school for a particular school in the city. In addition to the variables considered in the literature, the main novelty of this work is that we include urban violence and other variables that indicate how adolescents perceive the urban context, such as traffic accidents and the state of sidewalks. To the best of our knowledge, the related literature on school commutes has not considered the degree of urban violence where students live. As Wiebe et al. (2013) argued, little research has been conducted on children and adolescents’ experience of neighborhood violence when traveling between home and school. Given this gap in the research, this study also examines urban violence as a possible stressor in school commutes.
The rest of this article is organized as follows. In Section “Materials and Methods” the research materials and methods are presented. Section “Results” includes the description of the results. Section “Discussion” offers a discussion, providing a rationale for the findings and comparing them to other studies and explaining the limitations of the research. Finally, Section “Conclusions and Recommendations for Future Search” presents conclusions and considerations for future work.
Materials and Methods
Area of Study, Design, and Data Description
This study was conducted in Medellin, Colombia, the nation’s second-largest city, known for substantial inequalities in living conditions (Sepúlveda-Murillo et al., 2019). Commuting to schools in Medellin presents many challenges, including high crime rates (Doyle, 2019) that lead to fears of muggings, thefts, assaults, heavy traffic, inadequate signage, and reckless driving, all contributing to increased stress and anxiety among students. Additionally, poor pedestrian infrastructure and insufficient lighting raise the risk of accidents, while overcrowded and unsafe public transportation increases frustration (Álvarez-Balbín, 2021; Lizarazo & Valencia, 2018). These factors collectively affect the educational community’s emotional well-being and quality of life. The lack of comprehensive studies addressing these specific challenges highlights the need for targeted research and interventions to improve commuting conditions in Medellin.
A cross-sectional study was carried out in the second semester of 2019. A questionnaire was administered to adolescent students enrolled in a public school, located in the southwest of Medellin, Colombia. This high school has a student body of all socioeconomic levels. The questionnaire was designed based on the reviewed literature. All students (301) ages 14 to 18 enrolled in 2019 in the 9th, 10th, and 11th grades of the studied school were surveyed using convenience sampling. Approval was obtained from the school administration to conduct the research. Parents were informed about the study and written consent was obtained from the students.
Study Variables
The questionnaire items were initially crafted based on an extensive literature review and consultations with experts in urban studies in Medellin and educational psychology. Following Choi et al. (2020), we measured perceived stress by asking the students if they experienced stress when commuting from home to school. This allowed us to obtain a binary response variable (stress), which takes the value of 1 if the student indicated that they experience stress during the commute and 0 otherwise. Factors possibly related to stress were determined two ways: through the questionnaire and by means of other external factors not included in the questionnaire. More specifically, variables related to perceived stress were obtained from the questionnaire, while the external factors were the Euclidean distance between the students’ homes and the school, the location of street fights (information provided by the Secretariat of Security Medellin) and, finally, the socioeconomic stratum of the area where the students’ homes were located (National Administrative Department of Statistics-DANE, for its Spanish acronym; DANE, 2022).
The variables were grouped into five categories: socioeconomic, accessibility, transport and safety, urban violence, and quality of life. The socioeconomic category includes the variable status, which represents the socioeconomic stratum of the area where the student’s family lives, and the variable lives, which captures whether the student lives with both parents. In Colombia, socioeconomic strata are defined according to the conditions of the dwelling and the area where families live. Six strata ordered from the worst (stratum 1) to the best (stratum 6) socioeconomic conditions are used to classify the households (DANE, 2022). For students who live in a stratum 1 or stratum 2 area, the variable status takes the value of 1, and 0 otherwise. The accessibility category includes the variable distance, which represents the Euclidean distance between the dwelling and the school in kilometers, and the binary variable sidewalk, which captures the state of the sidewalks perceived by the students on the route from home to school. The transport and safety category includes two binary variables: transport mode and accident. The first variable represents the means of transportation used by the students to travel to and from home and school. Given the context of this study (Medellin), commuting by public transport may be more stressful. The second variable in this category, accident, refers to students’ perception of the frequency of traffic accidents on the route. Figure 1a shows the location of the school, the location of the students’ homes, the socioeconomic stratum of the area where the students live and the variable perceived stress.
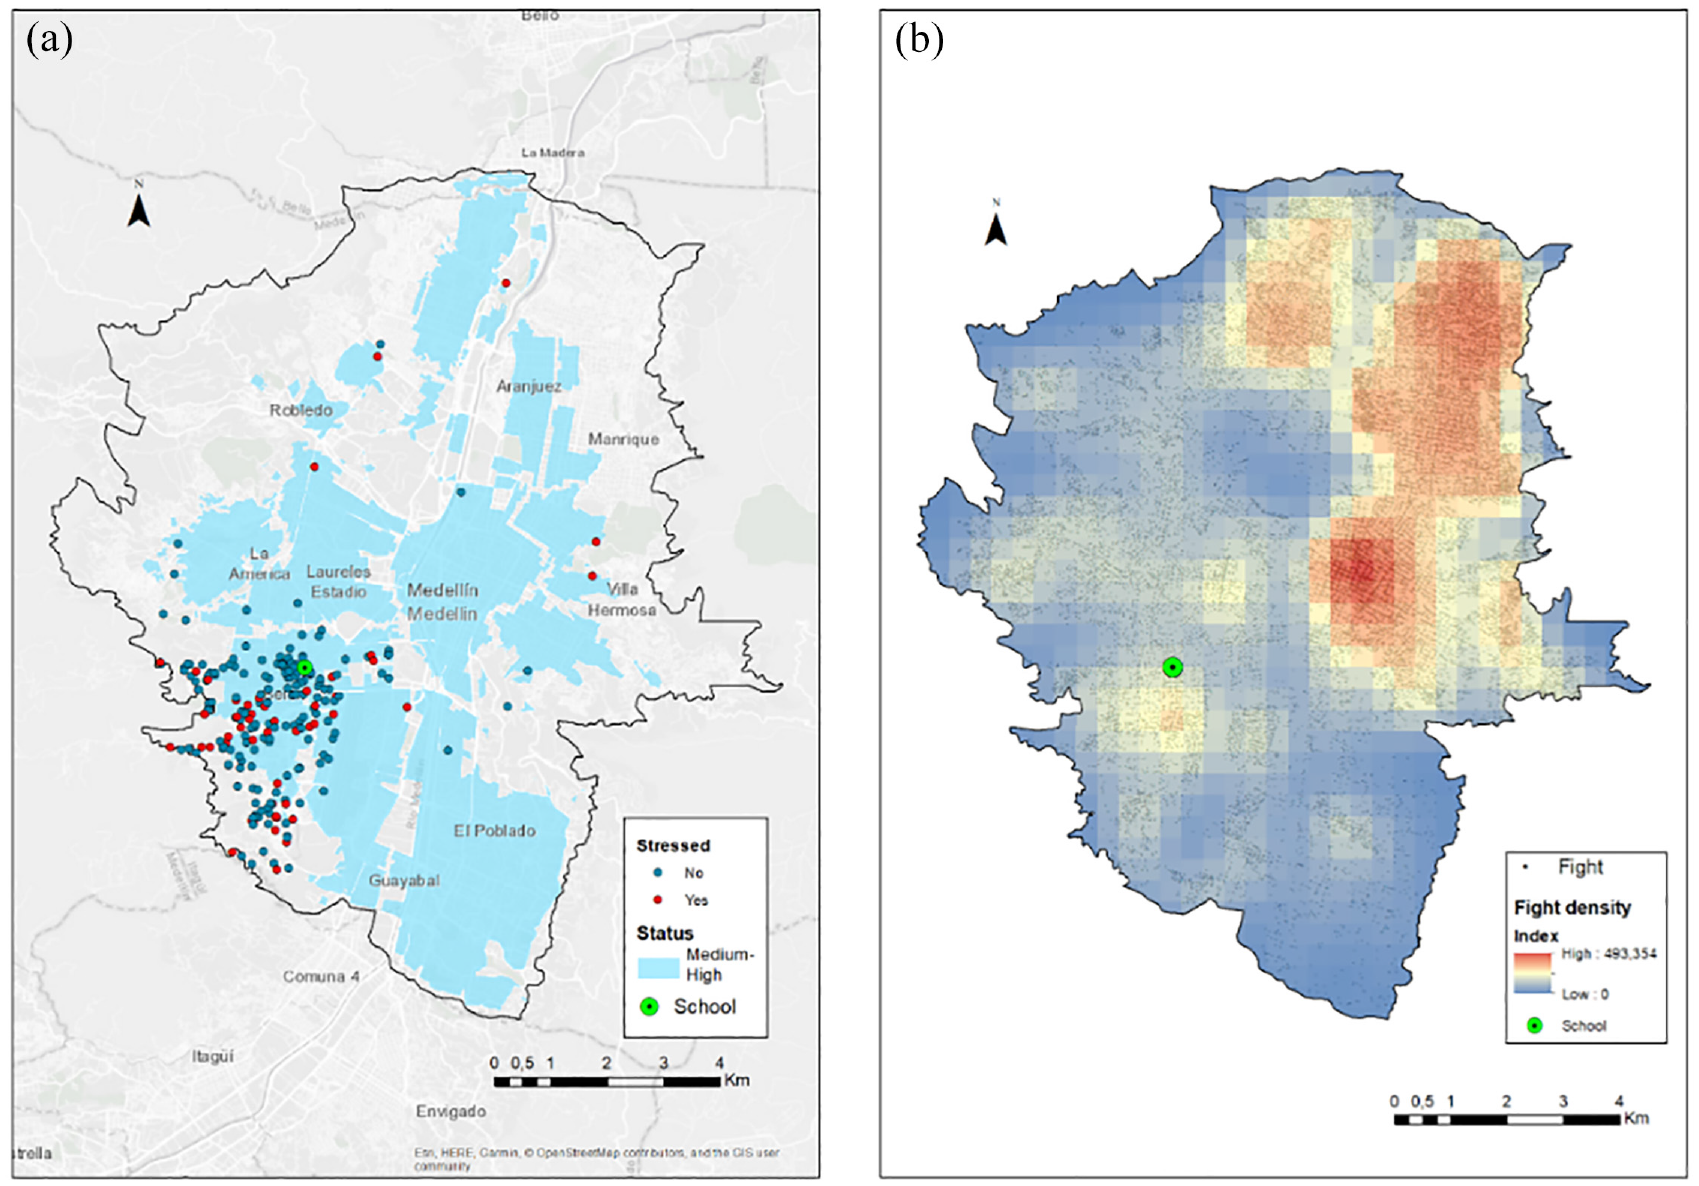
(a) Location of dwellings and the school and the variables status and perceived stress and (b) location of fights and their density index in Medellin.
In the urban violence category, the continuous variable fight was included. This variable represents the density of fights in the area where the student lives and is a proxy variable for urban violence (Figure 1b).
Aspects related to quality of life depend on the person’s physical and mental health; degree of independence; social relations and social integration; and personal, religious and spiritual beliefs (Kim, 2020). To capture these aspects, the quality of life category includes three binary variables: sport, which indicates whether the student plays extracurricular sports; health, which represents whether the student perceives themselves to be in good health; and the variable enjoys, which captures whether the student feels satisfied at school. Table 1 shows the coding for each of the study variables.
Coding and Descriptive Statistics for Each of the Variables of Study.

Data Processing
Once the information was collected, the data was initially cleaned. After eliminating the forms with missing data, 224 valid questionnaires were obtained (98 boys and 126 girls), yielding a response rate of 74.4%. These were georeferenced. The external factors were constructed, distance, fight, and socioeconomic stratum. The distance represents the Euclidean distance between home and school in kilometers. The variable fight was obtained by kernel density estimation (Gaussian kernel density) for spatial data considering a radius of influence of 1.3 km. A high value in this variable indicates a high density of fights, while a low value indicates a low density of fights. Figure 1b shows the points where some fights occurred. In 2019, a total of 57,567 fights were recorded in Medellin. These three external variables were constructed using a GIS. In addition, the ReliefF algorithm (Urbanowicz et al., 2018), which is implemented in the R software CORElearn package (Robnik-Sikonja et al., 2018) was used to select the explanatory variables. Finally, all the information was merged into a unified spatial database.
Statistical Analysis
The statistical analysis of the dataset involved the computation of summary statistics, providing a comprehensive overview of the variables employed in the study. Additionally, traditional, and spatial statistical graphs, some of which are presented in this paper, were employed to analyze the global and local dynamics of variables.
Then, Machine learning algorithms were used to study and explore factors influencing perceived stress among adolescents during their commutes to school in Medellin, Colombia. Below we present a brief description of the steps used in modeling and the statistical metrics used for the selection of the final model.
The organized database was randomly divided into two parts: one to train the algorithms (70%) and the other to evaluate them (30%). The frequency of the response variable (stress) showed that the target category (1 = stressed or very stressed) had little data, that is, the database was imbalanced. To overcome this problem, the synthetic minority over-sampling technique (SMOTE; Mansourifar & Shi, 2020) was used on the training database.
The metrics used to evaluate and thus select the most appropriate method were Zero-One loss, the F1-score, specificity and the area under the precision-recall curve (PRAUC); metrics that are widely employed in the literature on the use of machine learning algorithms. According to the metrics considered, logistic regression was the most appropriate method to explain the phenomenon under study.
Logistic regression is a statistical method used in machine learning for classification tasks. It’s particularly useful when dealing with binary outcomes, meaning the prediction has two possible answers and is related to a set of explanatory variables (Dwivedi, 2018; Hosmer et al., 2013).
Finally, in line with the study’s second objective, an isoprobability map was created to illustrate areas where the probability of feeling stressed remains constant. This map permits identifying the zones where students are most likely to experience perceived stress during their commute from home to school.
Results
Preliminary Statistical Analysis
Table 1 shows descriptive statistics (Mean, Minimum, Maximum, and Standard Deviation) for each of the study variables. As can be observed, the average distance between home and school is 1.69 km, 14% of the students use public transport and 22.7% experience stress in their commute from home to school. Additionally, half of the students report that the sidewalks are in a poor state and 52% live in a single-parent household. Some studies have shown that girls experience higher levels of general and academic stress (Raj & Kanagasabapathy, 2020), although other studies have found no differences by gender (Pittman & Farrell, 2022). It should be noted that the variable used to capture the students’ gender was discarded by the ReliefF methodology, since it is a variable commonly used in these studies. This result is also supported by the chi-squared test (χ2 = 1.499, df = 1, p = .221), thus indicating no association between gender and perceived stress in the study population.
On the other hand, the spatial distribution of perceived stress and fights is shown in Figure 1a and b, respectively. Both reveal geographic variation in the study area. Figure 1b shows that fights often occur in the north-east and center-east areas (zones marked in warm tones). Although the school is located in an area with a low density of fights, to the south of the school there is a medium-high degree of urban violence, which coincides with a medium-low socioeconomic stratum.
Modelling
The fifth model (Mod5) shown in Table 2 was obtained using the ML methodology indicated above and includes the variables selected from the above categories. To quantify the explanatory and predictive contribution of the variables considered, a set of nested models was estimated and compared using different metrics. To this end, the first model (Mod1) only included the socioeconomic variables (status and lives), the second model (Mod2) incorporated variables related to accessibility (distance and sidewalk), the third model (Mod3) included variables related to transport and safety (transport and accident), the fourth model (Mod4) incorporated an urban violence variable (fights) and the fifth model (Mod5) incorporated variables that capture students’ quality of life (sport, health and enjoys).
Model Results

Note. AIC = Akaike information criterion; VIF = variance inflation factors; Odds ratio (OR) in parentheses and 95% confidence interval [CI] in square brackets.
p < 0.1, *p < 0.05, **p < 0.01, ***p < 0.001.
Table 2 shows that the final model does not present serious multicollinearity problems since all the variance inflation factors (VIF) are well below 5. With respect to the overall significance of the model, the p-value associated with the chi-square statistic is less than 1%, thus indicating that the last model and the previous ones are significant. The metrics indicate that the inclusion of the variables representing the different categories significantly improved the explanatory and predictive capacity of Mod1 to Mod5. In particular, as regards the explanatory capacity of the model, the Pseudo R2 was four times higher and the Akaike information criterion (AIC) decreased substantially from 275.2 to 154.39. The predictive capacity, accuracy and precision, which measure the observational error, also improved.
Moreover, according to the p-values, all the variables have a statistically significant estimated coefficient. In addition, the signs of these coefficients are as expected; thus, the sign of the coefficients of the binary variables whose reference value is a stressor is positive. However, the sign of the coefficient of the variable sport is negative since students who do sports activities are less likely to feel stressed. On the other hand, the continuous variables (distance and fight) also show the expected signs: as the distance between home and school increases, so does the probability of experiencing stress. The same thing occurs for areas with a high density of street fights. Table 2 also shows the odds ratios (OR) for the explanatory variables. The OR of the variable distance is greater than one, thus indicating that the greater the distance travelled to school, the higher the stress. More specifically, this OR (5.21) indicates that when the distance between home and school increases by one kilometer, the likelihood that a student will experience stress increases by 421% ((5.21−1) × 100). As for the variables in the quality of life category, perceived health has the greatest weight in stress perceived by the students. Specifically, the likelihood of suffering stress on the commute from home to school increases by 810% for students who state that they are not in good health compared to those who are in good health. In addition, students who state they play sports are 2.44 (1/0.413) less likely to suffer stress than those who do not play sports.
The binary variable with the highest OR is accident (21.83). This value indicates that if students frequently observe accidents on the way to school, the odds of experiencing stress on the route increase by 2083% with respect to those who do not observe accidents or when they occur infrequently. It should also be noted that the OR of the variable fight is greater than one, indicating that students who live in areas with a high density of fights are more likely to feel stressed. Finally, it is important to highlight the case of the variables sidewalk and transport mode because they reflect structural and mobility problems that can be addressed by public authorities.
Isoprobability Map
Finally, an isoprobability map of perceived stress is shown in Figure 2. The blue and red lines indicate the limits where the estimated probability of perceived stress among adolescents is equal to 0.2 (blue line) and 0.5 (red line). In general, these probabilities are lower for students who live closer to school and significantly higher for those who live farther away. As can be observed, the area within the blue line, that is, the area where students experience little stress (less than 20%) is irregular in shape, not very large and in close proximity to the school. The area between 20% and 50% is also irregular, but much larger and at a farther distance from the school. The figure also shows the observed values for perceived stress among the students (red and blue circles). The estimated values of the probability of experiencing stress are indicated by triangles for values lower than 0.5 and by squares for values equal to or higher than 0.5. The figure shows a high degree of agreement between the blue dots and rectangles, as well as between the red dots and squares (accuracy = 0.769). It is also observed that the greater the distance, the higher the level of stress, although the effect of distance differs depending on the direction. More specifically, distance affects students differently depending on whether they live in the area north of the school or in the area south of the school, since other variables influence perceived stress, such as urban violence.

Isoprobability map of perceived stress with thresholds. Observed and estimated stress.
The center of Figure 3 includes a zoom of the school’s surroundings showing the 0.2 threshold line, the variable stress and the density of fights. As can be observed in the zoom, outside the central area delimited by this line, and in particular to the south of this area, there is a higher concentration of fights and also a higher number of students who stress. Therefore, a possible cause of stress among some of the students who live relatively close to the school is the presence of fights in the area where they reside.

Zoom of the school surroundings with a threshold (blue line) equal to 0.2 for probability of perceived stress and fight density index.
Discussion
According to the research questions, five explanatory categories of commuting stress have been analyzed (socioeconomic, accessibility, transport and safety, urban violence, and quality of life). This study has shown that the variables included in the socioeconomic, quality of life, transport and safety, and urban violence categories have a significant influence on stress perceived by adolescents when commuting to school. Thus, it is corroborated that greater distances between students’ homes and the school (Gerber et al., 2020; Morris & Guerra, 2015), traffic accidents (Legrain et al., 2015; Mokhtarian, 2019), riding the bus (Legrain et al., 2015) and the poor state of sidewalks increase the probability that the students will experience stress when commuting to school. Specifically, the poor state of the sidewalks is a problem that has been reported by the residents of the Comuna de Belén where the school is located, and cracked, broken and irregular surfaces have caused some people to fall (Álvarez-Balbín, 2021). The sidewalks should be maintained in a better state, built away from busy roads and have more natural spaces that allow comfortable active travel (Egli et al., 2020).
The variables related to socioeconomic status and quality of life have been shown to affect the probability that adolescents in Medellín will suffer stress while commuting to school, as noted by Higuita-Gutiérrez and Cardona-Arias (2016). Specifically, adolescents who do sports and are more physically active tend to experience less stress when commuting to school than those who do not engage in regular physical activity (Raj & Kanagasabapathy, 2020). Likewise, poor perceived health increases the probability of suffering stress during school commutes.
As regards the incidence of urban violence, a higher degree of stress was observed in conflictive areas where street violence and fights are more frequent, thus increasing both the probability and degree of stress when students who live in these areas travel to school. This aspect is of particular concern in Medellin, since although crime rates have decreased in the city (Dávila & Doyle, 2020; Doyle, 2016), perceived violence continues to be a problem in the daily lives of its inhabitants, especially the youngest ones.
In addition, the probability map estimated the geographic area within which students are most likely to experience stress while commuting to school. These spatial distributions indicate that students who live close to school are less likely to experience stress than those who live farther away. Results in line with those found by Legrain et al. (2015), which states that those with longer commutes are, in general, more stressed.
Limitations of the Study
While our study provides valuable insights, several limitations should be noted and that can be overcome in future work. First, the sample size was relatively small and limited to a specific geographic area, which may affect the generalizability of the findings. Second, the study relied on self-reported data, which could introduce response bias. Additionally, the cross-sectional design limits our ability to infer causality between variables. Third, certain contextual factors that could influence the outcomes were not controlled for, which may have impacted the results. Fourth, it is important to note the absence in the existing literature of a specific tool designed to assess students’ commuting stress.
Conclusions and Recommendations for Future Search
Five main research questions were posed in this study: (a) How do socioeconomic variables impact students’ commuting stress levels? (b) What is the relationship between accessibility factors and students’ commuting stress levels? (c) How do transportation and safety variables influence students’ commuting stress levels? (d) To what extent does urban violence, specifically incidents of fights, affect students’ well-being during their commute? and (e) What is the geographic area within which there is a higher likelihood of students experiencing stress while commuting to school? To address these questions, we employed an exploratory survey targeting a convenience sample of adolescents of a particular school of Medellin, Colombia. Additionally, we utilized various machine learning methods, with the logistic regression model demonstrating the best performance in answering these questions. With the results of the logit model and using GIS, an isoprobability map of perceived stress among adolescent commuters was constructed.
Among the students interviewed, 22.7% experienced stress while traveling to school. Socioeconomic, accessibility, transport and safety, urban violence and quality of life categories were found to be associated with school commute-related perceived stress. Within these categories, the traditional variables of distance (odds ratio [OR] = 5.21) and mode of travel (OR = 11.05) are significant. In addition, socioeconomic status (OR = 4.49), urban violence (OR = 1.04), high traffic accidents on the route to school (OR = 21.83) and poor perceived health (OR = 9.10) are significant and have a strong effect on stress. Stress perceived by adolescents during school commutes is largely explained by variables related to social and environmental factors that do not depend on the individual, such as urban violence, traffic accidents or the state of sidewalks. Therefore, public authorities should take appropriate measures to reduce students’ stress during school commutes, which would have a positive effect on these adolescents.
The results also indicate that the public authorities could mitigate perceived stress among adolescents during school commutes through infrastructural and educational measures. Such measures could include providing school buses to avoid students having to use public buses, reducing urban violence, improving the state of sidewalks, encouraging students to do sports and improve their health or other measures to ensure they feel safe at school (i.e., anti-bullying measures).
Identifying the factors that influence stress in adolescents can aid in designing public policies to make school commutes more beneficial and less stressful for students, which in turn can have positive effects on the school environment. Given the physiological and psychological benefits of safe and comfortable commutes to school, it would be advisable to involve public health institutions, schools and families in improving the built environment and measures to reduce the traffic and urban violence on these routes.
Finally, to strengthen future research and build a more comprehensive understanding of topic, several key recommendations deserve attention.
Addressing limitations: As discussed previously, future studies should aim to overcome the limitations identified. This will help generate more reliable findings.
Larger, more diverse samples: Broadening the research scope by including larger and more diverse participant pools across various regions can improve the generalizability of the results.
Longitudinal studies: Employing longitudinal research designs will allow for establishing causal relationships between the variables under investigation.
Objective measurement: Incorporating objective measurement tools alongside self-reported data can enhance the validity and reliability of the findings.
Contextual factors: Exploring additional contextual factors and how they interact with the key variables can provide a richer understanding of the phenomena being studied.
Probability sampling: For exploratory studies, utilizing probability sampling methods during participant selection can strengthen the generalizability of the research.
Spatial models: Given the possible existence of spatial effects on perceived stress, a future work should include spatial econometric methods.
Footnotes
Acknowledgements
We greatly appreciate the collaboration of the public school, the teachers, and the students participating in this study.
Declaration of Conflicting Interests
The author(s) declared no potential conflicts of interest with respect to the research, authorship, and/or publication of this article.
Funding
The author(s) received no financial support for the research, authorship, and/or publication of this article.
Data Availability Statement
The primary datasets used during the current study contain confidential and private information, including addresses of minors, and therefore cannot be shared. However, the processed data used in the models, where such sensitive information has been anonymized, are available upon reasonable request from the corresponding author. In addition, models and detailed model descriptions are also available upon request from the corresponding author.