
Abstract
The world is entering an era of net zero carbon emissions, and companies are under pressure from their stakeholders to be environmentally friendly or green. While companies must engage in greener operations, they also need to juggle their financial performance. Companies need guides on allocating their limited resources to embed green practices and achieve competitive advantage. Academic studies, thus far, have overlooked this. This study aims to fill the gap by studying companies’ green value chain profiles with different competitive advantage attainments. The 207 companies that responded to the survey are classified into four clusters based on their level of competitive advantage: no competitive advantage (cluster 1), only efficiency advantage (cluster 2), only value advantage (cluster 3), and both efficiency and value advantage (cluster 4). The results of variance analysis showed significant differences in eight out of nine value chain activities across the clusters, except green marketing and sales. Companies with competitive advantages demonstrate greater commitment to green activities, especially those from the value advantage-only and both competitive advantage groups. Between them, they embed green initiatives in different value chain activities. Interestingly, green marketing and sales is the only activity with no significant difference among the four clusters of companies, yet they committed the highest green initiatives to this activity. While this study reaffirms the positive impact of companies’ commitment to green initiatives on achieving competitive advantage, companies need to carefully strategize their level of commitment to green initiatives based on the competitive advantage they pursue.
Plain Language Summary
Cutting carbon pollution and going green are two big trends that have been seen. Customers are putting more and more pressure on businesses to care about the environment. But businesses find it hard to match the need to make money with the rising cost of being green. How can businesses use their resources wisely and stay ahead of the competition? What kind of plan should they make? The point of this study is to find out how green different businesses are. The study looked at 207 companies and how well they can set themselves apart from rivals. We looked at how efficient a company is by looking at its 9 green operations functions: inbound logistics, outbound logistics, operations, service, infrastructure, human resources, sales and marketing, technology development, procurement, and inbound logistics. These functions can be broken down into 4 groups. Each group is unique in that it does certain tasks better than the others and has a different amount of green efficiency that lets it compete. The result shows that all functions except marketing and sales give the company an edge over its competitors in some way. Green actions are more likely to be done by companies that have a competitive advantage, especially those in the value advantage-only and both competitive advantage groups.
Introduction
Climate change and environmental issues are key agendas that the United Nations is pursuing. Since 1972, the United Nations has held the United Nations Conference on the Human Environment in Stockholm, Sweden, to urge action to combat climate change (United Nations, n.d.a.). Since then, the United Nations has hosted 12 environmental and sustainable development conferences, laying the groundwork for various commitments and agreements. Among the most significant commitments is the signing of a legally binding contract in the Paris Agreement that brings all nations together to combat climate change (United Nations Framework Convention on Climate Change, n.d.) Furthermore, the United Nations’ Sustainable Development Goals are “a universal call to action to end poverty, protect the planet, and ensure that by 2030 all people enjoy peace and prosperity” (United Nations Development Programme, 2024a), bringing Agenda 2030 to a more actionable and relevant stage for everyone. The United Nations is well aware of the significance of committing non-state actors to combat climate change. As the primary contributors to greenhouse gas emissions (Binns, 2023; Riley, 2017), businesses are inevitably key actors in the transition to a net-zero emissions future. Following the Paris Agreement, the United Nations has set up the High-Level Expert Group on the Net Zero Emissions Commitments of Non-State Entities to establish the proper governance and guide for non-state entities, including businesses in their pledge to net-zero commitment (United Nations, n.d.b.; United Nations’ High-Level Expert Group on the Net Zero Emissions Commitments of Non-State Entities, 2022). The move placed greater pressure on businesses to take genuine actions to be environmentally friendly or green.
Malaysia, as a signatory to the Paris Agreement, has pledged to reduce its “carbon intensity against GDP by 45% by 2030 compared to 2005 levels” (United Nations Development Programme, 2024b) and achieve net zero emissions by 2050 (Ministry of Investment, Trade and Industry, 2023a). In policymaking, the Malaysian government established the Malaysia Climate Change Action Council (MyCAC), chaired by the Prime Minister and in charge of directing climate change policy (Ministry of Natural Resources, Environment and Climate, 2022). The twelfth Malaysia Plan, which guided the country’s development from 2021 to 2025, placed a strong emphasis on sustainability issues, with themes such as “advancing sustainability” alongside “resetting the economy” and “strengthening security, well-being, and inclusivity” (Economic Planning Unit, 2021). A game changer in “advancing sustainability” is “embracing the circular economy,” which aims to “yield significant efficiency gains and cost-effectiveness” and create “a more innovative and competitive economy as well as create new opportunities for green growth” in addition to environmental conservation (Economic Planning Unit, 2021, pp. I–12). Micro, small, and medium-sized enterprises are particularly underinvesting in green initiatives and lagging in environmental indicators of environment, social, and governance (ESG) implementation (Economic Planning Unit, 2021). The government has initiated several policies and programs, including the National Industry Environment, Social and Governance Framework (iESG; Ministry of Investment, Trade and Industry, 2023a), the New Industry Master Plan 2030 with a mission to push for net zero emissions (Ministry of Investment, Trade and Industry, 2023b), tax and financing incentives related to ESG (United Nations Global Compact Network Malaysia & Brunei, 2023) among others.
With the available support and ecosystem, businesses are expected to meet higher green standards. They must prepare themselves to comply and be more transparent with stricter environmental regulations. Bursa Malaysia (2022) required listed companies to disclose their sustainability matters beginning December 2023 onwards and “facilitate greater transparency and consistency in sustainability disclosures” through the development of the Centralised Sustainability Platform with the London Stock Exchange Group (Economic Planning Unit, 2021, pp. 8–24). In addition to regulators, companies are under increasing pressure from various stakeholders who are increasingly concerned about environmental protection and expect companies to increase their green efforts (Mohd Iza Ney et al., 2022). Studies by PDI Technology (2022) and The World Economic Forum (2022) found that approximately three-quarters of consumers of all ages favor green products and are willing to pay a premium price. In the business-to-business segment, companies that do not comply with ESG standards will be excluded from the supply chain of companies that do (United Nations Global Compact Network Malaysia & Brunei, 2023). Similarly, a company’s green commitment improves employee satisfaction (C. Walsh & Sulkowski, 2011), job performance, and organizational citizenship behavior (Aboramadan & Karatepe, 2021). From the financing perspective, green companies are attractive options for investors (Lagerkvist et al., 2020; Sangiorgi & Schopohl, 2021) and access to bank loans (United Nations Global Compact Network Malaysia & Brunei, 2023). From the perspective of performance, studies such as P. R. Walsh and Dodds (2017), Danso et al. (2019), Raharjo (2019), de Azevedo Rezende et al. (2019), and Ong, Goh and Yong (2022) have linked the companies’ green initiatives to the achievement of competitive advantage or performance. They examine the effect of green initiatives on companies’ competitive advantage or performance to identify the critical green initiatives that create superior performance.
The current developments force companies of all sizes to be green. While the industry leaders could have done well, others might have struggled, especially the relatively smaller size companies. Evidence has pointed out that smaller companies are lagging, especially in implementing green initiatives, yet they are conservative in spending on this. Companies need evidence that investment in green does not compromise their achievement of competitive advantage. They need guidance to allocate their scarce resources to be green and achieve competitive advantage. This study used value chain activities (Porter, 1985) as the basis for companies to allocate their resources to green initiatives. The value chain activities are chosen because these activities are the fundamental activities for strategy formulation and the construction of competitive advantage for companies (Porter, 1985) and are the concrete platform for companies to embed their green initiatives. While studies have extended value chain analysis to the context of green (Anthony, 2019; Handfield et al., 1997; Hartman & Stafford, 1998; Kung et al., 2012; Ndubisi & Nair, 2009; Ong, Goh, Goh, & Yong, 2019; Ong, Goh, & Yong, 2022; Yong et al., 2012), none of these studies aim to guide companies in allocating resources to embed green initiatives in different value chain activities in order to construct competitive advantage. Thus, this study poses the research question, “What are the green value chain profiles of companies with different competitive advantage attainments?” This study addresses this research question by examining the green value chain profiles of companies with different levels of competitive advantage attainment, namely no competitive advantage, only efficiency advantage, only value advantage, and both efficiency and value advantage. Competitive advantage is chosen over firm performance as competitive advantage reflects the actual competitiveness of the companies rather than their market performance. Based on their competitive advantage achievement, this study aims to build the green value chain profile of the companies scientifically. The profile provides essential guides for companies allocating resources to embed green initiatives in their value chain activities to build competitive advantage.
Literature Review
The literature review focuses on value chains and developing the green value chain concept. Then, the discussion moves to competitive advantage and, subsequently, the relationship between competitive advantage and green value chains.
The Value Chain Analysis and Green Value Chain
In 1985, Porter proposed value chain analysis as a tool to understand the activities that create value in a company and the costs associated with performing those activities. The value chain activities consist of five primary activities and four supporting activities (Porter, 1985). The five primary activities, namely inbound logistics, operations, outbound logistics, marketing and sales, and service, are the activities that involve creation, transfer, and providing service to the customers (Porter, 1985). These activities are reinforced by support activities that consist of firm infrastructure, human resource management, technology development, and procurement (Porter, 1985). These value chain activities contribute to creating competitive advantage individually and as a whole process of value creation for companies (Porter, 1985). Understanding their own capabilities through value chain activities is key to a successful competitive strategy. The firm’s profitability would depend on how effectively various activities along the value chain are managed. Strategies can be developed to focus on activities that will help businesses attain sustainable competitive advantage. Since then, value chain analysis has been widely used as the fundamental for various research in the context of the recycling industry (Viljoen et al., 2019), virtual reality (De Regt et al., 2020), biomass combined heat power (Panoutsou et al., 2020), and start-up accelerators (Mohammadi & Sakhteh, 2023).
While some literature exists covering value chain activities, the studies remain sparse and are distributed over various themes (Cardoso et al., 2022; Ricciotti, 2020). Similarly, Linkov et al. (2020) found a sparse literature review covering the concept of the value chain in management. A recent systematic review by Ricciotti (2020) uncovered only 66 papers of conceptual and empirical value chain articles identified in the 30 years covering from 1985 to 2017. Ricciotti (2020) further identified literature to converge on themes such as virtual value chain (Corejová et al., 2020), global value chain (Kano et al., 2020), added value chain (McPhee & Wheeler, 2006), reverse value chain (Jayaraman & Luo, 2007); sustainable value chain (Fearne et al., 2012); and value chain resilience (Linkov et al., 2020). In a recent study by Awan et al. (2022), the article accentuated the importance of companies systematizing their business models to align with their value chain activities. Engagement with Industry 4.0 and the circular economy is crucial to internalizing knowledge flows across different value chain segments. Value chain plays a pivotal role in an evolving environment, emphasizing the need for sustainable development.
Handfield et al. (1997) and Hartman and Stafford (1998) started to apply the value chain analysis to the green context. Hartman and Stafford (1998) provided significant development in measuring the green value chain by identifying the “enviropreneurial strategies” and incorporating the green initiatives into the value chain activities. Subsequent works by Ndubisi and Nair (2009) and Yong et al. (2012) provide further conceptual explanations of green value chain activities. Changes in contemporary society’s expectations of businesses go beyond price or convenience factors (Adrita & Mohiuddin, 2020). Consumers are now more conscious and look for environmentally responsible products or services. To remain competitive, businesses are increasingly embedding sustainability strategies in their operations. To enhance sustainability, SMEs integrate lean and green practices among manufacturers. Companies need to save resources and minimize the impact on the environment while balancing the economic needs of the business. Reconstructions in the value chain activities must be undertaken at each activity component to align with green principles and practices.
Ndubisi and Nair (2009) focused on explaining the framework that includes internal and external supports to realize the green value added within a company, while Yong et al. (2012) linked the green value chain activities to companies’ achievement of competitive advantage. In the study by Anthony (2019), the study emphasized the need for companies to identify and group all business functions as primary and secondary activities. Primary activities contribute to the product physically in its development, sales and support, while secondary activities play the support role. By understanding the dependencies of the functions, businesses can map the interrelated relationships, developing the system best suited for optimal performance. The Malaysian study also revealed that sustainable value chain adoption is influenced mainly by internal operational performance driven by strong management commitment to environmental support. Kung et al. (2012), Anthony (2019), and Ong, Goh, Goh, and Yong (2019) have operationalized the construct of the green value chain. Among them, only Ong et al. (2019) adopted Porter’s (1985) nine value chain activities. Ong, Goh, and Yong (2022) subsequently confirmed that green value chain activities are linked to companies’ performance. The results from Ong et al. (2022) highlighted the importance of green technology development in explaining firm performance, yet companies have the lowest commitment to this activity.
Competitive Advantage
Value chain activities form the fundamental basis for the creation of competitive advantage. Hofer and Schendel (1986, p. 25) defined competitive advantage as “the unique positions an organisation develops vis-à-vis its competitors through its pattern of resource deployment and/or scope decisions.” This definition is among earlier efforts to define competitive advantage. Similarly, Porter (1985) focused on the superior positioning of the companies relative to their competitors in defining the competitive advantage. Superior positioning can be either in the form of low cost or differentiation (Porter, 1985). McGrath et al. (1996) refer to these as efficiency advantage and value advantage to denote the companies’ ability to generate superior returns by producing at a much lower cost, selling at a slightly cheaper price, or offering superior value to the customers by commanding a premium price but without incurring excessively higher costs. On top of that, studies like Chen (2019) and Hossain et al. (2020) measure competitive advantage by combining both efficiency and value advantage into a single dimension. Thus, the types of competitive advantage companies can achieve can include efficiency, value, or both.
Recent literature highlights the importance of understanding the relationships and systems within value chain activities and their effect on businesses’ competitive advantage (Ricciotti, 2020). With the optimal integration of activities, businesses can react better to market needs or changes while reducing costs and achieving a competitive advantage over their competitors (Ensign, 2001). Focusing on internal green marketing orientation, Papadas et al. (2019) examined the internal factors, such as internal culture, values, and practices in environmental sustainability, as well as green marketing orientation, in influencing strategic green marketing orientation on competitive advantage. The findings emphasized the role of people (internal activity) interacting with strategy in enhancing the company’s competitiveness. In a study by Chen (2019), supply chain agility was identified as a significant influencer of competitive advantage within the manufacturing industry in Taiwan. The findings highlight the importance of flexibility within the internal system in responding to customer needs in the climate of market uncertainty. Supply chain agility enables companies to reduce production costs while maintaining efficiency, which serves as a point of competitive advantage. Echoing similar results, the study by Jun & Rowley (2019) on the Korean industry found production and manufacturing to be the most value-added activities during the industrial period.
Interestingly, as economies move into knowledge-based industries, R&D, firm infrastructure, manufacturing, logistics, service, and marketing have become the leading source of value-added products for companies that provide a competitive edge. When looking at recent trends in gaining a competitive advantage, it is clear that the use of technology to improve efficiency and sustainability is prevalent. Using technologies and green principles in the value chain helps businesses reduce waste and environmental impact, leading to reduced costs and ensuring long-term sustainability.
Research Methods
This study profiles companies’ green value chain activities based on their competitive advantage attainment. The MANOVA is utilized to assess the significant difference in the nine green value chain activities among four clusters of companies with distinct levels of competitive advantage, specifically those with no competitive advantage, only an efficiency advantage, only a value advantage, and both an efficiency and value advantage. The study used questionnaire survey to collect data from companies. The survey instrument for green value chain activities was constructed based on semi-structured interviews with 35 companies represented by individuals holding managerial positions in various departments. They were asked to indicate important green initiatives for value chain activities. The findings were then condensed and consolidated into 99 items to measure the nine green value chain activities. On the other hand, competitive advantage, consisting of efficiency advantage and value advantage, is adapted from Ong (2017). A total of 13 items are used to measure competitive advantage, seven items for value advantage, and five items for efficiency advantage. A 7-point itemized rating scale is used to measure all the variables. The 7-point scale ranges from strongly disagree to strongly agree. The sampling frame of this study was made up of companies in Bursa Malaysia’s main market and ACE market and the Federation of Malaysian Manufacturers. They represent more established companies in Malaysia which are more likely to have embedded green initiatives in their companies. All the companies within the sampling frame were contacted through mail. A cover letter and an informed consent form were posted with a paid-reply envelope. The respondents were informed through the informed consent form that replying to the survey means they consent to participate in the research. About 217 valid responses were collected through the study.
The data analysis starts with clustering the companies based on their attainment of competitive advantage. The value advantage and efficiency advantage scores are recoded into dichotomous scale of high and low. Since competitive advantage is about the relative strengths of companies, the companies are split in half based on the fifty percentiles of the mean score for both competitive advantage variables. Then, the companies are further grouped into four clusters based on their categories of value advantage and efficiency advantage. Companies that have both low value advantage and differentiation advantage are grouped into Cluster 1 (no competitive advantage). Companies with high efficiency advantage and low value advantage are grouped into Cluster 2 (only efficiency advantage), while the companies with high value advantage and low efficiency advantage are in Cluster 3 (only value advantage). The final cluster, Cluster 4, is made up of companies that score high in both efficiency advantage and value advantage. There are 81 companies in Cluster 1 and Cluster 4 each, while Cluster 2 and Cluster 3 have 21 companies each. The mean scores for the four clusters on all nine green value chain activities are compared using MANOVA, and post hoc analysis is conducted to further identify the pair with significant differences.
Results and Findings
Table 1 shows the demographic information of the companies by cluster. Most of the companies across the four clusters are locally owned. Cluster 2 companies have the highest percentage of samples owned locally (90.5%), while Cluster 3 companies have the lowest rate (76.2%). Similarly, most companies are privately owned, with 97.5% of Cluster 1 companies being privately owned. Cluster 2 and Cluster 4 companies have the least privately owned companies, tied at 71.4%. In terms of the company size by the number of employees, the four clusters of companies show different profiles. More than half of the companies in Cluster 1 are in the category of 251 to 500 employees (21.0%) and 501 to 750 employees (29.6%). Cluster 2 companies, on the other hand, have about half of the companies in the category of 751 to 1,000 employees (23.8%) and 1,001 to 1,500 employees (23.8%). Cluster 3 companies have slightly less than half of them in the category of 501 to 750 employees (28.6%) and 1,001 to 1,500 companies (19.0%), while the Cluster 4 companies have 19.1% of them in the category of 1,001 to 1,500 companies and 25% of them in the category of 2,001 and above employees. This shows that the Cluster 1 companies are relatively small and general while the Cluster 4 companies are relatively larger. There is no obvious difference between Cluster 2 and Cluster 3 companies in terms of size.
Demographic Profile of Companies by Cluster.

Prior to the MANOVA, the homogeneity of covariance matrices and homogeneity of variance tests are conducted. Box’s test of equality of covariance matrices shows the equality of covariance is not fulfilled (F = 1.441; p < .05). Thus, Pillai’s Trace is used for the MANOVA. The results of the MANOVA show that the four competitive advantage clusters of the companies have significant differences in the nine green value chain activities (Pillai’s Trace = 0.542; F = 4.822; p < .05; r2 = .181) with an observed power of 100%. The results of Level’s Test of equality of error variances are shown in Table 2. Based on the results, the equality of variance for outbound logistics (Levene statistic = 6.81; p < .05) and human resource management (Levene statistic = 6.51; p < .05) are not assumed. Thus, the post hoc analysis for these two dependent variables, in case there is a significant difference among the four competitive advantage clusters, is conducted using Dunnett C, while the Tukey test is used for the other seven green value chain activities.
The Results for Levene’s Test of Equality of Error Variances.

Table 3 shows the mean comparison among companies in four different clusters of companies using the univariate One-way ANOVA. The results show significant differences for eight out of the nine green value chain activities, namely inbound logistics (F = 10.02; p < .05), operations (F = 11.30; p < .05), outbound logistics (F = 10.69; p < .05), service (F = 7.19; p < .05), infrastructure (F = 29.57; p < .05), human resource management (F = 14.83; p < .05), technology development (F = 20.97; p < .05), and procurement (F = 17.60; p < .05). The partial eta squared and the observed power for each of the differences in mean across the four clusters of companies on the green value chain activities are also presented to reaffirm the results. The findings show that at least one pair among the four clusters of companies has a significant difference in the eight green value chain activities. Post hoc analysis is conducted to identify the pairs with significant differences for each activity. Dunnet C is used to identify the pairs with a significant difference in green outbound logistics and green human resource management as the equality of variance across the groups is not assumed. The Tukey test is used to identify the pairs with significant differences in each activity for the remaining six green value chain activities. The only green value chain activity with no significant difference based on the univariate one-way ANOVA result is the sales and marketing (F = 1.644; p > .05).
Test for Significant Differences in Green Value Chain Activities.

Table 4 shows the mean distribution of the four clusters of companies for the green value chain activities and the results of the post hoc analysis to test the mean difference. The post hoc analysis provides a graphic representation of the average standing of the four company clusters in the green value chain activities, as well as their respective subsets. The clusters in the same subset are indicated by the same number in superscript in Table 4 and in the same oval in Figure 1. Companies with only value advantage (Cluster 3) have the highest level of green in six value chain activities, namely inbound logistics, operations, outbound logistics, marketing and sales, infrastructure, and procurement. Companies with both value and efficiency advantage (Cluster 4) ranked first in service, technology development, and human resource management. At the same time, they also ranked second in the six value chain activities, topped by companies with only value advantage (Cluster 3). While there is no significant difference among the four clusters of companies in marketing and sales, the post hoc analysis shows that there is no statistical difference among the three clusters of companies with competitive advantage (Cluster 2, 3, & 4) in green inbound logistics, green operations, and green procurement. Interestingly, companies with only value advantage (Cluster 3) and companies with only efficiency advantage (Cluster 2) are found to have no significant difference in green outbound logistics, but a significant difference between companies with only value advantage (Cluster 3) and companies with both competitive advantage (Cluster 4) is confirmed. For green technology development and green human resource management, companies with both competitive advantages (Cluster 4) are found to have significantly higher green elements than companies with only efficiency advantages (Cluster 2). However, no significant difference is found between companies with both competitive advantage (Cluster 4) and companies with only value advantage (Cluster 3) and between companies with only value advantage (Cluster 3) and companies with only efficiency advantage (Cluster 2). For green infrastructure and green service, two subsets without intersections are found. Companies with only value advantage (Cluster 3) and companies with both competitive advantage (Cluster 4) are in one subset that has significantly higher green elements in infrastructure than the subset of companies with only efficiency advantage (Cluster 2) and companies with no competitive advantage (Cluster 1). Companies with both competitive advantages (Cluster 4) stand up against the other three clusters of companies in green service.
Post Hoc Analysis for Significant Differences in Green Value Chain Activities.

Note. SD = standard deviation.
denotes the subsets in post hoc tests.
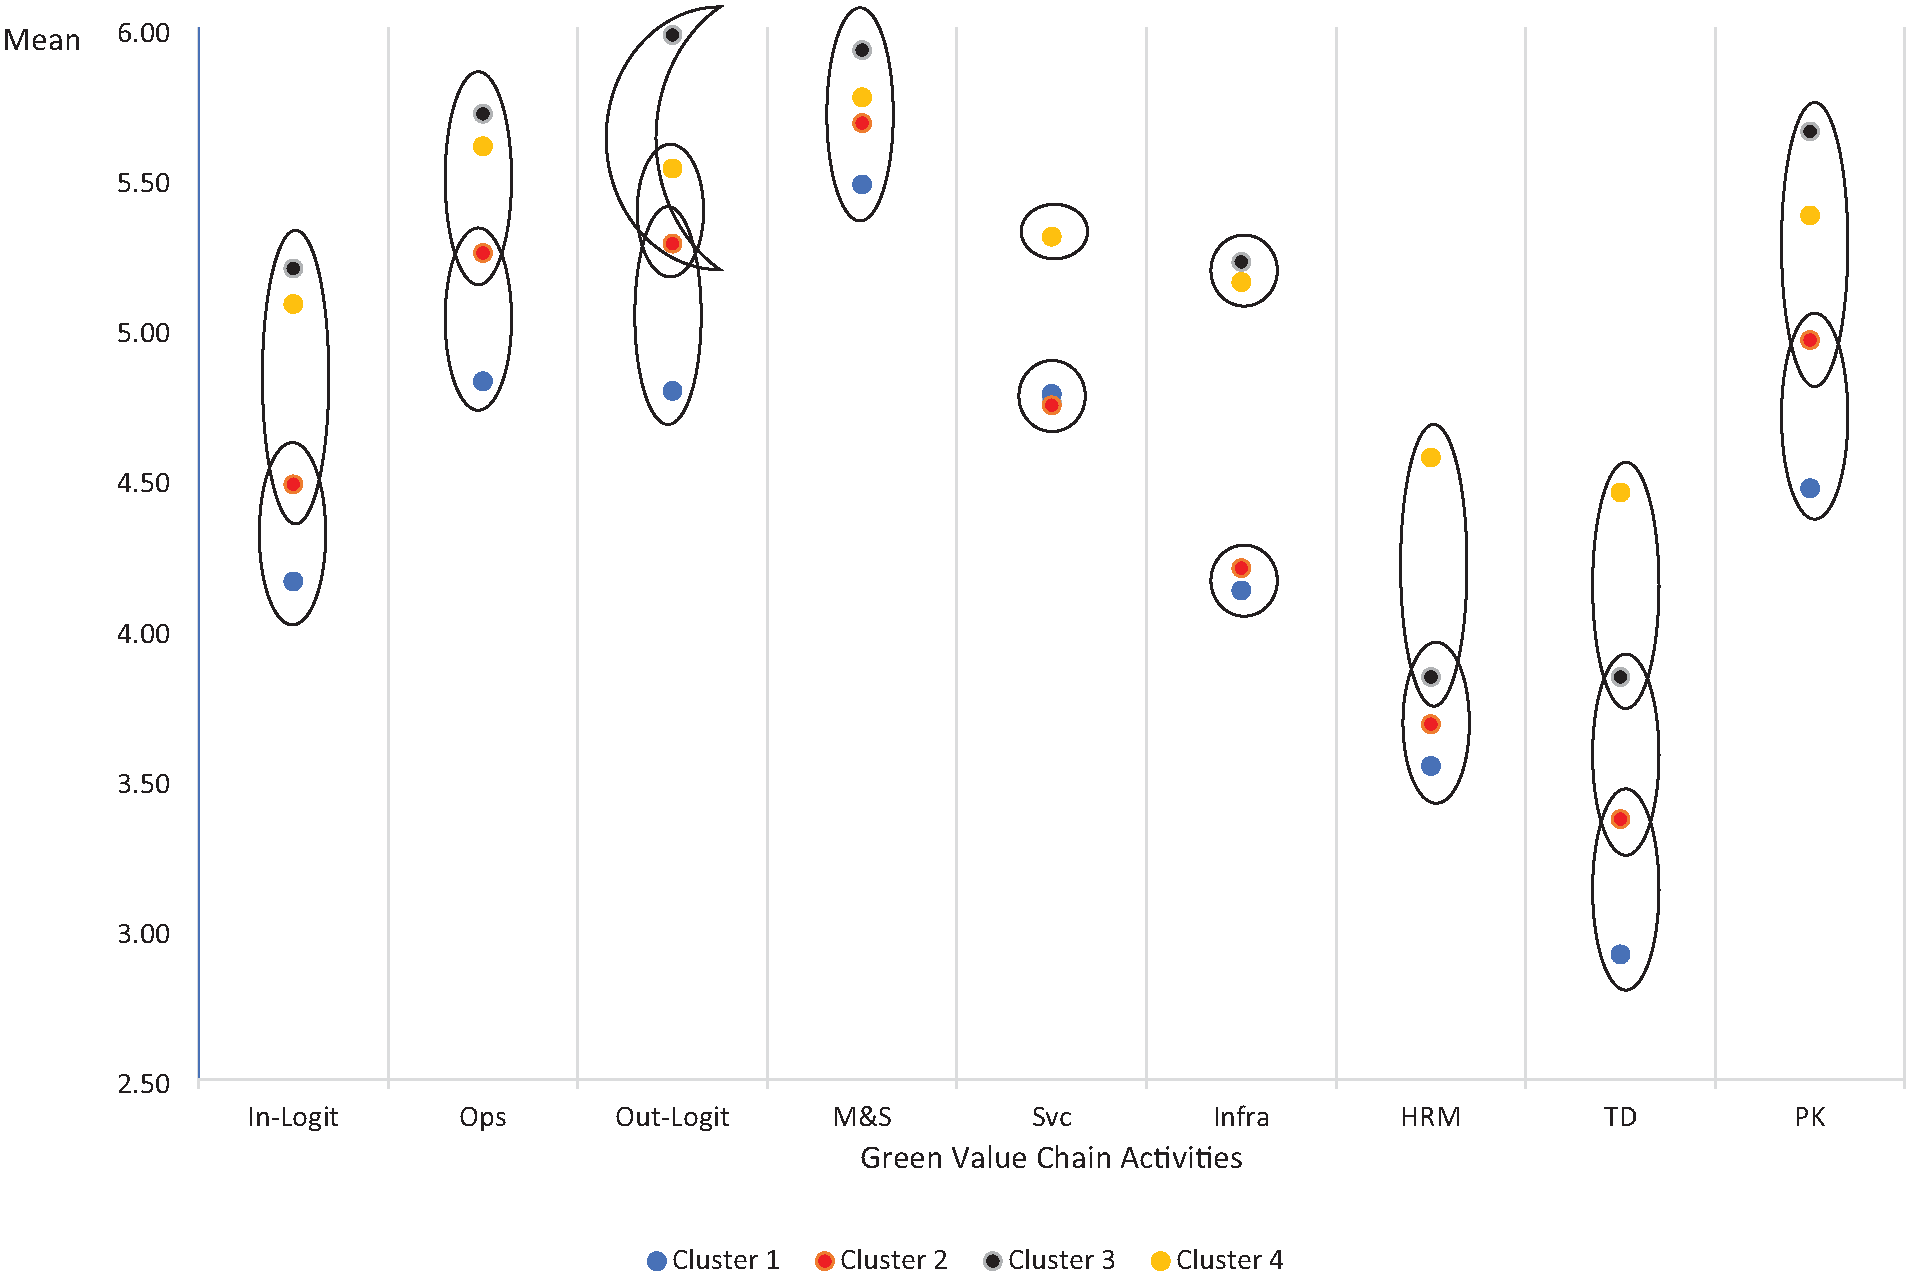
Mapping of green value chain activities.
At the other end of commitment to green initiatives in value chain activities, companies without competitive advantage (Cluster 1) have the lowest green elements in all the value chain activities, except for service that is surprisingly held by companies with only value advantage (Cluster 3). Based on the results of post hoc analysis, companies without competitive advantage (Cluster 1) have no statistical difference with companies with only efficiency advantage (Cluster 2) in all green value chain activities. Marketing and sales aside, companies without competitive advantage have significantly lower green elements in all other value chain activities compared to companies with both competitive advantages (Cluster 4). Compared to companies with only value advantage (Cluster 3), the companies without competitive advantage (Cluster 1) have significantly lower green elements in inbound logistics, operations, outbound logistics, infrastructure, technology development, and procurement.
Discussion
The findings from the statistical analysis indicate that companies with different competitive advantages have different green value chain profiles. This adds to the existing pool of knowledge of the green value chain. While Kung et al. (2012) linked the green value chain to the environmental performance of companies and Ong et al. (2022) confirmed the impact of green value chain on firm performance, this study established the association of the green value chain to the competitive advantage attainment of companies. Companies without competitive advantage have the lowest green elements across the value chain activities. Companies with only efficiency advantage demonstrate a similar profile, with evidence indicating that they are more “green-ready” than those without competitive advantage. At the higher end of green commitment in the value chain are companies with only value advantage and companies with both value and efficiency advantage. This confirms the importance of embedding green initiatives in enhancing companies’ value creation. This indirectly supports the idea that value chain activities create a competitive advantage for companies (Porter, 1985) in the green context. The findings are also in line with Handfield et al. (1997) suggestion that the green elements must be embedded along the value chain. However, a closer look at the findings suggests that companies with different competitive advantage attainments prioritize their resource allocation to different value chain activities. In addition to the main findings, a few critical observations can be drawn from the results.
Companies with only efficiency advantage are in an interesting positioning with their green commitment in their value chain. While they share a similar green value chain profile with companies without a competitive advantage, they ensure minimum gaps exist between them and the companies with only value advantage and companies with both competitive advantages are kept minimum, especially in the primary value chain activities. They make a “strategic” choice to focus on green initiatives that reduce operational costs while avoiding investing in supporting value chain activities. This is further evidenced in the wider gaps between them and the companies with only value advantage and companies with both competitive advantages, especially in green infrastructure, green human resource management, and green technology development. Companies with both competitive advantages appear to have invested the most green initiatives in supporting value chain activities. Relatively, they are willing to invest in grooming the green talents and developing green technology that the others are least willing to spend. These reinforced the findings of de Azevedo Rezende et al. (2019), Chege and Wang (2020), and Ong et al. (2022) on the importance of technology development and Papadas et al. (2019) on the importance of people in creating competitive advantage and superior performance in the context of green. Particularly, de Azevedo Rezende et al. (2019) highlight the importance of green technology in enhancing companies’ capability to reduce waste, improve efficiency, and enhance the green image. This explains the importance of green technology development for companies with both efficiency and value advantages. Nonetheless, their findings also alert that companies need to constantly invest in green technology development as the technology’s impact lasts for 3 years. Together with green service, these appear to be the key green value chain activities that distinguish the companies with both competitive advantages from the other companies.
The findings reveal that companies with only differentiation advantage and companies with both competitive advantages have greener profiles than their peers. Although the profiles are largely similar statistically, a strategy is plotted for them to decide where to embed the green initiatives in their value chain. Having both value and efficiency advantages does not mean they must commit most in all value chain activities. Instead, they choose to focus on green service, green human resource management, and green technology development. Human resource and technology are two deep-lying capabilities of the companies. They need time to build and are difficult to imitate. More importantly, they serve as the fundamental to all other capabilities within the company. This could explain why companies with both efficient and value advantages distinguish themselves in these two green activities. On the other hand, companies with value advantage have an eye on building the greenest profiles in the primary value chain activities, infrastructure, and procurement. Companies with both competitive advantages can clearly distinguish themselves in their leading green value chain.
Lastly, regardless of their competitive advantage, companies are investing heavily in greening their marketing and sales activities. The score of companies with only value advantage in outbound logistics aide, all companies have their highest level of green commitment in sales and marketing based on mean scores. Interestingly, marketing and sales are the only green value chain activities that do not record a significant difference across the four clusters of companies. These indicates that companies, regardless of their competitive advantage, are committing the highest and similar efforts in greening their marketing and sales. Upon examination, the results suggest that green initiatives in marketing and sales do not differentiate companies with varying competitive advantages, as all of them are equally committed to a high level of green marketing and sales activities in their value chain. A deeper level of interpretation is the possibility of greenwashing among companies, especially companies that commit lowly to green initiatives in other value chain activities but are high on marketing and sales. While further evidence is needed to confirm the claim, this initial findings support the United Nations initiative in forming the United Nations’ High-Level Expert Group on the Net Zero Emissions Commitments of Non-State Entities (2022) and Malaysian government initiatives to build the Centralised Sustainable Platform (Economic Planning Unit, 2021) to govern the green reporting among the companies.
Implications of the Study
This study takes an alternative perspective to examine the level of green initiatives on the value chain activities of companies with different competitive advantages. This approach aligns with the study’s key objective to guide companies in building competitive advantage through greening their value chain. This guides the companies to be more targeted in embedding green elements in their value chain activities by optimizing their scarce resources based on their intended competitive advantage. This is especially important for smaller size companies that are found to be lagging yet reluctant to invest in green (Economic Planning Unit, 2021) to learn from their larger counterparts. However, it is essential to note that the suggestions are based on green initiatives in the value chain activities and the firm’s competitive advantage. The profitability of the companies is not considered in this study.
For companies without a competitive advantage, their first step toward competitive advantage should be efficiency advantage. They must lift their green activities slightly across the green value chain activities to be more green-ready. They need to start investing in all green activities incrementally. This is a more feasible option to pursue compared to the value advantage. This might be a good option for smaller companies with limited spending capacity. To pursue value advantage, the companies without competitive advantage need to invest drastically in strengthening the green activities in inbound logistics, operations, outbound logistics, technology development, and procurement. They are expected to commit significant resources and change their operation model drastically to make this shift. Thus, smaller companies need to ensure the availability of capital injection to pursue value advantage through the green value chain.
While it is not strategically feasible for companies with efficiency advantages to switch to value advantages and vice versa, this will not be of interest to this study. However, companies with efficiency and value advantages can move to acquire the other competitive advantage. Companies with efficiency advantages will find acquiring value advantages more challenging than those with value advantages to acquire the efficiency advantages. Both clusters of companies are expected to make substantial investments in enhancing their green practices in services. However, companies with a competitive edge in efficiency must also make significant efforts to improve their green infrastructure, green human resources management, and green technology development. On the other hand, companies with value advantage need to manage the level of green activities more strategically in their primary value chain activities.
The findings can also benefit policymakers and the government by assisting companies in their journey to be green. They can create smaller fundings to aid companies’ initial journey to be green, focusing on greening their primary value chain activities, such as inbound and outbound logistics and operations. In tracking the effectiveness of the funding, the government should focus on monitoring the efficiency and cost reduction through those green initiatives in their primary activities. However, the government needs to know that greater funding is needed for companies to create higher value through green. The government could provide more incentives to encourage the participation of companies, local and abroad, in establishing a more robust green ecosystem. This will help lower companies’ costs to embed green initiatives in both their primary and secondary activities, especially investing in green infrastructures. At this stage, the government should prioritize monitoring of the companies’ ability to deliver exceptional value to their customers. In addition, the government should intensify efforts to incentivize companies to develop green technology and train more specialists in the field of sustainability. These are the key activities to build companies with both efficiency and value advantage, on top of green services. However, as noted previously, the government needs to strengthen the governance of the marketing and sales activities that claim the companies or the products to be green. On top of greater transparency in reporting their green activities, a possible way is to adopt an audit and certification of green for companies and products. While this might increase the cost of doing business, protecting the consumers, investors, and communities who favor green products is important. This initiative is crucial to lift the companies and the country toward the carbon net zero target.
Limitations of the Study and Recommendations for Future Research
The relatively low sample size in Cluster 2 and Cluster 3 might have an impact on the findings. Future research could replicate the study with a larger sample size to overcome this limitation. In addition, subsequent studies may need to focus more on the role of green marketing and sales. This study found that green marketing and sales are the only value chain activity with no significant difference across companies with different competitive advantage attainments. Yet, all companies put high emphasis on this activity. Besides that, future research might be interested in further investigating the role of green experts and proprietary technology in achieving both efficiency and value advantage. This study found that companies with efficiency and value advantage are distinguished from companies without competitive advantage and companies with only efficiency advantage in these two activities, but not from companies with only value advantage, despite the highest mean difference recorded for these two activities among the nine green value chain activities.
Conclusion
This study identifies the green profile of companies with different levels of competitive advantage attainment that was not addressed in previous research. Companies with value advantage and companies with both efficiency and value advantages commit to more green initiatives in their value chain than companies without competitive advantage and with only efficiency advantage. Thus, based on the green initiatives in the value chain, it is easier for companies without competitive advantage to acquire an efficiency advantage than a value advantage first. Similarly, it is also easier for companies with a value advantage to acquire an efficiency advantage than for companies with an efficiency advantage to acquire a value advantage. Companies should use the study’s findings to guide them in allocating resources strategically to embed green initiatives in their value chain and align them with their competitive advantage.
Footnotes
Declaration of Conflicting Interests
The author(s) declared no potential conflicts of interest with respect to the research, authorship, and/or publication of this article.
Funding
The author(s) disclosed receipt of the following financial support for the research, authorship, and/or publication of this article: The authors would like to express appreciation for the support of Ministry of Higher Education Malaysia for funding this project under the Fundamental Research Grant Scheme (FRGS) entitled The Green Value Chain Index (FRGS/2/2013/SS05/MMU/02/1).
Ethical Approval and Consent to Participate
This study has been performed in accordance with the Declaration of Helsinki. For the respondents who participated, they were asked to read the ethical statement (There is no compensation for responding nor is there any known risk. In order to ensure that all information will remain confidential, please do not include your name. Participation is strictly voluntary and you may refuse to participate at any time) and proceed only if they agree. No data was collected from anyone under 16 years old.
Data Availability Statement
The datasets generated during and/or analyzed during the current study are available from the corresponding author on reasonable request.